| Issue |
A&A
Volume 622, February 2019
|
|
|---|---|---|
| Article Number | A154 | |
| Number of page(s) | 6 | |
| Section | Atomic, molecular, and nuclear data | |
| DOI | https://doi.org/10.1051/0004-6361/201834795 | |
| Published online | 12 February 2019 | |
Experimental transition probabilities for 4p – 4d spectral lines in V II
1
Lund Observatory, Lund University, Box 43, 22100 Lund, Sweden
e-mail: This email address is being protected from spambots. You need JavaScript enabled to view it.
2
Department of Physics, University of Gothenburg, 412 96 Gothenburg, Sweden
3
Department of Physics, Lund University, Box 118, 22100 Lund, Sweden
4
Applied Mathematics and Material Science, Malmö University, 20506 Malmö, Sweden
Received:
7
December
2018
Accepted:
2
January
2019
Abstract
Aims. We aim to measure lifetimes of levels belonging to the 3d3(4F)4d subconfiguration in V II, and derive absolute transition probabilities by combining the lifetimes with experimental branching fractions.
Methods. The lifetimes were measured using time-resolved laser-induced fluorescence in a two-photon excitation scheme. The branching fractions were measured in intensity calibrated spectra from a hollow cathode discharge lamp, recorded with a Fourier transform spectrometer.
Results. We report lifetimes for 13 levels at an energy around 73 000 cm−1. Absolute transition probabilities of 78 lines are derived by combining the lifetimes and branching fractions. The experimental values are compared with theoretical data from the literature.
Key words: atomic data / line: identification / methods: laboratory: atomic / techniques: spectroscopic
© ESO 2019
1. Introduction
Vanadium has a high abundance in many astrophysical objects. The solar abundance of vanadium is AV = 3.99 (AV = log[NV/NH] + 12) (Lodders et al. 2009), and spectral lines of vanadium are seen in the spectra of for example χ-Lupi (Brandt et al. 1999) and η Carinae (Hartman et al. 2004). The 4p-4d lines from the highly excited levels reported in this paper are important to benchmark theoretical calculations of spectroscopic data and to test stellar atmosphere models.
The present paper is part of an ongoing project where lifetimes of high excitation levels in the iron-group elements are measured (Engström et al. 2014; Hartman et al. 2015, 2017; Lundberg et al. 2016; Quinet et al. 2016).
The ground configuration in V II is 3d4, closely followed by 3d34s, starting at 2605 cm−1. The first odd configuration is 3d34p at 34 592 cm−1. The even 3d35s and 3d34d configurations start at 69146 cm−1 and 72 448 cm−1, respectively. An extensive analysis of the V II term system was reported by Thorne et al. (2013) based on high resolution Fourier transform spectroscopy. They reported energies for 176 even and 233 odd levels, and wavelengths for 1242 classified spectral lines.
Previous work on lifetimes and transition probabilities in V II include Roberts et al. (1973) who reported absolute and relative oscillator strengths derived by combining lifetimes measured with the beam foil technique and branching rations measured in a stabilized arc. In two papers Goly & Weniger (1981, 1984) published absolute log(gf)-values for 99 lines measured in a wall-stabilized arc. The same technique was utilized by Wujec & Musielok (1986), who reported transition probabilities for 211 lines in V II. Karamatskos et al. (1986) reported lifetimes of 12 levels measured by laser excited fluorescence from a sputtered metal vapor. Schade et al. (1987) reported 13 lifetimes measured with selective laser excitation and time resolved observation of the fluorescence signal. Biémont et al. (1989), measured six lifetimes with time resolved laser induced fluorescence (TR-LIF) and branching fractions (BFs) from emission spectra recorded with the Kitt Peak National Observatory 1-m Fourier transform spectrometer. Combining the lifetimes with the BFs they obtained a total of 133 V II transition probabilities. Xu et al. (2006) reported TR-LIF lifetimes for 11 levels in V II. Den Hartog et al. (2014) reported lifetimes of 31 levels in V II (and for 168 lifetimes of levels in V I) measured using TR-LIF. Wood et al. (2014) reported log(gf)-values from 203 lines, derived by combining lifetimes from the literature and branching fractions measured in spectra recorded with the Fourier transform spectrometer at the Kitt Peak National Solar Observatory and an echelle spectrometer at the University of Wisconsin. All these papers report on lines originating from the first excited odd configurations, 3d34p or 3d24s4p except for 12 lines reported by Wujec & Musielok (1986) between the, 4p – 4d and 4p – 5s configurations. A critical compilation of V II can be found in Saloman & Kramida (2017). In this work we report the first measurements of lifetimes and BFs for higher even levels in V II.
2. Laboratory measurements
2.1. Lifetimes
The lifetimes were measured at the High Power Laser Facility at Lund University. The experimental set up for two-photon excitations has been described in detail in for example Engström et al. (2014) and only a brief overview will therefore be given here.
The V+ ions were produced in an ablation plasma created by focusing a frequency doubled ND:YAG laser (Continuum Surelite) on a rotating target made out of vanadium. The target was placed in a vacuum chamber with a pressure of 10−4 mbar. The levels were populated in a two-photon excitation scheme, using a frequency doubled injection seeded ND:YAG (Continuum NY-82) pumping a Continuum ND-60 dye laser using a DCM dye. The output was temporally compressed using stimulated Brillouin scattering in water resulting in a FWHM of 1.2 ns. All lasers operate at 10 Hz and the relative timing was controlled with a delay generator. The excitation laser was adjusted both in time and space to overlap with the ablation plasma, approximately 5 mm above the vanadium sample in the target chamber.
The fluorescence signal was filtered out with a 1/8 m monochromator and detected perpendicular to the excitation and ablation lasers with a fast multichannel plate photo multiplier tube (Hamamatsu R3809U). The signal was recorded with an oscilloscope (Tektronix DPO 7254). In addition, the shape of the excitation pulse was simultaneously recorded with a fast diode. The decay curves were analyzed using the code DECFIT (Palmeri et al. 2008) where we fit a single exponential decay convoluted by the measured excitation laser pulse and a constant background. Each measurement was obtained by accumulating 1000 laser shots, and the final lifetimes were derived by averaging 10–20 measurements performed over several days.
To verify that the correct level was excited we checked that all expected decay channels could be observed and, where possible, the lifetime was measured in all sufficiently intense decay channels. Furthermore, in some cases it was possible to utilize several excitation schemes to reach the level.
In the measurements of the e5P levels the fluorescence signal and the excitation pulse were close in wavelength and scattered laser light was therefore present in the recorded signal. This was corrected for by turning off the ablation laser and record the scattered laser light, which could be subtracted from the measured lifetime curve.
The lifetimes obtained are given in Table 1. The different excitation schemes and detection channels are included in Cols. 3 and 4. The quoted uncertainties are based on the variation between the repeated measurements. Our experimental lifetimes are compared with the semi empirical values calculated by Kurucz (1995, 2013).
Experimental details and the measured lifetimes of the 3d3(4F)4d levels in V II.
2.2. Branching fractions and transition probabilities
The BF is defined as:
 (1)
(1)
where u and l denotes the upper and lower level, respectively and A the transition probability. However, if the spectra are intensity calibrated, (1) can be rewritten as:
 (2)
(2)
where Iuk is the calibrated intensity. Finally, since
 (3)
(3)
the desired transition probability can be obtained from:
 (4)
(4)
The transition probability can thus be derived if the lifetime of the upper level is known, and if all lines from this level can be measured. The last requirement is rarely possible since all lines will contribute to the sum, but not all lines are strong enough to be measured in the laboratory. The contribution from lines not measured is called the “residual”, which can be estimated using theoretical calculations.
The BFs were measured from spectra recorded with a Fourier transform spectrometer (Chelsea Instruments FT 500). The maximum path difference between the mirrors is 20 cm, giving a resolving power of 106 at 2000 Å. Free V+ ions were produced in a hollow cathode discharge (HCD) lamp. Spectra were recorded using neon, argon and a mixture of both neon and argon as carrier gases at different gas pressures (0.5–2.0 Torr) and currents (0.1–1.0 A). No self absorption could be seen using these values. The low excitation 4s-4p lines gave nearly the same intensities with neon and argon, while the high excitation 4p-4d lines were clearly much stronger running the HCD with argon at low currents and a pressure of 2 Torr. This enhancement could be caused by selective excitation due to charge transfer (Johansson & Litzén 1980). The spectra were intensity calibrated with a deuterium lamp with a known spectral intensity distribution measured at the Physikalisch-Technische Bundesanstalt, Berlin, Germany with an uncertainty of 4%. All lines from the measured 4d levels fall in an interval between 35 000 and 38 600 cm−1 (2595–2850 Å). However, they show up as two distinct groups, one around 36 000 cm−1 where the upper 4d levels combine with 4p z3D, z5F and z5D, and one group around 38 000 cm−1, with combinations to z5G. This is illustrated in Fig. 1. The intensity of the spectral lines was measured as the area of a fitted line profile obtained using the code GFit (Engström 1998). The residuals (ranging from 0.003 to 0.11) were estimated using the theoretical results of Kurucz (1995) and are included in Table A.1. Even though the uncertainty in these values may be quite large their influence on the BFs is small in most cases.
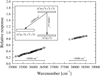 |
Fig. 1. Relative response of the Fourier transform spectrometer and detector. The insert shows the origin of the gap in energy between the two line groups due to the lower energy of 4p z5G. |
Vanadium has two naturally occurring isotopes, 51V (99.75%) and 50V (0.25%). The dominant isotope, 51V, has a nuclear spin I = 7/2 which, combined with the large nuclear magnetic moment (μ/μN = 5.1514), give rise to a noticeable hyperfine structure pattern in many lines. However, the lines in this study did not show any resolved hyperfine structure. This is due to the weak interaction with the nucleus for the 4d and 4p electrons, resulting in a smaller hyperfine splitting than the Doppler width of the lines.
One minor experimental problem concerns the strong z5F4 – e5G5 (λ 2771.359) transition which is blended by the line z5F1 – e5F2 (λ 2771.373) resulting in a slightly too large measured BF. However, the extra intensity added should only give rise to a small contribution. Assuming that the z5F1 – e5F2 transition has a branching fraction of 0.06 (Kurucz 1995) the change in the BF for the z5F4 – e5G5 line will be from 0.405 to 0.390. In the newer calculation (Kurucz 2013) the BF of the z5F1 – e5F2 line is even less, only 0.016. We have therefore not corrected for this, although we have increased the uncertainty accordingly.
The total uncertainty in the transition probabilities span between 6 and 26%, and are estimated as suggested by Sikström et al. (2002), including the uncertainty in the lifetimes, area measurement and intensity calibration. The observed branching fractions and derived log(gf)-values are presented in Table A.1 and compared with the theoretical results of Kurucz (1995, 2013).
3. Discussion
The only available complete theoretical investigations involving the 4d levels in V II are the two calculations by Kurucz (1995) and Kurucz (2013), henceforth referred to as K95 and K13. Both are performed with a modified version of the code by Cowan (1981) and use experimental level energies to optimize the values of some radial integrals. All our 78 BFs are compared with K95 in Fig. 2 and with K13 in Fig. 3. The standard deviations (σ) are 0.048 and 0.054 for K95 and K13, respectively. Although the two calculations have almost the same overall standard deviation, a more detailed comparison reveals interesting differences.
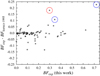 |
Fig. 2. All measured branching fractions for the 4p-4d transitions in V II compared with Kurucz (1995). The circled data are not calculated, but experimental values from Martin et al. (1988). See discussion in text. |
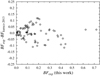 |
Fig. 3. All measured branching fractions for the 4p-4d transitions in V II compared with Kurucz (2013). |
It can be seen in Table A.1, that for lines from e5P, the values from K13 are in significantly better agreement with our results (σ = 0.019) than K95 (σ = 0.088). This is especially clear when looking at the lines from the e5P3 level. For the z3D3–e5P3 intercombination line, the experimental BF is 0.098 while the theoretical values are 0.230 and 0.092 for K95 and K13, respectively. For the z5D4–e5P3 the experimental BF is 0.719 compared to the K95 value of 0.492 and the K13 of 0.692. Furthermore, the differences can be seen in Table 1, where the lifetimes from K13 are in better agreement with our experimental values for the e5P term than K95, particularly for the e5P3 level which deviates from the other e5P levels. The most likely explanation for the latter discrepancy is that the published transition probability for the strong z5D4–e5P3 line is not that calculated in K95 but the experimental value from Martin et al. (1988) which is, in turn, rescaled form Wujec & Musielok (1986). This experimental transition probability is clearly too low. The same substitution of experimental data has been done for the z5D3–e5P2 transition. These two points are marked with blue circles in Fig. 2. If we assume that the lifetime of the three e5P levels are the same and recalculate the theoretical BFs we find that the standard deviation for K95 is reduced to 0.023, that is, almost identical to K13 (σ = 0.019).
For the lines depopulating e5F and e5G the K95 calculations gives in general a better agreement with our experimental values, except for z3D3–e5G4 where again the K13 value is taken from Martin et al. (1988). This point is marked with a red circle in Figs. 2 and 5. The standard deviation for K95 is σ = 0.036 while it is σ = 0.059 for K13. The larger scatter when comparing the experimental BFs with K13 is clearly seen in Figs. 4 and 5. Thus, a somewhat surprising conclusion is that the older calculation in K95 is actually to be preferred over the newer K13, at least when it comes to the 4p – 4d transitions. For the lifetimes in e5F and e5G Table 1 shows that K95 overestimates the values by about the same amount that K13 underestimates them, although both are very close to the experimental results within the estimated uncertainties. But it is important to understand that the complexity of the iron group elements makes it very hard to calculate accurate transition probabilities and it is therefore necessary to benchmark the calculations with experimental measurements.
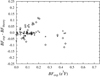 |
Fig. 4. Experimental branching fractions from 3d3(4F)4d 5F compared with Kurucz (1995) (⋆) and Kurucz (2013) (⋄). |
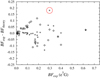 |
Fig. 5. Experimental branching fractions from 3d3(4F)4d e5G compared with Kurucz (1995) (⋆) and Kurucz (2013) (⋄). The circled data is not calculated, but experimental values from Martin et al. (1988). See discussion in text. |
4. Summary
In this paper we report the first laboratory measurements of lifetimes for levels belonging to the 3d34d configuration in V II. A total of 13 lifetimes are measured and given in Table 1. The combination of the lifetimes and BFs measured in spectra recorded from a hollow cathode discharge lamp have yielded transition probabilities of 78 4p-4d spectral lines presented in Table A.1. A comparison with available theoretical calculations Kurucz (1995, 2013) illustrates the difficulties in the complex term systems of the iron group elements and the need for experimental data to benchmark the results.
Acknowledgments
This work was supported by the Swedish Research Council through the Linnaeus grant to the Lund Laser Centre and the Knut and Alice Wallenberg Foundation. HH gratefully acknowledges the grant no 2016-04185 from the Swedish Research Council.
References
- Biémont, E., Grevesse, N., Faires, L. M., et al. 1989, A&A, 209, 391 [NASA ADS] [Google Scholar]
- Brandt, J. C., Heap, S. R., Beaver, E. A., et al. 1999, AJ, 117, 1505 [NASA ADS] [CrossRef] [Google Scholar]
- Cowan, R. D. 1981, The Theory of Atomic Structure and Spectra (Berkeley: Univ. of California Press) [Google Scholar]
- Den Hartog, E. A., Lawler, J. E., & Wood, M. P. 2014, ApJS, 215, 7 [NASA ADS] [CrossRef] [Google Scholar]
- Engström, L. 1998, Lund Reports in Atomic Physics (LRAP-232) Atomic Physics, Lund University, http://kurslab-atom.fysik.lth.se/Lars/GFit/Html/index.html [Google Scholar]
- Engström, L., Lundberg, H., Nilsson, H., Hartman, H., & Bäckström, E. 2014, A&A, 570, A34 [NASA ADS] [CrossRef] [EDP Sciences] [Google Scholar]
- Goly, A., & Weniger, S. 1981, J. Quant. Rad. Transf., 25, 381 [NASA ADS] [CrossRef] [Google Scholar]
- Goly, A., & Weniger, S. 1984, J. Quant. Rad. Transf., 32, 61 [NASA ADS] [CrossRef] [Google Scholar]
- Hartman, H., Gull, T., Johansson, S., Smith, N., & the Eta Carinae Treasury Project Team 2004, A&A , 419, 215 [NASA ADS] [CrossRef] [EDP Sciences] [Google Scholar]
- Hartman, H., Nilsson, H., Engström, L., & Lundberg, H. 2015, A&A, 584, A24 [NASA ADS] [CrossRef] [EDP Sciences] [Google Scholar]
- Hartman, H., Engström, L., Lundberg, H., et al. 2017, A&A, 600, A108 [NASA ADS] [CrossRef] [EDP Sciences] [Google Scholar]
- Johansson, S., & Litzén, U. 1980, J. Phys. B: Molec. Phys. , 13, L253 [CrossRef] [Google Scholar]
- Karamatskos, N., Michalak, R., Zimmermann, P., Kroll, S., & Kock, M. 1986, Z. Phys. D, 3, 391 [NASA ADS] [CrossRef] [Google Scholar]
- Kurucz, R. L. 1995, Atomic Spectral Line Data from CD-ROM No. 23, Available at http://www.cfa.harvard.edu/amp/ampdata/kurucz23/sekur.html [Google Scholar]
- Kurucz, R. L. 2013, http://kurucz.harvard.edu/atoms/2301/ [Google Scholar]
- Lodders, K., Palme, H., & Gail, H. P. 2009, in Abundances of the Elements in the Solar System, ed. J. Trümper (Berlin: Springaer-Verlag), Landolt-Börnstein, New Series, Chap. 4.4, VI/4B, 560 [Google Scholar]
- Lundberg, H., Hartman, H., Engström, L., et al. 2016, MNRAS, 460, 356 [NASA ADS] [CrossRef] [Google Scholar]
- Martin, G. A., Fuhr, J. R., & Wiese, W. L. 1988, J. Phys. Chem. Ref. Data , 17 [Google Scholar]
- Palmeri, P., Quinet, P., Fivet, V., et al. 2008, Phys. Scr., 78, 015304 [NASA ADS] [CrossRef] [Google Scholar]
- Quinet, P., Fivet, V., Palmeri, P., et al. 2016, MNRAS, 462, 3912 [NASA ADS] [CrossRef] [Google Scholar]
- Roberts, J. R., Andersen, T., & Sorensen, G. 1973, ApJ, 181, 587 [NASA ADS] [CrossRef] [Google Scholar]
- Saloman, E. B., & Kramida, A. 2017, ApSS, 231, 19 [NASA ADS] [Google Scholar]
- Schade, W., Langhans, G., & Helbig, V. 1987, Phys. Scr., 36, 890 [NASA ADS] [CrossRef] [Google Scholar]
- Sikström, C. M., Nilsson, H., Litzén, U., Blom, A., & Lundberg, H. 2002, J. Quant. Spectr. Rad. Transf., 74, 355 [Google Scholar]
- Thorne, A. P., Pickering, J. C., & Semeniuk, J. I. 2013, ApJS, 207, 13 [NASA ADS] [CrossRef] [Google Scholar]
- Wood, M. P., Lawler, J. E., Den Hartog, E. A., Sneden, C., & Cowan, J. J. 2014, ApJS, 214, 18 [NASA ADS] [CrossRef] [Google Scholar]
- Wujec, T., & Musielok, J. 1986, J. Quant. Spectr. Rad. Transf., 36, 7 [NASA ADS] [CrossRef] [Google Scholar]
- Xu, H.-L., Jiang, Z.-K., & Lundberg, H. 2006, J. Opt. Soc. Am. B, 23, 2597 [NASA ADS] [CrossRef] [Google Scholar]
Appendix A: Additional table
Branching fractions and oscillator strengths for 3d3 (4F)4p–3d3 (4F)4d transitions in V II.
All Tables
Experimental details and the measured lifetimes of the 3d3(4F)4d levels in V II.
Branching fractions and oscillator strengths for 3d3 (4F)4p–3d3 (4F)4d transitions in V II.
All Figures
|
Fig. 1. Relative response of the Fourier transform spectrometer and detector. The insert shows the origin of the gap in energy between the two line groups due to the lower energy of 4p z5G. |
| In the text | |
|
Fig. 2. All measured branching fractions for the 4p-4d transitions in V II compared with Kurucz (1995). The circled data are not calculated, but experimental values from Martin et al. (1988). See discussion in text. |
| In the text | |
|
Fig. 3. All measured branching fractions for the 4p-4d transitions in V II compared with Kurucz (2013). |
| In the text | |
|
Fig. 4. Experimental branching fractions from 3d3(4F)4d 5F compared with Kurucz (1995) (⋆) and Kurucz (2013) (⋄). |
| In the text | |
|
Fig. 5. Experimental branching fractions from 3d3(4F)4d e5G compared with Kurucz (1995) (⋆) and Kurucz (2013) (⋄). The circled data is not calculated, but experimental values from Martin et al. (1988). See discussion in text. |
| In the text | |
Current usage metrics show cumulative count of Article Views (full-text article views including HTML views, PDF and ePub downloads, according to the available data) and Abstracts Views on Vision4Press platform.
Data correspond to usage on the plateform after 2015. The current usage metrics is available 48-96 hours after online publication and is updated daily on week days.
Initial download of the metrics may take a while.