Free Access
Fig. 1.
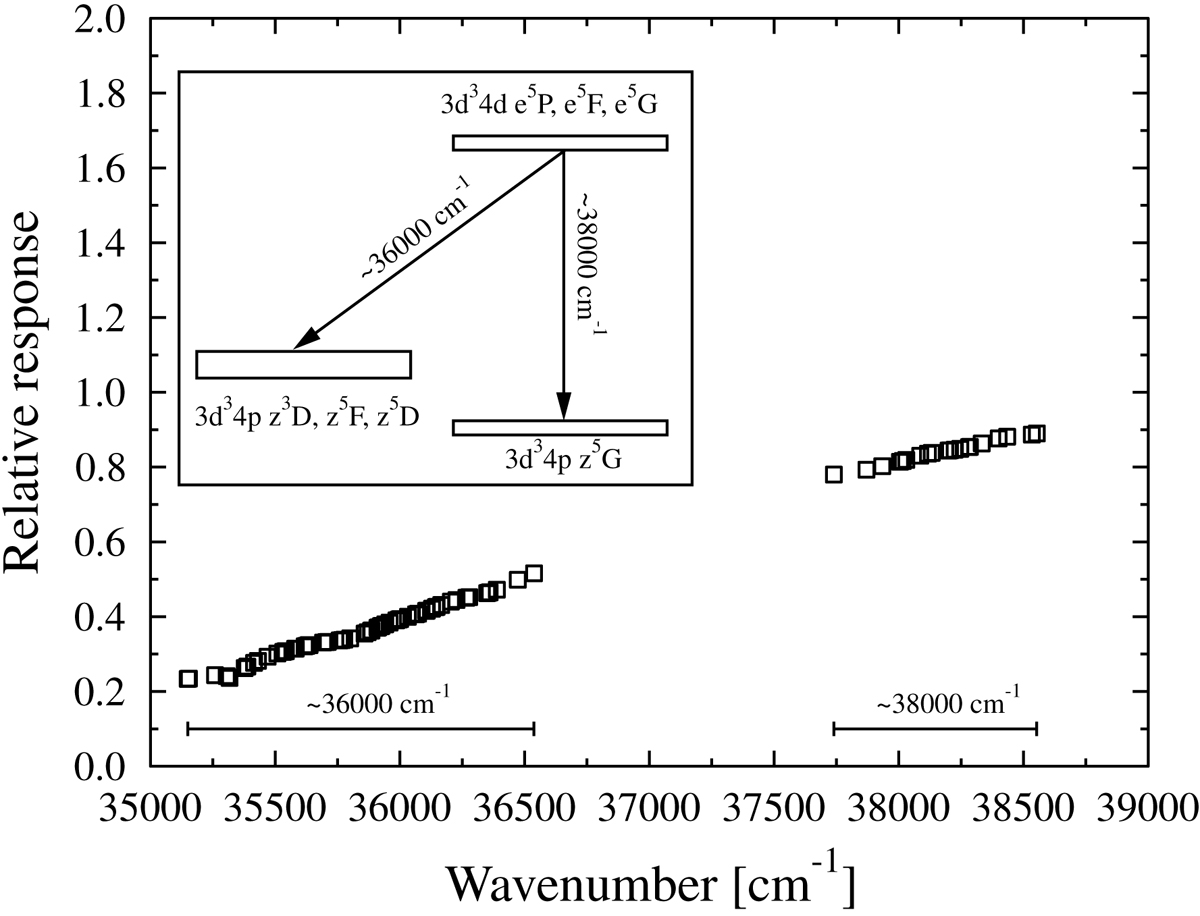
Relative response of the Fourier transform spectrometer and detector. The insert shows the origin of the gap in energy between the two line groups due to the lower energy of 4p z5G.
Current usage metrics show cumulative count of Article Views (full-text article views including HTML views, PDF and ePub downloads, according to the available data) and Abstracts Views on Vision4Press platform.
Data correspond to usage on the plateform after 2015. The current usage metrics is available 48-96 hours after online publication and is updated daily on week days.
Initial download of the metrics may take a while.