| Issue |
A&A
Volume 622, February 2019
|
|
|---|---|---|
| Article Number | A86 | |
| Number of page(s) | 11 | |
| Section | Galactic structure, stellar clusters and populations | |
| DOI | https://doi.org/10.1051/0004-6361/201834087 | |
| Published online | 31 January 2019 | |
Mergers, tidal interactions, and mass exchange in a population of disc globular clusters
II. Long-term evolution
1
Max-Planck-Institut für Astronomie, Königsthul 17, 69117 Heidelberg, Germany
e-mail: This email address is being protected from spambots. You need JavaScript enabled to view it.
2
GEPI, Observatoire de Paris, PSL Research University, CNRS, Place Jules Janssen, 92195 Meudon Cedex, France
3
Max-Planck-Institut für Extraterrestrische Physik, Gießenbachstrasse 1, 85748 Garching, Germany
Received:
14
August
2018
Accepted:
16
November
2018
Abstract
Globular clusters (GCs), the oldest stellar systems observed in the Milky Way, have long been considered single stellar populations. As such, they provided an ideal laboratory to understand stellar dynamics and primordial star formation processes. However, during the last two decades, observations have unveiled their true, complex nature. Beside their pristine stars, GCs host one or more helium enriched and possibly younger stellar populations whose formation mechanism is still unknown. Even more puzzling is the existence of GCs showing star-by-star iron spreads. Using detailed N-body simulations we explore the hypothesis that these anomalies in metallicity could be the result of mutual stripping and mergers between a primordial population of disc GCs. In the first paper of this series we proved, both with analytical arguments and short-term N-body simulations, that disc GCs have larger fly-by and close-encounter rates with respect to halo clusters. These interactions lead to mass exchange and even mergers that form new GCs, possibly showing metallicity spreads. Here, by means of long-term direct N-body simulations, we provide predictions on the dynamical properties of GCs that have undergone these processes. The comparison of our predictions with currently available and future observational data could provide insights into the origin of GCs and the Milky Way build-up history as a whole.
Key words: Galaxy: disk / Galaxy: evolution / Galaxy: formation / Galaxy: kinematics and dynamics / globular clusters: general
© ESO 2019
1. Introduction
Globular clusters (GCs) have long been described as simple, monolithic objects, composed of stars born at the same time with the same chemical composition. This picture changed when high resolution spectroscopic and photometric data unveiled the presence of multiple stellar populations in almost every observed GC (see e.g. Gratton et al. 2004, 2012; Carretta et al. 2007, 2009, 2010b; Kayser et al. 2008; Pancino et al. 2010; Milone et al. 2010, 2012, 2013; Carretta 2015). The presence of multiple populations with abundance variations in light elements from star to star appears to be ubiquitous in Galactic and extragalactic GCs (Gratton et al. 2012). However, a small fraction of massive Galactic GCs are even more peculiar, showing a significant spread in iron content (see Table 10 in Marino et al. 2015, for a partial summary). The first GC where this spread was observed is ω Cen (Norris & Da Costa 1995), a cluster strongly suspected to be the remnant nucleus of a disrupted dwarf galaxy (Freeman 1993; Dinescu et al. 1999; Hughes & Wallerstein 2000; Bekki & Freeman 2003; Böker 2008). While the iron spread found in some clusters (M 22, Hesser et al. 1977; Marino et al. 2009, 2011, 2012, 2013; Lee 2015) is still controversial (Mucciarelli et al. 2015; Lee 2016), the latest works confirm previous findings and the number of clusters where this peculiarity is detected is increasing with time (Marino et al. 2018). Recent analyses have added M 22 (Hesser et al. 1977; Marino et al. 2009, 2011, 2012, 2013; Lee 2015), M 2 (Piotto et al. 2012; Lardo et al. 2013; Milone et al. 2015), M 54 (Sarajedini & Layden 1995; Bellazzini et al. 2008; Carretta et al. 2010a), NGC 1851 (Milone et al. 2009; Carretta et al. 2010c, 2011; Yong & Grundahl 2008), NGC 5286 (Nataf et al. 2013; Marino et al. 2015), NGC 5824 (Saviane et al. 2012; Da Costa et al. 2014), Terzan 5 (Ferraro et al. 2009; Massari et al. 2014), M 19 (Johnson et al. 2015) and NGC 6934 (Marino et al. 2018) to the list of clusters with iron spreads. Such clusters have the typical multiple sequences in their colour-magnitude diagrams and anomalies in light-element abundances, as well as star by star spreads in iron content larger than 0.1 dex. The origin of multiple populations is still unknown, and could be the result of a secondary star formation event originating from gas lost by an initial population of fast rotating massive stars (Decressin et al. 2007), AGB stars (D’Antona & Caloi 2004; Ventura et al. 2001), or massive binaries (de Mink et al. 2009). This process is however unable to produce iron spreads, adding another complication to the GC formation scenario. Bekki & Tsujimoto (2016) and Gavagnin et al. (2016) proposed that clusters born at slightly different times (∼300 Myr) could merge forming GCs with the observed metallicity spreads.
According to the authors, these mergers can only take place in the halo or nucleus of dwarf galaxies, because of the shallower gravitational potential that characterises these environments. The dwarf galaxies, along with their pristine or merged GCs, are later accreted by the Milky Way. A similar process has been suggested by van den Bergh (1996) to explain Galactic GCs with composite colour-magnitude diagrams, and explored in detail with N-body simulations by Amaro-Seoane et al. (2013) to understand the multimetallic clusters in the Antennae galaxies. More recently, Hong et al. (2017) numerically investigated the possible merger origin of light-element anomalies in intermediate-age clusters in the Magellanic Clouds. Mergers between young clusters, born in a bound binary configuration have been studied in several N-body works with particular focus on the kinematics of the cluster resulting from the process (see e.g. Makino et al. 1991; de Oliveira et al. 1998; Portegies Zwart & Rusli 2007; Priyatikanto et al. 2016; Arnold et al. 2017). The age difference found between the metal poor and metal rich populations in Terzan 5 and its chemical similarity with the Galactic bulge populations (12 Gyr and 4.5 Gyr; Ferraro et al. 2016) however, suggest an in-situ formation for this cluster. In Khoperskov et al. (2018, K18 hereafter), we analytically estimated that the rate of physical encounters between thick-disc GCs in the Galaxy is up to 1.8 Gyr−1. This rate is mostly determined by the number density and relative velocities of the clusters.
The encounters might result in full mergers or partial contaminations between two or more clusters. The short-term evolution of a full initial population of disc GCs, followed by means of N-body simulations run with a Tree-code (Khoperskov et al. 2014), shows that while many clusters are destroyed in the field, loosing their stars in the disc, part of them survive and can interact with each other. In particular, when simulating a population of 128 disc GCs each of 107 M⊙, we observed two major mergers and several stripping events that produced clusters with up to 50% contamination from a second progenitor. After 1.5 Gyr of evolution, the polluted and merged clusters are fully mixed and their populations have spatial densities and total masses comparable to those of the current massive GCs in the Milky Way (see K18). For the first time, in K18, we suggested a hypothesis whereby the observed iron spreads could be the result of mergers and mass exchange happening in the primordial Galactic disc. Here we follow up these results, studying the long-term evolution of the interacting clusters using direct N-body simulations. While in K18 we explored only the first 1.5 Gyr of evolution of a full population of resolved clusters, here we follow the long-term evolution of pairs of GCs modelled as self-consistent N-body systems, initialising the simulation at the moment of the closest encounter and aiming at studying in detail the final (≈12 Gyr) dynamical and structural properties of the result of the merger (or mass exchange). The paper is organised as follows. In Sect. 2 we describe the models, the initial conditions and set-up of our simulations, whose results are illustrated in Sect. 3 and discussed in Sect. 4. In Sect. 5 we draw our conclusions.
2. Models and initial conditions
2.1. Galactic potential and globular cluster models
Our Galactic model is the same as that used in K18 and consists of a dark-matter halo and both a thin and a thick disc. The functional forms of these components are taken from Allen & Santillan (1991) while the relative parameters are given by Pouliasis et al. (2017, Model II). This model reproduces a number of observables, including the stellar density at the solar vicinity, thin and thick disc-scale lengths and heights, rotation curve, and the absolute value of the perpendicular force as a function of distance to the Galactic centre. We consider the bulge as part of the Galactic disc (see Di Matteo 2016, and references therein) and therefore we do not include any classical spheroid in our model. The mass of the modelled halo is 2.07 × 10¹¹ M⊙ and its scale length is 14 kpc. The thick disc has a mass of 3.91 × 10¹⁰ M⊙ and radial and vertical scale lengths of 2 kpc and 800 pc, while the mass of the thin disc is 3.68 × 10¹⁰ M⊙ and its scale radius is 4.8 kpc and the scale height is 250 pc.
We ran our simulations using two different King (1966) models for our GCs: i) a “standard” GC whose parameters are typical of current GCs (Harris 1996), that is, core radius rc = 1 pc and tidal radius is rt = 35 pc, corresponding to an adimensional parameter W0 = 7 and ii) a more extended cluster with lower central density, rc = 4 pc, rt = 80 pc and W0 = 6 with parameters similar to the most massive Galactic GC, ω Cen (Meylan 1987). The second model corresponds to the one used in K18.
We considered relatively small initial masses of 106 M⊙ (we identify as CS1 the standard model and as CS2 the more extended cluster), 3 × 10⁶ M⊙ (CS3 standard model), and 107 M⊙ (C1 is for the standard model and C2 is for the more extended cluster; see Table 1 for details and IDs used in the text). We used single-mass particles and adopted N = 25 584 for CS1, CS2, and CS3 and N = 51 151 for C1 and C2 (we used N = 85 279 for C2 in the interaction with CS3, to have same particle mass in both clusters).
Initial parameters and IDs of the adopted GC models.
2.2. N-body simulations set-up
While K18 simulated the short-term (1.5 Gyr) evolution of a full population of resolved disc GCs, here we focus on GC pairs that merge and follow the resulting composite system for 12 Gyr. To find the potential mergers, we simulated 100 disc clusters – represented as point mass particles orbiting the Galactic disc – and recorded the closest passages characterised by the lowest relative velocities1. There are currently approximately 50 observed disc GCs and therefore we assume that those are the remnants of an initially larger population (see Kruijssen 2015; Renaud et al. 2017). We distributed the clusters on disc orbits using the iterative method developed by Rodionov et al. (2009), which is able to construct equilibrium phase models of stellar systems in a fixed mass distribution. We ran one simulation with 100 clusters of 106 M⊙ each, and another one using the same number of clusters of 107 M⊙ each. In both cases the scale height and scale length of the disc GC systems we simulated are 1 and 2 kpc, respectively. By following the evolution of the positions and velocities of the point mass GCs with time, we selected pairs of clusters that encounter each other with mutual distances smaller than 50 pc and relative velocities smaller than a few hundred km s−1 2. Among those close approaches we identified the ones with the smallest impact parameters and the lowest relative velocities, focussing on ten pairs of 106 M⊙ clusters and approximately ten pairs of 107 M⊙ clusters. The positions and velocities of the two interacting point mass clusters, taken less than 1 Myr before the closest encounter, have been adopted to set the initial conditions for the centre of mass of different combinations of our N-body models (see Tables 1 and 2). In order to keep the orbits of the selected clusters unchanged, we retained the remaining 98 clusters in the original distribution, representing them as analytic Plummer (1911) spheres with scale length equal to 20 pc. This choice is necessary to soften the encounters between massive particles.
Orbital initial conditions for the clusters involved in each simulated interaction.
We ran our simulations by means of NBSymple (Capuzzo-Dolcetta et al. 2011), a direct and symplectic N-body code. NBSymple is an efficient hybrid code that runs on machines equipped with graphic processing units (GPUs). Several versions of the code – single, double, emulated double precision, and second-, fourth-, or sixth-order time integration symplectic methods – have been used to explore different issues concerning the evolution of GCs in the Galactic potential (see e.g. Mastrobuono-Battisti et al. 2012; Sollima et al. 2012; Leigh et al. 2014; Perets et al. 2018). In this work, for computational reasons, we used the emulated double precision version to evaluate the acceleration on the GPUs and a second-order symplectic method (leapfrog) for the time integration.
We used a softening length ε of 0.1 pc to smoothen impacts between the stellar particles in the clusters. The time step is chosen such that Δt = ε3/(GM), where M is the total mass of a single cluster. Our choices, including the number of particles used to represent the clusters, are due to computational limitations, as we aimed for simulations of 12 Gyr in length. The relative energy variation over 12 Gyr is ΔE/E0 ≤ 10−4, where E0 is the initial energy of the system.
3. Results
3.1. Mergers between initially massive clusters
In K18, we investigated the statistics of the encounters, finding that a population of 100 massive disc GCs undergoes 1.8 physical collisions per gigayear, as well as several cases of mass exchange, during close passages. Here we follow-up these results, focusing on single merger or mass exchange cases aiming at a detailed study of the long-lasting dynamical imprints of these interactions. Among the several simulated close encounters between different combinations of N-body models (C1, C2, CS1, CS2, CS3, see Table 1) moving on different orbits, three such encounters involving clusters of 107 M⊙ in mass lead to mergers resulting in a new GC. One of the merging pairs was initially composed of two C1 clusters, another of two C2 clusters, and another of one C1 and one C2 model (composite cluster; see Sect. 2.2). We refer to these three resulting clusters as CM1, CM2 and CM12, respectively too big. The orbital initial conditions for the different simulated pairs and the IDs of the resulting clusters are listed in Table 2. The structural and orbital parameters for the final clusters are summarised in Table 3. In all cases, the merger takes place almost immediately after the beginning of the simulation and takes less than 100 Myr; see Sect. 2.2. The relative distance between the centre of density of the two progenitors rapidly decreases from the initial value of ∼50 pc to < 1 pc (see left panel of Fig. 1). At the same time, the relative velocity decreases from ∼100 km s−1 to ∼2 km s−1 (see right panel of Fig. 1). In the first phase of the process, the two clusters start interacting and developing a tidal bridge (see top panels of Fig. 2). After few close passages and within 1 Gyr from the first close encounter the two clusters have completely merged to form a mixed system, which then evolves like a new, independent GC. While the central density of the final cluster increases with time, its outskirts become less bound and outer stars are lost by the cluster leading to a smaller tidal radius. This is quantitatively seen in Fig. 2, where the evolution of the two C2 clusters that merge to form CM2 is shown from the moment of the closest approach up to 12 Gyr of evolution. Figure 3 shows the final-density contour plots for the whole system (left panel) and the stars initially belonging to each of the progenitors (middle and right panels). While in the case of CM2 (top panels; CM1 is analogous to this case) the two progenitors provide the final cluster with a similar amount of mass and are almost completely spatially mixed after 12 Gyr, in the case of CM12 (lower panels) the stars inherited from C2 account for a significantly smaller mass and are less concentrated than the ones coming from C1 (see Table 3). This final configuration reflects the initial profiles of the progenitors and leads to potentially observable spatial differences between the two populations. The same close encounters described above (see Table 2 for the details on the orbital parameters) have been simulated replacing C1 with CS1 and C2 with CS2. However, these “less massive” encounters did not lead to any merger or mass exchange. Since the orbital conditions are the same as the ones adopted for the more massive clusters, we speculate that the main factor driving the mergers is the gravitational focusing exerted by the GCs, which has to be strong enough to overcome the action of the Galactic tidal field. Nevertheless, since the parameter space to explore is extremely large, more studies are necessary to find out if and in which conditions less massive clusters can interact in the Galactic disc.
Structural and orbital parameters of the clusters resulting from the mergers at the end of the simulation (12 Gyr).
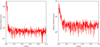 |
Fig. 1. First gigayear of evolution of the relative distance (left panel) and velocity (right panel) between the two C2 clusters that merge and form CM2. After two bounces, the clusters merge very quickly and become a single GC in less than 0.5 Gyr. |
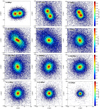 |
Fig. 2. Isodensity contour maps of two C2 GCs that merge and form the CM2 cluster. The projection of the system on the xy plane is shown at different times. The merger is complete after less than 0.5 Gyr. The composite CM2 cluster becomes less massive and more compact with time. The system is plotted with respect to its centre of density. |
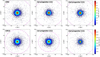 |
Fig. 3. Final-density maps for CM2 and CM12 and for the stellar component that comes from each progenitor (C2+C2 or C1+C2) are shown in the upper and lower panels, respectively. Left panels: entire cluster, central panels: stars coming from the first progenitor and right panels: those coming from the second progenitor that merge to form the new cluster. The black solid line and the purple dashed lines represent the half mass and tidal radius of each system, respectively. While for CM2 the two sub-clusters have similar densities and spatial distributions, for CM12 the C1 component is more dense and extended than the one inherited from C2. |
3.2. Mass loss and density profile evolution over a Hubble time
We calculated the GC mass as the amount of bound (i.e. with total energy E < 0) particles that are within twice the initial tidal radius of the cluster (see Table 1). Figure 4 shows the mass (left panel) and the fraction of mass lost (right panel) by all the simulated systems as a function of time. CM1, the first merger event we encountered, which happens between two dense standard C1 clusters, leads to a final cluster of mass 9.4 × 10⁶ M⊙. Each of the progenitors contributes 50% of this mass. The cluster is relatively massive because of the high initial density of its progenitors. CM1 moves on an orbit with apocenter 3.9 kpc and pericenter 0.68 kpc, which correspond to an eccentricity of e = 0.7. In the case of CM2, which results from the merger of two less-dense and more-extended C2 clusters with respect to the C1 model, the mass immediately after the merger is 12% smaller than the total initial mass of the progenitors. The violent interaction causes an expansion of the interacting systems with a consequent increase of the mass-loss rate to a level that is not observed for an isolated cluster moving on the same orbit (green dashed line in Fig. 4). After this violent initial phase that lasts for about 100 Myr, the cluster virialises and becomes stable. However, the mass-loss rate remains significant due to the low density of the cluster and on its orbital high eccentricity (e = 0.9) and low pericentre (0.12 kpc, the apocentre is 1.84 kpc). In ∼3 Gyr the cluster loses half of its initial mass (see Fig. 4). Afterwards the mass loss rate slows down, in the following 9 Gyr of evolution the system loses more mass and reaches a final mass of 5.1 × 10⁶ M⊙ (≈2.5 × 10⁶ M⊙ in each population), comparable to the most massive clusters observed in the Milky Way (ω Cen, M 54, Terzan 5).
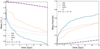 |
Fig. 4. Mass lost by the GCs during and after the merger. The orange dashed line is for CM1, the blue solid line is for CM2, and the purple dot-dashed line is for CM12. The green dotted line and the purple solid line with bullets are for the non-interacting C2-like clusters with 107 M⊙ and 2 × 10⁷ M⊙, respectively, moving on the orbit of CM2. The mass loss is large in the case of CM2, intermediate for CM1 and CM12, and low for the non-interacting clusters. |
A large fraction of the total mass of the cluster (more than 75%, i.e. 1.5 × 10⁷ M⊙) is lost in the disc, as shown in Fig. 5. However, since the stars are redistributed on a large volume, their density is low compared to that of the merger remnant. We notice that, as suggested in K18, if two 107 M⊙ clusters underwent a merger every gigayear, we would predict that up to 1.5 × 10⁸ M⊙ of the disc/bulge, accounting for over 1% of the total mass of the bulge, could come from disrupted GCs.
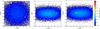 |
Fig. 5. Density maps of a 2 kpc × 2 kpc region after CM2 has evolved for 12 Gyr. The origin is at the Galactic centre. Projections on the xy (left panel), xz (middle panel), and yz (right panel) planes are shown. During and after the merger, the composite GC loses its stars along its orbit producing a low-density background that mixes with and contributes to the thick disc population. The GC is the denser, approximately round overdensity visible in each of the panels. |
The result of the collision and merger of a C1 and a C2 cluster (CM12) loses approximately the same amount of mass as lost by CM1, but at a different rate. Within ∼2 Gyr, CM12 loses ∼40% of its initial mass. The final mass of this cluster is 8.9 × 10⁶ M⊙, which comes mostly (8.0 × 10⁶ M⊙) from the initially more concentrated progenitor (C1). The population inherited from C2 accounts only for 10% of the total mass of CM12. This cluster moves on an orbit with an apocenter of 2.2 kpc and a pericenter of 0.17 kpc, corresponding to e = 0.6.
Figure 6 shows the evolution of the density of CM2; the case of CM1 is analogous to this one. The central density slightly increases with time as a consequence of the cluster contraction. The two populations composing the cluster are characterised by similar density profiles (see Fig. 7). The mixing is quick and already effective after 6 Gyr of evolution.
 |
Fig. 6. Density evolution with time for CM2. This cluster results from the merger of two C2 clusters. The two populations quickly mix and show the same density immediately after the first phases of the merger. The density is shown at the beginning of the simulation and after 2, 4, 6, 8, 10 and 12 Gyr. |
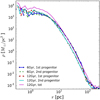 |
Fig. 7. Density of the two populations forming CM2 after 6 and 12 Gyr. The two populations are fully mixed and have the same density profile. The total density profile (solid purple line) is compatible with those of the massive Galactic GCs. |
In the case of the merger between two different clusters, a C1 and a C2, the result of the process is significantly different from what is illustrated above. As can be seen in Fig. 8, the two populations forming CM12 have significantly different masses and spatial distributions. The stars coming from C1, which was initially the densest cluster, are more centrally concentrated than the ones coming from C2, which contributes only to 10% of the mass of CM12. As a comparison, we simulated a non-interacting, non-rotating C2 cluster with a mass of 107 M⊙, and another one with the same initial mass of the merger products (2 × 10⁷ M⊙). These clusters move on the same orbit as CM2 and their centres of mass are in ( − 1.40, −0.14, 0.23) kpc, with velocity ( − 130, 43.9, 1.60) km s−1. The non-interacting C2 models, after 12 Gyr of evolution, have lost only between ∼10% and ∼20% of their initial mass. The violent interaction and the lower cluster density following a merger enhances the mass-loss rate by a factor of approximately 3.5 on the same orbit.
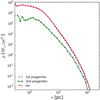 |
Fig. 8. Density of the two populations forming CM12 after 12 Gyr of evolution. The stars initially belonging to C1 (first progenitor, dashed blue line) are more concentrated than the stars inherited from C2 (second progenitor, green solid line with dots). The final cluster is dense and massive (red solid line). |
3.3. Mass exchange and mutual contamination
We simulated a different case with two “standard” clusters with masses of 3 × 10⁶ M⊙ (CS3) and 107 M⊙ (C1), respectively, at their closest encounter. This case did not lead to a full merger, but we observe a stripping operated by C1 at the expense of CS3. The captured mass accounts for a small fraction (< 1%) of the total mass of C1 and is redistributed in the outskirts of the accreting cluster. This is in agreement with what was found in K18. During the interaction, CS3 accretes a smaller fraction of stars that remain in the outskirt of the cluster.
We notice that although this is the only stripping case we simulated, many more are expected to happen between a full population of disc GCs. As shown by K18, mass exchanges are more frequent than full mergers and could be an important source of contamination in Galactic GCs.
3.4. Morphology, anisotropy, and rotation
In order to provide possible merger signatures we explored the morphology and kinematics of the clusters produced in our simulations. The left panel of Fig. 9 shows the minor axial ratio, c/a3, for CM2 calculated at different radii (rc, rh and 2rh) using the moment-of-inertia tensor (see Katz 1991) as a function of time. We are only showing this case because there are no relevant differences between the three simulated mergers. During the initial phases of the merger, the cluster is highly triaxial. At later evolutionary stages the cluster becomes oblate (see axial ratios reported in Table 3 and Fig. 9). At the core radius the cluster remains highly flattened through all its evolution. The flattening is ≈0.9 throughout all the evolution at the half-mass radius, while at twice this radius the cluster is initially flattened and becomes almost spherical in 2–4 Gyr. The stellar component belonging to the first progenitor is less centrally flattened than the one belonging to the second progenitor, and stars are in a more prolate configuration in the outskirts of the cluster (see right panel of Fig. 9). However, these differences are negligible and would be observationally challenging to detect. We note that the progenitors, evolved individually on the same orbit, without any encounter, and not including any initial internal rotation, would have remained approximately spherical. Therefore, the flattening observed for CM2 can be mostly attributed to the merger process. We therefore expect the clusters that went through mergers to show larger ellipticities than those that never experienced this kind of interaction.
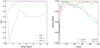 |
Fig. 9. Axial ratio c/a evolution with time for CM2 at different radii (left panel). The axial ratios for the two stellar components coming from the progenitors that form CM2 (right panel). |
The clusters involved in the stripping remain almost perfectly spherical even after 12 Gyr, and, as shown in Fig. 10, the stars captured by C1 have a negligible effect on its morphology.
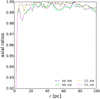 |
Fig. 10. Final axial ratios for the C1 including the particles stripped from CS3 (green solid and blue dashed lines) or excluding them (magenta solid and yellow dashed lines). |
After 12 Gyr of evolution there is no sign of significant rotation in either of the two populations forming CM1 and CM2. However, these systems are slightly tangentially anisotropic (β ∼ −0.14). This anisotropy is observed in only one of the two populations, while the other one is almost isotropic and shows only a minor radial anisotropy (β ∼ 0.01). These features are also found in the case of CM12, which results from the merger of clusters with different initial densities.
Figure 11 shows the velocity maps of CM12 and of its two populations, inherited from the progenitors C1 and C2, after 4.5 Gyr (upper panels) and 12 Gyr (lower panels) of evolution. Each system is projected perpendicularly to its maximum angular momentum vector. The maps are obtained by applying the Voronoi binning procedure described by Cappellari & Copin (2003) with a fixed signal-to-noise ratio (S/N) of 15 in each bin5. Due to the merger, both progenitors, which were initially non-rotating, gain different amounts of angular momentum. The rotation consequently acquired by CM12 is still clear after 4.5 Gyr and decreases with time, from a peak velocity larger than 4.5 km s−1 to a more irregular rotation pattern with a peak around 2 km s−1 (bottom right panel). While at 4.5 Gyr the population initially belonging to C2 rotates faster than the one initially belonging to C1, after 12 Gyr the situation is reversed. The model cluster C2, indeed, efficiently loses its angular momentum because of the strong mass loss affecting this stellar component. Additionally, part of the angular momentum gained during the merger with C2 is redistributed among C1 stars. The final rotation signal is observable only outside the half-mass radius, where the stars are less crowded, possibly allowing more detailed observations. This misalignment could be a distinctive signature of the merger, which, however, will need to be confirmed through the exploration of a larger parameter space for the mergers. CM12 velocity maps, produced projecting the cluster randomly with respect to the line of sight (LOS) are presented in Appendix A. The system has no significant velocity anisotropy. However, due to the large amount of mass being lost from the cluster, C2 stars show a slightly larger radial anisotropy than those of the C1 component.
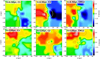 |
Fig. 11. Velocity maps of the two populations forming CM12 (i.e. the stars initially belonging to C1 and C2, identified within the merger product CM12) after 4.5 Gyr (left and middle panels) and 12 Gyr (top and bottom panels). The velocity map of the whole CM12 is shown after 4.5 Gyr (top right panel) and after 12 Gyr (bottom right panel). The cluster and each individual population coming from a different progenitor are seen edge on, i.e. perpendicular to the maximum angular momentum of the system. The white circle represents the half mass radius of each subsystem. |
4. Discussion
Globular clusters host several stellar populations showing chemical anomalies in their light elements (see Gratton et al. 2012, and references therein). As a further complication to this picture, a small fraction of Galactic GCs show metallicity spreads of the order of 0.1 dex (Marino et al. 2015). The origin of these clusters, which are among the most massive in the Galaxy, is still highly debated. While ω Cen and M54 are strongly suspected to be the former nuclei of dwarf galaxies that contributed to the assembly of the Galaxy (see e.g. Bellazzini et al. 2008; Bekki & Freeman 2003), mergers in dwarf galaxies later accreted by the Milky Way have been proposed as a possible explanation for the presence of iron spreads in the remaining clusters (Gavagnin et al. 2016).
In K18 we found that close passages between two or more clusters belonging to a primordial population of Galactic disc GCs could lead to 1.8 physical collisions per gigayear. These collisions can lead to mergers, fly-bys, and mass exchanges. This analytic result motivated the short-term N-body simulations run using 128 massive (107 M⊙) C2-like clusters, each modelled with 105 particles presented in K18. In these simulations, in 1.5 Gyr the GC system experienced two major mergers and several interactions with consequent mass contaminations between two or more clusters. K18 found that only clusters on similar orbits can merge or experience fly-bys. Here, we followed up these results, focusing on cluster pairs that, while orbiting a realistic Galactic potential, experience close passages. We modelled each simulated cluster using different King models with a range of masses. In the explored configurations only massive clusters (107 M⊙) can merge. As also found in K18, where we considered all clusters were modelled using the same density profiles and masses, if the two clusters have the same properties, the primordial populations are quickly spatially mixed and no long-lasting differential signature is left in the kinematics or morphology of the cluster. However, if the clusters have different initial densities, as in the case producing our CM12, the more compact progenitor retains most of its mass after the merger and produces a centrally concentrated population. The progenitor with a lower initial density contributes only 10% of the total mass of the final cluster and gives rise to the least dense population. The two populations rotate differentially and the new cluster shows a net rotation whose amount depends on the cluster evolutionary stage and on the parameters of the impact. In all analysed cases the outskirts of the cluster are slightly flattened, with the axial ratio reaching a minimum of c/a = 0.9, while the internal regions show larger ellipticities (see Fig. 9 and Table 3). As in K18, some of the encounters lead to small contaminations between different clusters. The material accreted during these mass exchanges only accounts for a small fraction (< 1%) of the total mass of each of the involved clusters. These kinds of events could have happened frequently in the disc and could have involved clusters of any mass (see K18). We therefore predict a wide range of contaminations, accounting for less than one percent up to half of the total mass of the clusters. We highlight the fact that we have only analysed a few cases and further work is necessary to investigate in detail the conditions under which a merger can happen. The phase space to explore is wide, however we have shown that mergers in the primordial disc of the Galaxy can be frequent and might generate clusters similar to the massive ones observed in the Milky Way (e.g. Terzan 5). We also predict a range of contaminated mass fractions in several high- and intermediate-mass cluster. There is no reported correlation between GCs showing disc kinematics and the presence of iron spreads, however part of the initial disc GC population could have been tidally destroyed or might have migrated to the Galactic halo because of disc heating caused by satellite accretions (Kruijssen 2015). Long-term signatures like flattening and, if the merging clusters have different structural parameters, differential rotation and spatial distributions for each population could be potentially observable and provide hints on the past violent life of interacting disc GCs.
5. Conclusions
In this paper we illustrate how massive primordial thick disc GCs can merge or have mass exchanges, a fact that could explain the metallicity spreads observed in a small but growing (Marino et al. 2018) fraction of the massive Galactic GCs. The main results achieved by studying the long-term evolution of interacting clusters can be summarised as follows:
-
When considering clusters with masses of 107 M⊙, we found three couples, one consisting of two C1 clusters, one formed by two C2 clusters and one including a C1 and a C2 cluster, that had a full merger leading to new clusters, namely CM1, CM2 and CM12. Another pair of clusters with masses 3 × 10⁶ M⊙ (CS3) and 107 M⊙ (C1) did not merge but rather stripped some material from each other, leading to a mutual contamination. This is the only case of stripping we simulated but many more are expected to happen (see K18).
-
The clusters merge quickly, showing tidal bridges and tails in the initial phase of the process, and become more centrally concentrated with time. After 12 Gyr of evolution they are similar to the massive Galactic GCs.
-
CM1 loses ∼50% of its initial mass, while CM2, which orbits closer to the Galactic centre on a more eccentric orbit, loses ∼75% of its initial mass, producing a final cluster of ∼5 × 10⁶ M⊙. CM12 inherits 90% of its mass from C1 and the rest from C2.
-
If the clusters are similar, their populations mix very quickly. If one of the clusters is denser, it will destroy the other one accreting part of its mass, and the two populations will have distinct density profiles that mirror the initial properties of the progenitors.
-
The mass lost by the clusters is distributed along their orbits and spreads all over the thick disc. Even if only a few clusters were to go through a merger, the mass lost by them should account for a non-negligible fraction of the disc mass (few percents) and should be observable with future astrometric/spectroscopic surveys.
-
Clusters that merge are significantly flattened up to the core mass radius. The cluster becomes almost spherical at the tidal radius.
-
Different populations show different degrees of velocity anisotropy. When two clusters with different initial density profiles merge, the final cluster rotates, and the two populations rotate differentially. The direction perpendicular to the rotation plane observed outside the half-mass radius is misaligned with respect to the direction of the total angular momentum of the system.
-
In the case of stripping, the more massive and denser cluster accretes a small fraction (< 1%) of its initial mass during the fly-by with a less massive and less dense cluster, which in turn accretes a smaller fraction of mass from its companion.
-
The accreted stars are distributed outside the core of the cluster. The accreting GC remains almost spherical throughout its lifetime.
We find that mergers between Galactic GCs are possible in the thick disc. This kind of event could explain the metallicity spread observed in a few Galactic GCs. Massive clusters can merge and consequently lose most of their mass, leading to a cluster which is similar to the massive GCs currently observed in the Milky Way. Following the results described here and K18 we can robustly conclude that mergers or mass exchanges could have happened in the past, possibly explaining in a straightforward way the origin of metallicity spreads in massive GCs.
The point-mass simulations were run by means of an NBSymple simplified, serial version.
Mergers require low-relative-velocity dispersions, however we find that sufficiently massive clusters can mutually affect the respective orbits, such that the gravitational focusing becomes stronger than the effect of the Galactic potential.
b/a is never significantly different from 1.
The anisotropy parameter is defined as 
We assume poissonian noise; the S/N is  , where N is the number of particles in the bin.
Acknowledgments
The authors thank Nadine Neumayer and the anonymous referee for their useful comments. AMB acknowledges support by Sonderforschungsbereich (SFB) 881 “The Milky Way System” of the German Research Foundation (DFG). This work has been supported by ANR (Agence Nationale de la Recherche) through the MOD4Gaia project (ANR-15-CE31-0007, P.I.: P. Di Matteo). This work was granted access to the HPC resources of CINES under the allocation 2017-040507 (PI : P. Di Matteo) made by GENCI.
References
- Allen, C., & Santillan, A. 1991, Rev. Mex. Astron. Astrofis., 22, 255 [NASA ADS] [Google Scholar]
- Amaro-Seoane, P., Konstantinidis, S., Brem, P., & Catelan, M. 2013, MNRAS, 435, 809 [NASA ADS] [CrossRef] [Google Scholar]
- Arnold, B., Goodwin, S. P., Griffiths, D. W., & Parker, R. J. 2017, MNRAS, 471, 2498 [NASA ADS] [CrossRef] [Google Scholar]
- Bekki, K., & Freeman, K. C. 2003, MNRAS, 346, L11 [NASA ADS] [CrossRef] [Google Scholar]
- Bekki, K., & Tsujimoto, T. 2016, ApJ, 831, 70 [NASA ADS] [CrossRef] [Google Scholar]
- Bellazzini, M., Ibata, R. A., Chapman, S. C., et al. 2008, AJ, 136, 1147 [NASA ADS] [CrossRef] [Google Scholar]
- Böker, T. 2008, ApJ, 672, L111 [NASA ADS] [CrossRef] [Google Scholar]
- Cappellari, M., & Copin, Y. 2003, MNRAS, 342, 345 [NASA ADS] [CrossRef] [Google Scholar]
- Capuzzo-Dolcetta, R., Mastrobuono-Battisti, A., & Maschietti, D. 2011, New Astron., 16, 284 [NASA ADS] [CrossRef] [Google Scholar]
- Carretta, E. 2015, ApJ, 810, 148 [NASA ADS] [CrossRef] [Google Scholar]
- Carretta, E., Bragaglia, A., Gratton, R. G., et al. 2007, A&A, 464, 967 [NASA ADS] [CrossRef] [EDP Sciences] [Google Scholar]
- Carretta, E., Bragaglia, A., Gratton, R., & Lucatello, S. 2009, A&A, 505, 139 [NASA ADS] [CrossRef] [EDP Sciences] [Google Scholar]
- Carretta, E., Bragaglia, A., Gratton, R. G., et al. 2010a, A&A, 520, A95 [NASA ADS] [CrossRef] [EDP Sciences] [Google Scholar]
- Carretta, E., Bragaglia, A., Gratton, R. G., et al. 2010b, A&A, 516, A55 [NASA ADS] [CrossRef] [EDP Sciences] [Google Scholar]
- Carretta, E., Gratton, R. G., Lucatello, S., et al. 2010c, ApJ, 722, L1 [NASA ADS] [CrossRef] [Google Scholar]
- Carretta, E., Lucatello, S., Gratton, R. G., Bragaglia, A., & D’Orazi, V. 2011, A&A, 533, A69 [NASA ADS] [CrossRef] [EDP Sciences] [Google Scholar]
- Da Costa, G. S., Held, E. V., & Saviane, I. 2014, MNRAS, 438, 3507 [NASA ADS] [CrossRef] [MathSciNet] [Google Scholar]
- D’Antona, F., & Caloi, V. 2004, ApJ, 611, 871 [NASA ADS] [CrossRef] [Google Scholar]
- de Mink, S. E., Pols, O. R., Langer, N., & Izzard, R. G. 2009, A&A, 507, L1 [NASA ADS] [CrossRef] [EDP Sciences] [Google Scholar]
- de Oliveira, M. R., Dottori, H., & Bica, E. 1998, MNRAS, 295, 921 [NASA ADS] [CrossRef] [Google Scholar]
- Decressin, T., Meynet, G., Charbonnel, C., Prantzos, N., & Ekström, S. 2007, A&A, 464, 1029 [NASA ADS] [CrossRef] [EDP Sciences] [Google Scholar]
- Di Matteo, P. 2016, PASA, 33, e027 [NASA ADS] [CrossRef] [Google Scholar]
- Dinescu, D. I., Girard, T. M., & van Altena, W. F. 1999, AJ, 117, 1792 [NASA ADS] [CrossRef] [Google Scholar]
- Ferraro, F. R., Dalessandro, E., Mucciarelli, A., et al. 2009, Nature, 462, 483 [NASA ADS] [CrossRef] [PubMed] [Google Scholar]
- Ferraro, F. R., Massari, D., Dalessandro, E., et al. 2016, ApJ, 828, 75 [NASA ADS] [CrossRef] [Google Scholar]
- Freeman, K. C. 1993, in The Globular Cluster-galaxy Connection, eds. G. H. Smith, & J. P. Brodie, ASP Conf. Ser., 48, 608 [NASA ADS] [Google Scholar]
- Gavagnin, E., Mapelli, M., & Lake, G. 2016, MNRAS, 461, 1276 [NASA ADS] [CrossRef] [Google Scholar]
- Gratton, R., Sneden, C., & Carretta, E. 2004, A&ARv, 42, 385 [CrossRef] [Google Scholar]
- Gratton, R. G., Carretta, E., & Bragaglia, A. 2012, A&ARv, 20, 50 [CrossRef] [Google Scholar]
- Harris, W. E. 1996, AJ, 112, 1487 [NASA ADS] [CrossRef] [Google Scholar]
- Hesser, J. E., Hartwick, F. D. A., & McClure, R. D. 1977, ApJS, 33, 471 [NASA ADS] [CrossRef] [Google Scholar]
- Hong, J., de Grijs, R., Askar, A., et al. 2017, MNRAS, 472, 67 [NASA ADS] [CrossRef] [Google Scholar]
- Hughes, J., & Wallerstein, G. 2000, AJ, 119, 1225 [NASA ADS] [CrossRef] [Google Scholar]
- Johnson, C. I., Rich, R. M., Pilachowski, C. A., et al. 2015, AJ, 150, 63 [NASA ADS] [CrossRef] [Google Scholar]
- Katz, N. 1991, ApJ, 368, 325 [NASA ADS] [CrossRef] [Google Scholar]
- Kayser, A., Hilker, M., Grebel, E. K., & Willemsen, P. G. 2008, A&A, 486, 437 [NASA ADS] [CrossRef] [EDP Sciences] [Google Scholar]
- Khoperskov, S. A., Vasiliev, E. O., Khoperskov, A. V., & Lubimov, V. N. 2014, J. Phys. Conf. Ser., 510, 1 [Google Scholar]
- Khoperskov, S., Mastrobuono-Battisti, A., Di Matteo, P., & Haywood, M. 2018, A&A, 620, A154 [NASA ADS] [CrossRef] [EDP Sciences] [Google Scholar]
- King, I. R. 1966, AJ, 71, 64 [Google Scholar]
- Kruijssen, J. M. D. 2015, MNRAS, 454, 1658 [NASA ADS] [CrossRef] [Google Scholar]
- Lardo, C., Pancino, E., Mucciarelli, A., et al. 2013, MNRAS, 433, 1941 [NASA ADS] [CrossRef] [Google Scholar]
- Lee, J.-W. 2015, ApJS, 219, 7 [NASA ADS] [CrossRef] [Google Scholar]
- Lee, J.-W. 2016, ApJS, 226, 16 [NASA ADS] [CrossRef] [Google Scholar]
- Leigh, N. W. C., Mastrobuono-Battisti, A., Perets, H. B., & Böker, T. 2014, MNRAS, 441, 919 [NASA ADS] [CrossRef] [Google Scholar]
- Makino, J., Akiyama, K., & Sugimoto, D. 1991, Ap&SS, 185, 63 [NASA ADS] [CrossRef] [Google Scholar]
- Marino, A. F., Milone, A. P., Piotto, G., et al. 2009, A&A, 505, 1099 [NASA ADS] [CrossRef] [EDP Sciences] [Google Scholar]
- Marino, A. F., Sneden, C., Kraft, R. P., et al. 2011, A&A, 532, A8 [NASA ADS] [CrossRef] [EDP Sciences] [Google Scholar]
- Marino, A. F., Milone, A. P., Sneden, C., et al. 2012, A&A, 541, A15 [NASA ADS] [CrossRef] [EDP Sciences] [Google Scholar]
- Marino, A. F., Milone, A. P., & Lind, K. 2013, ApJ, 768, 27 [NASA ADS] [CrossRef] [Google Scholar]
- Marino, A. F., Milone, A. P., Karakas, A. I., et al. 2015, MNRAS, 450, 815 [NASA ADS] [CrossRef] [Google Scholar]
- Marino, A. F., Yong, D., Milone, A. P., et al. 2018, ApJ, 859, 81 [NASA ADS] [CrossRef] [Google Scholar]
- Massari, D., Mucciarelli, A., Ferraro, F. R., et al. 2014, ApJ, 795, 22 [NASA ADS] [CrossRef] [Google Scholar]
- Mastrobuono-Battisti, A., Di Matteo, P., Montuori, M., & Haywood, M. 2012, A&A, 546, L7 [NASA ADS] [CrossRef] [EDP Sciences] [Google Scholar]
- Meylan, G. 1987, A&A, 184, 144 [NASA ADS] [Google Scholar]
- Milone, A. P., Stetson, P. B., Piotto, G., et al. 2009, A&A, 503, 755 [NASA ADS] [CrossRef] [EDP Sciences] [Google Scholar]
- Milone, A. P., Piotto, G., King, I. R., et al. 2010, ApJ, 709, 1183 [NASA ADS] [CrossRef] [Google Scholar]
- Milone, A. P., Marino, A. F., Piotto, G., et al. 2012, ApJ, 745, 27 [NASA ADS] [CrossRef] [Google Scholar]
- Milone, A. P., Marino, A. F., Piotto, G., et al. 2013, ApJ, 767, 120 [NASA ADS] [CrossRef] [Google Scholar]
- Milone, A. P., Marino, A. F., Piotto, G., et al. 2015, MNRAS, 447, 927 [NASA ADS] [CrossRef] [Google Scholar]
- Mucciarelli, A., Lapenna, E., Massari, D., et al. 2015, ApJ, 809, 128 [NASA ADS] [CrossRef] [Google Scholar]
- Nataf, D. M., Gould, A. P., Pinsonneault, M. H., & Udalski, A. 2013, ApJ, 766, 77 [NASA ADS] [CrossRef] [Google Scholar]
- Norris, J. E., & Da Costa, G. S. 1995, ApJ, 447, 680 [NASA ADS] [CrossRef] [Google Scholar]
- Pancino, E., Rejkuba, M., Zoccali, M., & Carrera, R. 2010, A&A, 524, A44 [NASA ADS] [CrossRef] [EDP Sciences] [Google Scholar]
- Perets, H. B., Mastrobuono-Battisti, A., Meiron, Y., & Gualandris, A. 2018, ArXiv e-prints [arXiv:1802.00012] [Google Scholar]
- Piotto, G., Milone, A. P., Anderson, J., et al. 2012, ApJ, 760, 39 [NASA ADS] [CrossRef] [Google Scholar]
- Plummer, H. C. 1911, MNRAS, 71, 460 [CrossRef] [Google Scholar]
- Portegies Zwart, S. F., & Rusli, S. P. 2007, MNRAS, 374, 931 [NASA ADS] [CrossRef] [Google Scholar]
- Pouliasis, E., Di Matteo, P., & Haywood, M. 2017, A&A, 598, A66 [NASA ADS] [CrossRef] [EDP Sciences] [Google Scholar]
- Priyatikanto, R., Kouwenhoven, M. B. N., Arifyanto, M. I., Wulandari, H. R. T., & Siregar, S. 2016, MNRAS, 457, 1339 [Google Scholar]
- Renaud, F., Agertz, O., & Gieles, M. 2017, MNRAS, 465, 3622 [NASA ADS] [CrossRef] [Google Scholar]
- Rodionov, S. A., Athanassoula, E., & Sotnikova, N. Y. 2009, MNRAS, 392, 904 [NASA ADS] [CrossRef] [Google Scholar]
- Sarajedini, A., & Layden, A. C. 1995, AJ, 109, 1086 [NASA ADS] [CrossRef] [Google Scholar]
- Saviane, I., da Costa, G. S., Held, E. V., et al. 2012, A&A, 540, A27 [NASA ADS] [CrossRef] [EDP Sciences] [Google Scholar]
- Sollima, A., Nipoti, C., Mastrobuono Battisti, A., Montuori, M., & Capuzzo-Dolcetta, R. 2012, ApJ, 744, 196 [NASA ADS] [CrossRef] [Google Scholar]
- van den Bergh, S. 1996, ApJ, 471, L31 [NASA ADS] [CrossRef] [Google Scholar]
- Ventura, P., D’Antona, F., Mazzitelli, I., & Gratton, R. 2001, ApJ, 550, L65 [NASA ADS] [CrossRef] [Google Scholar]
- Yong, D., & Grundahl, F. 2008, ApJ, 672, L29 [NASA ADS] [CrossRef] [Google Scholar]
Appendix A: Velocity maps
We present here the velocity maps of CM12 as seen from random LOS directions. In the three panels of Fig. A.1 the observation direction has been chosen randomly inclining the total angular moment of the cluster. We present three cases with projection angles (ϕ, θ) respectively equal to (101, 28) deg, (360, 101) deg, and (12.2, 5.9) deg. The observed signal depends on the LOS direction. However, if observed, the rotation is always misaligned with respect to the total angular momentum.
 |
Fig. A.1. Velocity maps of CM12, randomly oriented with respect to the LOS (see text for details). The observed rotation signal depends on the observation angle. |
All Tables
Orbital initial conditions for the clusters involved in each simulated interaction.
Structural and orbital parameters of the clusters resulting from the mergers at the end of the simulation (12 Gyr).
All Figures
|
Fig. 1. First gigayear of evolution of the relative distance (left panel) and velocity (right panel) between the two C2 clusters that merge and form CM2. After two bounces, the clusters merge very quickly and become a single GC in less than 0.5 Gyr. |
| In the text | |
|
Fig. 2. Isodensity contour maps of two C2 GCs that merge and form the CM2 cluster. The projection of the system on the xy plane is shown at different times. The merger is complete after less than 0.5 Gyr. The composite CM2 cluster becomes less massive and more compact with time. The system is plotted with respect to its centre of density. |
| In the text | |
|
Fig. 3. Final-density maps for CM2 and CM12 and for the stellar component that comes from each progenitor (C2+C2 or C1+C2) are shown in the upper and lower panels, respectively. Left panels: entire cluster, central panels: stars coming from the first progenitor and right panels: those coming from the second progenitor that merge to form the new cluster. The black solid line and the purple dashed lines represent the half mass and tidal radius of each system, respectively. While for CM2 the two sub-clusters have similar densities and spatial distributions, for CM12 the C1 component is more dense and extended than the one inherited from C2. |
| In the text | |
|
Fig. 4. Mass lost by the GCs during and after the merger. The orange dashed line is for CM1, the blue solid line is for CM2, and the purple dot-dashed line is for CM12. The green dotted line and the purple solid line with bullets are for the non-interacting C2-like clusters with 107 M⊙ and 2 × 10⁷ M⊙, respectively, moving on the orbit of CM2. The mass loss is large in the case of CM2, intermediate for CM1 and CM12, and low for the non-interacting clusters. |
| In the text | |
|
Fig. 5. Density maps of a 2 kpc × 2 kpc region after CM2 has evolved for 12 Gyr. The origin is at the Galactic centre. Projections on the xy (left panel), xz (middle panel), and yz (right panel) planes are shown. During and after the merger, the composite GC loses its stars along its orbit producing a low-density background that mixes with and contributes to the thick disc population. The GC is the denser, approximately round overdensity visible in each of the panels. |
| In the text | |
|
Fig. 6. Density evolution with time for CM2. This cluster results from the merger of two C2 clusters. The two populations quickly mix and show the same density immediately after the first phases of the merger. The density is shown at the beginning of the simulation and after 2, 4, 6, 8, 10 and 12 Gyr. |
| In the text | |
|
Fig. 7. Density of the two populations forming CM2 after 6 and 12 Gyr. The two populations are fully mixed and have the same density profile. The total density profile (solid purple line) is compatible with those of the massive Galactic GCs. |
| In the text | |
|
Fig. 8. Density of the two populations forming CM12 after 12 Gyr of evolution. The stars initially belonging to C1 (first progenitor, dashed blue line) are more concentrated than the stars inherited from C2 (second progenitor, green solid line with dots). The final cluster is dense and massive (red solid line). |
| In the text | |
|
Fig. 9. Axial ratio c/a evolution with time for CM2 at different radii (left panel). The axial ratios for the two stellar components coming from the progenitors that form CM2 (right panel). |
| In the text | |
|
Fig. 10. Final axial ratios for the C1 including the particles stripped from CS3 (green solid and blue dashed lines) or excluding them (magenta solid and yellow dashed lines). |
| In the text | |
|
Fig. 11. Velocity maps of the two populations forming CM12 (i.e. the stars initially belonging to C1 and C2, identified within the merger product CM12) after 4.5 Gyr (left and middle panels) and 12 Gyr (top and bottom panels). The velocity map of the whole CM12 is shown after 4.5 Gyr (top right panel) and after 12 Gyr (bottom right panel). The cluster and each individual population coming from a different progenitor are seen edge on, i.e. perpendicular to the maximum angular momentum of the system. The white circle represents the half mass radius of each subsystem. |
| In the text | |
|
Fig. A.1. Velocity maps of CM12, randomly oriented with respect to the LOS (see text for details). The observed rotation signal depends on the observation angle. |
| In the text | |
Current usage metrics show cumulative count of Article Views (full-text article views including HTML views, PDF and ePub downloads, according to the available data) and Abstracts Views on Vision4Press platform.
Data correspond to usage on the plateform after 2015. The current usage metrics is available 48-96 hours after online publication and is updated daily on week days.
Initial download of the metrics may take a while.