Fig. 2.
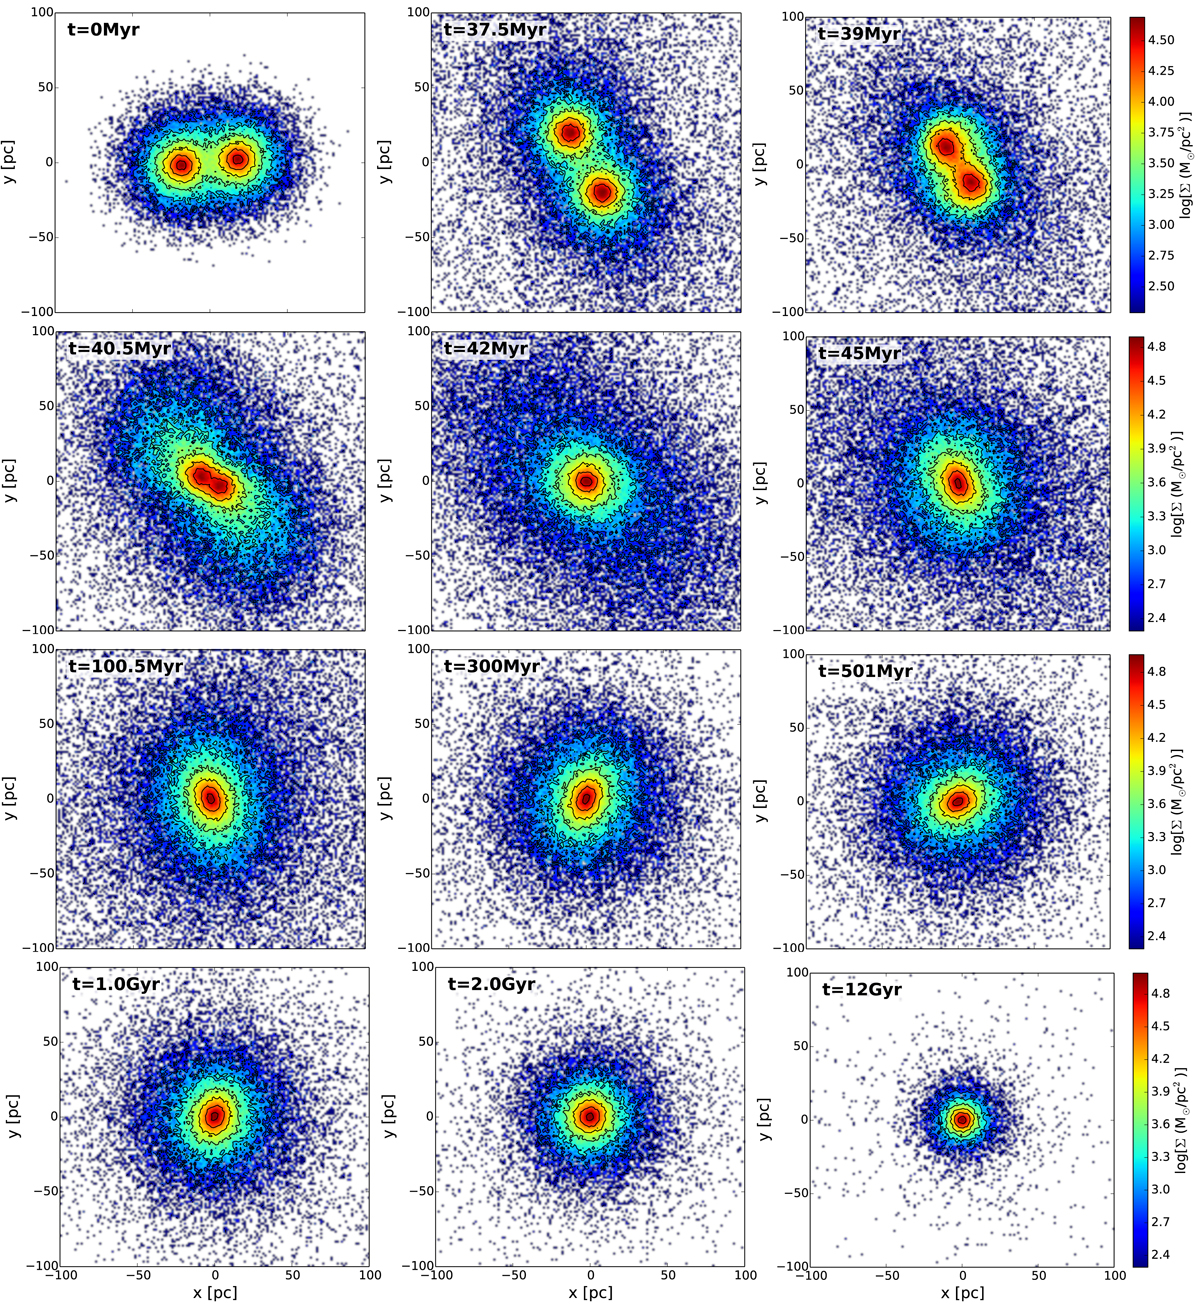
Isodensity contour maps of two C2 GCs that merge and form the CM2 cluster. The projection of the system on the xy plane is shown at different times. The merger is complete after less than 0.5 Gyr. The composite CM2 cluster becomes less massive and more compact with time. The system is plotted with respect to its centre of density.
Current usage metrics show cumulative count of Article Views (full-text article views including HTML views, PDF and ePub downloads, according to the available data) and Abstracts Views on Vision4Press platform.
Data correspond to usage on the plateform after 2015. The current usage metrics is available 48-96 hours after online publication and is updated daily on week days.
Initial download of the metrics may take a while.