Fig. 3.
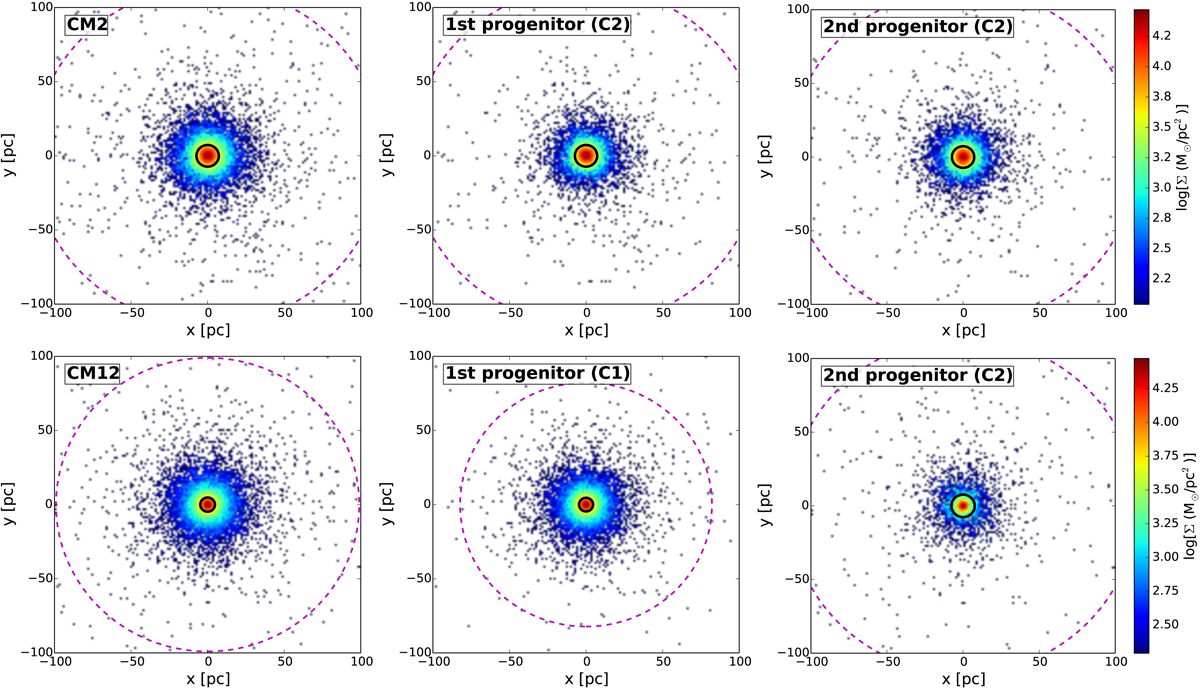
Final-density maps for CM2 and CM12 and for the stellar component that comes from each progenitor (C2+C2 or C1+C2) are shown in the upper and lower panels, respectively. Left panels: entire cluster, central panels: stars coming from the first progenitor and right panels: those coming from the second progenitor that merge to form the new cluster. The black solid line and the purple dashed lines represent the half mass and tidal radius of each system, respectively. While for CM2 the two sub-clusters have similar densities and spatial distributions, for CM12 the C1 component is more dense and extended than the one inherited from C2.
Current usage metrics show cumulative count of Article Views (full-text article views including HTML views, PDF and ePub downloads, according to the available data) and Abstracts Views on Vision4Press platform.
Data correspond to usage on the plateform after 2015. The current usage metrics is available 48-96 hours after online publication and is updated daily on week days.
Initial download of the metrics may take a while.