Fig. 11.
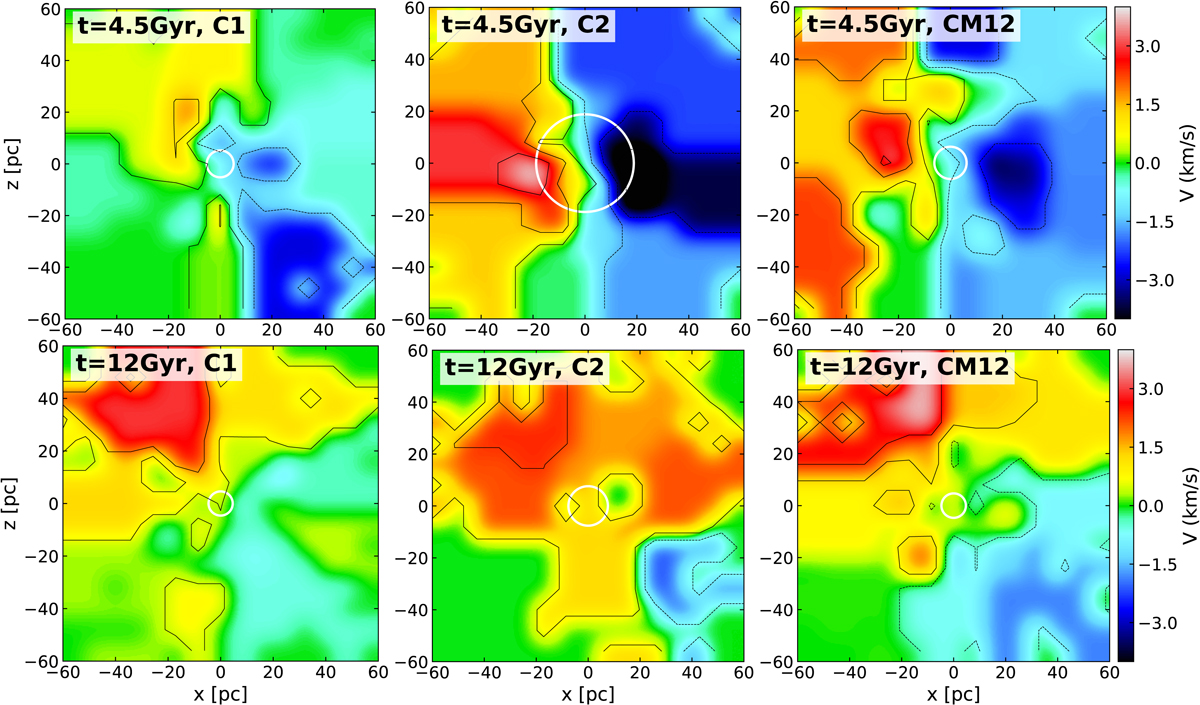
Velocity maps of the two populations forming CM12 (i.e. the stars initially belonging to C1 and C2, identified within the merger product CM12) after 4.5 Gyr (left and middle panels) and 12 Gyr (top and bottom panels). The velocity map of the whole CM12 is shown after 4.5 Gyr (top right panel) and after 12 Gyr (bottom right panel). The cluster and each individual population coming from a different progenitor are seen edge on, i.e. perpendicular to the maximum angular momentum of the system. The white circle represents the half mass radius of each subsystem.
Current usage metrics show cumulative count of Article Views (full-text article views including HTML views, PDF and ePub downloads, according to the available data) and Abstracts Views on Vision4Press platform.
Data correspond to usage on the plateform after 2015. The current usage metrics is available 48-96 hours after online publication and is updated daily on week days.
Initial download of the metrics may take a while.