| Issue |
A&A
Volume 621, January 2019
|
|
|---|---|---|
| Article Number | A137 | |
| Number of page(s) | 7 | |
| Section | Planets and planetary systems | |
| DOI | https://doi.org/10.1051/0004-6361/201834313 | |
| Published online | 18 January 2019 | |
Waiting to make an impact: a probable excess of near-Earth asteroids in 2018 LA-like orbits
1
Universidad Complutense de Madrid, Ciudad Universitaria,
28040
Madrid,
Spain
e-mail: This email address is being protected from spambots. You need JavaScript enabled to view it.
2
AEGORA Research Group, Facultad de Ciencias Matemáticas, Universidad Complutense de Madrid, Ciudad Universitaria,
28040
Madrid,
Spain
Received:
24
September
2018
Accepted:
28
November
2018
Abstract
Context. The discovery and tracking of 2018 LA marks only the third instance in history that the parent body of a fireball has been identified before its eventual disintegration in our atmosphere. The subsequent recovery of meteorites from 2018 LA was only the second time materials from outer space that reached the ground could be linked with certitude to a particular minor body. However, meteoroids like 2018 LA and its forerunners, 2008 TC3 and 2014 AA, are perhaps fragments of larger members of the near-Earth object (NEO) population. As the processes leading to the production of such fragments are unlikely to spawn just one meteoroid per event, it is important to identify putative siblings and plausible candidates from which the observed meteoroids might have originated.
Aims. Here, we study the pre-impact orbital evolution of 2018 LA to place this meteoroid within the dynamical context of other NEOs that follow similar trajectories.
Methods. Our statistical analyses are based on the results of direct N-body calculations that use the latest orbit determinations and include perturbations by the eight major planets, the Moon, the barycentre of the Pluto–Charon system, and the three largest asteroids. A state-of-the-art NEO orbit model was used to interpret our findings and a randomization test was applied to estimate their statistical significance.
Results. We find a statistically significant excess of NEOs in 2018 LA-like orbits; among these objects, we find one impactor, 2018 LA, and the fourth closest known passer-by, 2018 UA. A possible connection with the χ-Scorpiids meteor shower is also discussed. The largest known NEO with an orbit similar to that of 2018 LA is the potentially hazardous asteroid (454100) 2013 BO73 and we speculate that they both originate from a common precursor via a collisional cascade.
Conclusions. Future spectroscopic observations of 454100 and other NEOs in similar orbits may confirm or deny a possible physical relationship with 2018 LA.
Key words: methods: numerical / meteorites, meteors, meteoroids / minor planets, asteroids: general / minor planets, asteroids: individual: (454100) 2013 BO73 / minor planets, asteroids: individual: 2018 LA / minor planets, asteroids: individual: 2018 UA
© ESO 2019
1 Introduction
Planet-crossing asteroids may deliver meteorites to the inner planets when their paths intersect with those of the planets at the proper times, leading to an impact (see e.g. Morbidelli & Gladman 1998). On the Earth, meteorites collected after the observation of bright fireballs or bolides have sometimes been tentatively traced back to the near-Earth object (NEO) population or collisional events in the main asteroid belt (see e.g. Trigo-Rodríguez et al. 2007, 2015; Olech et al. 2015; Granvik & Brown 2018). However, only in two cases, those of 2008 TC3 (Jenniskens et al. 2009) and 2018 LA,1 the parent body of the meteor airburst that produced the recovered meteorites was observed prior to entering the atmosphere of our planet. In fact, just three natural objects have been discovered before colliding with the Earth: the two already mentioned and 2014 AA (de la Fuente Marcos et al. 2016; Farnocchia et al. 2016), but the impact of 2014 AA took place over the Atlantic Ocean, far from any land masses. All three were small Apollo asteroids that might well have been fragments of larger objects. In the event of having been fragments, identifying their parent bodies could be quite difficult as they tend to follow rather chaotic pre-impact orbits (see e.g. de la Fuente Marcos et al. 2016) and perhaps be the result of collisional cascades that produce multi-generation fragments, that is, fragments of fragments (see e.g. Farinella et al. 1994).
In principle, meteoroids like 2008 TC3, 2014 AA, or 2018 LA can be spawned by another small body from a larger object during subcatastrophic collisions (see e.g. Durda et al. 2007), but they can also be released as a result of the Yarkovsky–O’Keefe–Radzievskii–Paddack (YORP) mechanism (see e.g. Bottke et al. 2006) or out of tidal disruption events during very close encounters with planets (see e.g. Schunová et al. 2014). Here, we investigate the existence of a possible excess of NEOs in orbits similar to that of 2018 LA, parent body of the fireball observed over South Africa and Botswana on 2018 June 2. This paper is organized as follows. In Sect. 2, we present the data used and provide the details of our numerical model. Section 3 investigates the existence of putative siblings of 2018 LA and of plausible candidates from which meteoroids like 2018 LA might have originated. Observational evidence on periodic meteor activity perhaps linked to 2018 LA is presented in Sect. 4. In Sect. 5, we compare with predictions from a new four-dimensional model of the NEO population. Our results are discussed in Sect. 6 and our conclusions summarized in Sect. 7.
2 Meteoroid 2018 LA: data and tools
Asteroid 2018 LA was first observed on 2018 June 2 by Kowalski using the 1.5-m telescope of the Mount Lemmon Survey in Arizona(Kowalski et al. 2018) and it was soon determined2 that it was on a probable collision course with our planet. As a boulder-sized object, it was expected to disintegrate in the atmosphere, well above the surface of the Earth, producing a bright fireball. The fireball was indeed observed (Kowalski et al. 2018) and consistent infrasound signals were detected by the sensors of the Comprehensive Nuclear-Test-Ban Treaty Organization (CTBTO, Mialle 2018, priv. comm.).
The orbit determination of 2018 LA available from Jet Propulsion Laboratory’s (JPL) Small-Body Database (SBDB)3 has been updated several times since the discovery of the object and the latest solution (computed by D. Farnocchia on 2018 July 24) is based on 15 data points –14 optical observations and one fireball report. Table 1, second column from the right, shows the latest orbit determination released by JPL’s SBDB. A preliminary exploration of the pre-impact orbital evolution of 2018 LA using two previous orbit determinations (also published by JPL’s SBDB) can be found in de la Fuente Marcos & de la Fuente Marcos (2018a,b). In the following we only consider thelatest one, which is probably and currently the most accurate, publicly available orbit determination of 2018 LA.
In order to study the orbital evolution of 2018 LA and related objects, we have used a direct N-body code that implements a fourth-order version of the Hermite integration scheme (Makino 1991; Aarseth 2003). The standard version of this software is publicly available from the Institute of Astronomy of the University of Cambridge web site4. Practical details of this code, of solar system integrations, and of our overall approach and physical model are described in de la Fuente Marcos & de la Fuente Marcos (2012, 2018c). Uncertainties are included in our analysis by applying the covariance matrix methodology described in de la Fuente Marcos & de la Fuente Marcos (2015). The covariance matrices necessary to generate initial conditions have been obtained from JPL’s SBDB, which is also the source of other input data and ephemerides. Averages, standard deviations, interquartile ranges (IQRs), and other statistics have been calculated in the usual way (see e.g. Wall & Jenkins 2012).
3 Matching paths
Figure 1 shows the orbital evolution of the nominal orbit (second column from the right in Table 1) of 2018 LA (in red) prior to becoming a fireball. Although our current study is based on the latest public data, the dynamical behaviour of 2018 LA is quite sensitive to initial conditions and its past orbital evolution diverges quickly for the various solutions released by JPL’s SBDB (compare with Fig. 1 in de la Fuente Marcos & de la Fuente Marcos 2018a,b). However, when the uncertainties in the orbit determination are included in the calculations via the covariance matrix, the values of the orbital elements of 2018 LA remain well confined within a relatively narrow region of the NEO orbital parameter space (see dispersion ranges in Fig. 2 as red curves and average values as black ones).
As pointed out above, meteoroids like 2008 TC3, 2014 AA, or 2018 LA might have been fragments of larger members of the NEO population and none of the various processes that can lead to the production of such fragments are likely to spawn just one meteoroid per event. Therefore, when 2018 LA was released, other debris may have followed. If this happened during the relatively recent past, it may still be possible to identify putative siblings of 2018 LA and even plausible candidates from which the observed meteoroids may have originated (see e.g. Ye et al. 2018). Following the approach discussed in detail by de la Fuente Marcos & de la Fuente Marcos (2018c), we have used the D-criteria – which are metrics used to decide whether two orbits bear some resemblance – to search the known NEOs for objects that could be dynamically similar to 2018 LA. First, we have selected NEOs with DLS and DR < 0.05 (the lower the relative D value, the more similar the orbits are) and then studied their dynamical evolution using N-body integrations; DLS in the form of Eq. (1) in Lindblad (1994) and the DR in the form of Eq. (30) in Valsecchi et al. (1999). We must emphasize that having similar orbits in terms of the values of the osculating orbital elements is not enough to claim a dynamical connection, the orbital evolutions over a suitable time interval must be consistent as well.
We have found well over two dozen objects whose current orbits resemble that of 2018 LA in terms of size (a), shape (e), and orientation in space (i, Ω and ω), but the final sample does not depend on Ω and ω due to the mathematical forms of DLS and DR. Out of this sample, some of them follow orbital evolutions that compare well with that of 2018 LA. In Fig. 1, we highlight the cases of (454100) 2013 BO73, 2016 LR, 2018 BA5, 2018 GU11, and 2018 TU, which are amongst the objects with the least uncertain orbit determinations. Although the current orbit of 2016 LR (see nominal orbit in Table 1) has the lowest values of the D-criteria, its past evolution (in blue in Fig. 1) is less similar to that of 2018 LA than those of 454100 (in black) or 2018 BA5 (in green, see nominal orbit in Table 1). When considering the uncertainties in the orbit determinations (see Table 1), 2018 TU appears to be the closest dynamical relative of 2018 LA, if the evolution in Ω is not taken into account (see Fig. 2, with 2018 LA in black/red and 2018 TU in purple/lilac).
The case of the potentially hazardous asteroid (PHA) 454100 deserves special consideration (see nominal orbit in Table 1) because it has a size of 550 m (H = 20 mag, see Table 4 in Nugent et al. 2016) and a minimum orbit intersection distance (MOID) to the Earth of 0.0179 AU. Asteroids 2016 LR and 2018 BA5 are smaller than 454100, but larger than 2018 LA at H = 26.4 mag and 24.2 mag, respectively. Other small NEOs with orbits similar to that of 2018 LA are 2018 GU11 (in brown in Fig. 1, a = 1.350 ± 0.005 AU, e = 0.420 ± 0.003, i = 6. °35 ± 0. °04, Ω = 203. °0184 ± 0. °0011, ω = 77. °06 ± 0. °06, H = 28.4 mag, and a MOID with the Earth of 0.0039 AU), 2018 TU (in purple in Fig. 1, see nominal orbit in Table 1), and 2018 UA (a = 1.3898 ± 0.0009 AU, e = 0.4473 ± 0.0003, i = 2. °642 ± 0. °005, Ω = 205. °6842 ± 0. °0003, ω = 255. °21 ± 0. °03, H = 30.1 mag, and a MOID with the Earth of 0.000186 AU), all of them recent discoveries with rather uncertain orbit determinations (particularly 2018 UA, with a data-arc span of 6.78 h).
We have repeated the analysis shown in Fig. 2 for 2018 LA (black/red curves) in the case of several of the relevant minor bodies mentioned before and found that 454100 represents a promising match in the search for a candidate to be the parent body of 2018 LA as it is the largest of the sample. The grey and pink curves in Fig. 2 show the results of the simulations, and the orbits of 454100 and 2018 LA are fully consistent in terms of size and shape when 3σ deviations are taken into account. The orientation in space is somewhat different, but this opens the possibility of allowing truly close fly-bys between these two objects. We have performed 105 N-body experiments integrating the orbits of 454100 and 2018 LA backwards in time for 2000 yr and found that encounters at distances below 5000 km are possible; in fact, nearly 11.5% of the experiments produce an encounter at a mutual separation below one Lunar distance (384 402 km). These encounters take place at perihelion, at about 0.79 AU (median value) from the Sun and in the neighbourhood of Venus, during the time window 500–1500 yr ago, and at relative velocities close to 2.6 km s−1.
The relative velocity at minimum separation between two virtual NEOs following control orbits statistically compatible with those of 454100 and 2018 LA follows the distribution shown in Fig. 3, top panel. These values are comparatively low when considering collisions between members of the general NEO population (see e.g. Fig. 16 in de la Fuente Marcos& de la Fuente Marcos 2018c). All these properties might be compatible with a scenario in which 2018 LA may have been released after a relatively recent impact on 454100 but, how often might such an episode occur? Are there any recent observational data compatible with present-day shattering impacts? The answer is that such collisions are unusual, but definitely not uncommon; asteroid (596) Scheila 1906 UA experienced a sub-critical impact in 2010 December, the impact velocity was probably close to 5 km s−1 (see e.g. Bodewits et al. 2011; Ishiguro et al. 2011; Jewitt et al. 2011), which is the typical value across the main asteroid belt.
However, the relative orbital orientation has an effect on the velocity distribution of collisions between objects following 2018 LA-like orbits. Figure 3 shows the results of numerical experiments – similar to those of 454100 and 2018 LA – for relevant pairs of NEOs following 2018 LA-like orbits. Gentle approaches are possible as in the case of 2016 LR and 2018 LA (Fig. 3, middle panel), but high-speed fly-bys are also observed as in the case of 454100 and 2018 TU (Fig. 3, second to top panel). Encounters between 2016 LR and 2018 LA take place at perihelion and within the time window discussed for 454100 and 2018 LA. For 454100 and 2018 TU, nearly 5% of the experiments produce an encounter at a mutual separation below one Lunar distance, which resembles the behaviour observed in the case of 454100 and 2018 LA, but at much higher relative speed, 21.9 ± 0.3 km s−1. As for the dispersions in the orbital evolutions of these NEOs, Fig. 2 shows additional results that confirm that similar orbits and orbital evolutions, see the cases of 2018 LA and 2018 TU, can still produce high-speed encounters. At such high speeds, 21.5 ± 0.4 km s−1, catastrophicfragmentations are indeed possible.
Heliocentric Keplerian orbital elements of asteroids (454100) 2013 BO73, 2016 LR, 2018 BA5, 2018 LA, and 2018 TU.
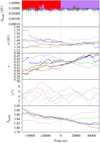 |
Fig. 1 Evolution of the distance from the Earth to relevant NEOs (top panel) – the value of the Hill radius of the Earth, 0.0098 AU, is plotted in orange – semi-major axis (second to top panel), eccentricity (middle panel), inclination (second to bottom panel), and Tisserand parameter with respect to the Earth (bottom panel) of the nominal orbits of (454100) 2013 BO73 (black), 2016 LR (blue), 2018 BA5 (green), 2018 GU11 (brown), 2018 TU (purple), and 2018 LA (red). The zero-point in time corresponds to epoch JD 2458200.5 TDB, 2018 March 23. |
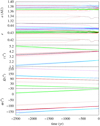 |
Fig. 2 Evolution backwards in time of the dispersions of the values of the orbital elements of (454100) 2013 BO73 (grey/pink), 2016 LR (blue/cyan), 2018 BA5 (green/lime), 2018 TU (purple/lilac), and 2018 LA (black/red): semi-major axis (top panel), eccentricity (second to top panel), inclination (middle panel), longitude of the ascending node (second to bottom panel), and argument of perihelion (bottom panel). Average values are displayed as thick curves and their ranges (1σ uncertainties) as thin curves. This figure shows results for 500 control orbits of each object; initial positions and velocities have been computed using the covariance matrix. The zero-point in time is as in Fig. 1. |
4 Related meteor activity?
If 2018 LA was a fragment – or a fragment of a fragment – of (454100) 2013 BO73, it is unlikelyto be alone: a sizeable stream of debris may occupy the same region of the orbital parameter space. If this hypothesis is correct, some evidence in the form of meteors coming from approximately the same sky position around the same time of the year should exist. The ephemerides show that the Botswana fireball of 2018 June 2 came approximately from (αo, δo) ~ (243.6°, −10.5°), which is in the constellation of Scorpius, and had a velocity of ~17 km s−1. We have searched the available literature on meteor activity (e.g. Jenniskens 2006) and found one meteor shower that might be related to 2018 LA: the χ-Scorpiids (Sekanina 1973). Activity for this meteor shower is observed from May 28 to June 5 with a periodicity of 2.7 yr and Sekanina (1973) gives a radiant of (243.4° ± 1.9°, −10.8° ± 1.0°), a geocentric velocity of 19.9 km s−1, and mean orbital elements referred to the equinox 1950.0 – a = 1.943 AU, q = 0.639 ± 0.013 AU, e = 0.671 ± 0.017, i = 6.8° ± 0.7°, Ω = 65.9° ± 2.7°, and ω = 265.4° ± 1.6°. Sekanina (1973) includes the χ-Scorpiids as a member of the Great Cluster of meteor showers, which he considers as the greatest concentration of possibly related meteoroid streams. Babadzhanov et al. (2013) gives a list of NEOs that may be associated with the χ-Scorpiids and parameters for the meteor shower similar to those in Sekanina (1973).
From the values in Table 1 and the observed radiant and velocity of the Botswana fireball, we can conclude that the χ-Scorpiids are a very good match in terms of timing (within the year), radiant and associated velocity, and orientation in space, but the shape of the theoretical orbit is significantly more elongated than those of 454100, 2018 LA, and related objects. Although the χ-Scorpiids seem to be a promising match, the fact that meteor activity has long been recorded from that area of the sky at the right time of the year lends support to the hypothesis that 2018 LA could be part of a stream of debris with a possible origin in perhaps 454100. The recent close fly-by by 2018 UA5 at just 0.04 Lunar distances on 2018 October 19 (fourth-closest pass by the Earth on record, other than impacts), a H = 30.1 mag meteoroid that now follows an orbit very similar to that of 454100 (i.e. it matches the criterion discussed above) suggests that the presence of dynamically coherent debris cannot be discarded in this case. Having discovered one impactor and one very close passer-by with similar osculating orbital elements within about four months of each other may be more than just a coincidence. Interestingly, the pre-encounter orbit of 2018 UA is given by JPL’s SBDB as a = 1.930 AU, e = 0.550, i = 6.4°, which is close to that of the χ-Scorpiids in Sekanina (1973).
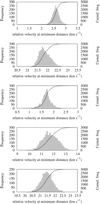 |
Fig. 3 Velocity distribution between two virtual NEOs following control orbits statistically compatible with those of (454100) 2013 BO73 and 2018 LA (top panel) – in the histogram, the bin width is 0.025 km s−1, with IQR = 0.194 km s−1 and a mean value of 2.6 ± 0.2 km s−1; 454100 and 2018 TU (second to top panel) – bin width is 0.053 km s−1, with IQR = 0.381 km s−1 and a mean value of 21.9 ± 0.3 km s−1; 2016 LR and 2018 LA (middle panel) – bin width is 0.029 km s−1, with IQR = 0.212 km s−1 and a mean value of 1.8 ± 1.9 km s−1; 2018 BA5 and 2018 LA (second to bottom panel) – bin width is 0.119 km s−1, with IQR = 0.859 km s−1 and a mean value of 11.8 ± 1.3 km s−1; 2018 LA and 2018 TU (bottom panel) – bin width is 0.071 km s−1, with IQR = 0.513 km s−1 and a mean value of 21.5 ± 0.4 km s−1. |
5 NEO model predictions
If 2018 LA is associated with periodic meteor activity, this must be accompanied by a larger-than-expected fraction of observed minor bodies following trajectories resembling those of 2018 LA or (454100) 2013 BO73. If the hypothetical ensemble of small bodies, which are the source of the observed meteor activity, are the result of a relatively recent fragmentation event of any kind, such a feature cannot be present in synthetic, debiased data from a NEO population model. By comparing observational and synthetic data we may be able to understand better the circumstances surrounding 2018 LA’s impact.
The NEO orbit model developed within the framework of the Near-Earth Object Population Observation Program (NEOPOP) and described by Granvik et al. (2018) is the state-of-the-art tool that can make such a comparison possible; this new four-dimensional model of the NEO population describes debiased steady-state distributions of a, e, i, and H in the range 17 < H < 25. When generating synthetic orbits from the NEO model, the two additional angular elements, Ω and ω, are drawn from flat distributions. It is, however, well known that the unbiased distributions in Ω and ω are not flat and also that selection effects significantly affect the distributions of these angular elements (see e.g. JeongAhn & Malhotra 2014). Granvik et al. (2018) have estimated that the error arising from the assumption of flat distributions is around 5% or less for the debiased NEO population. The software for generating a realization of the model is publicly available6 and the NEO model has already been used to complete several recent NEO studies that reproduce observed distributions of NEO properties (Granvik et al. 2016, 2017; Granvik & Brown 2018). In addition, its results are consistent with an independent analysis carried out by Tricarico (2017).
We have used the list of NEOs currently catalogued (as of 2018 November 11, 14 439 objects with H < 25 mag) and found nine objects following 454100-like orbits and 17 pursuing 2018 LA-like ones (applying the D criteria discussed above). The orbit model, for a sample of the same size (i.e. 14 439 objects), predicts 4.6 ± 1.9 and 5.1 ± 2.2, respectively, which represent excess deviations of 2.3σ and 5.4σ, respectively, of the numbers actually observed with respect to those predicted: averages and standard deviations from 50 subsamples (of 14 439 synthetic objects) of the orbit model. This suggests that an excess of small bodies following trajectories resembling those of 2018 LA or (454100) 2013 BO73 may exist and, if true, this is consistent with our hypothetical scenario in which 2018 LA and 454100 could be related and associated with periodic meteor activity. It is, however, possible that current observational data may be biased in favour of this type of orbit simply because they tend to pass closer to our planet (see the case of 2018 UA above) and this fact makes them easier to discover.
The NEOPOP software predicts the existence of over 800 000 NEOs with H < 25 mag, but the size of the observed sample of NEOs in the same range of absolute magnitudes is 14 439. Therefore, we can put the completeness level of the overall NEO sample in this magnitude range at ~1.8%. Following the same reasoning and for 454100-like orbits, the NEOPOP software predicts 237 NEOs but the number actually observed is nine; therefore, the completeness level in this case could be ~3.8%. For 2018 LA-like orbits, the NEOPOP software predicts 251 NEOs for an actual observational tally of 17, which gives a completeness level of ~6.8%. In both cases, the completeness level is higher than the total one so we can assume that NEOs following 454100-like or 2018 LA-like orbits are indeed easier to observe than the average NEO. However, objects in orbits similar to that of 2018 LA are nearly twiceas likely to be observed than those following 454100-like paths. These results have been obtained assuming that DLS and DR < 0.05, as we did inprevious sections, and show that extracting a subsample of 14 439 synthetic NEOs from the model does not provide an orbit distribution that can be meaningfully compared with the observed distribution of NEOs, because selection effects have not been accounted for. However, subsamples generated using the NEOPOP sofware are expected to be free from observational biases for the most part, though not fully for Ω and ω (see above).
Let us assume that the null hypothesis is that the sample of NEOs linked to a given one (DLS and DR < 0.05) can be detected from the NEO orbit model; in other words, the null hypothesis is that a similar cluster of orbits as found around 2018 LA and 454100 would be found amongst synthetic NEOs. Although the empirical sample is affected by various observational biases, we want to study how strongly the data can reject (or not) the null hypothesis. Following the ideas discussed by Fisher (1935), here we apply a randomization test for a monovariate two-sample problem. This non-parametric statistical test will tell us if the excesses found above are statistically significant. Our test statistics is the difference between the observed number of NEOs with orbits similar to the one given and the predicted number using synthetic data. As pointed out above, the empirical sample includes 14 439 NEOs with H < 25 mag and using the previously mentioned criterion for similarity we obtain that, empirically, nine NEOs follow 454100-like orbits and 17 follow 2018 LA-like orbits; the predictions using synthetic data are 4.6 ± 1.9 and 5.1 ± 2.2, respectively. Therefore, the respective differences (our test statistics) are 4.4 ± 1.9 and 11.9 ± 2.2. In order to implement the randomization test, we used one instance of the NEO orbit model (over 800 000 NEOs) and extracted two random samples, each one including 14 439 synthetic NEOs; then found for both samples how many synthetic NEOs had 454100-like orbits and how many had 2018 LA-like orbits, and computed the differences. We repeated this experiment 10 000 times to obtain the distribution of differences.
The results of these experiments are plotted in the form of histograms in Fig. 4 together with the observed average values of the test statistics (as vertical black lines). From the figure, the excess of 454100-like orbits (top panel) may not be out of the ordinary, but the one observed for 2018 LA-like orbits (middle panel) is significant as it is well separated from the bulk of the distribution. Our results show that the probability of getting a difference > 2.5 for 454100-like orbits is 0.3746 and that of getting a value >4.4 is 0.1150 (see Fig. 4, top panel). Therefore, for 454100-like orbits, the null hypothesis cannot be rejected at any meaningful level of significance. In sharp contrast and for 2018 LA-like orbits, the probability of getting a difference > 9.7 is 0.0017 and that of obtaining > 11.9 is 0.0003 (see Fig. 4, middle panel), which means that the null hypothesis can be safely rejected for these orbits. In summary, the answer to the original question – how likely is such a large number of NEOs moving in 2018 LA-like orbits if those orbits come from a distribution compatible with the one provided by the NEO orbit model? – is a robust “very unlikely”. As the 2018 LA-like orbits have assumedly evolved out of 454100-like ones within the context of our hypothesis, relatively stable orbits turn into those that may lead to an impact, passing regularly closer to our observation point on the Earth. If we focus on 2018 UA-like orbits (the close passer-by with very uncertain orbit) instead, we have an empirical tally of 13, a synthetic one of 3.3 ± 1.8, and a test statistics of 9.7 ± 1.8; a similar set of experiments shows that the probability of getting a difference >7.9 is 0.0027 and that of obtaining >9.7 is 0.0001 (see Fig. 4, bottom panel), which indicate that the excess of 2018 UA-like orbits is also statistically significant.
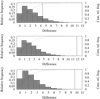 |
Fig. 4 Results of the randomization test described in the text. The observed average differences betwen empirical and synthetic counts are represented by vertical lines. Top panel: results for (454100) 2013 BO73 -like orbits. Middle panel: results for those of 2018 LA-like orbits. Bottom panel: results for those of 2018 UA-like orbits. |
6 Discussion
The study of possible dynamical and/or genetic relationships amongst members of the NEO population has implications in knowledge areas as diverse as the evolution of the NEO population, the study of the near-Earth space environment, in situ exploration and commercial applications of NEOs, and planetary defense (see e.g. Elvis 2012; Harris & Drube 2014; Mainzer 2017). Our extensive calculations indicate that within the NEO orbital parameter space both low-speed (relative velocity under 2 km s−1) and high-speed (above 20 km s−1) collisions are possible; that is, cratering and catastrophic impacts are both feasible amongst members of dynamically similar NEO groups. This could be considered as an additional piece of evidence in favour of fragmentation taking place in near-Earth space; a more robust example has been discussed by de la Fuente Marcos & de la Fuente Marcos (2019), but in that case fission via the YORP mechanism (see e.g. Jacobson & Scheeres 2011), not actual impacts, is thought to be the cause.
Our statistical tests confirm that the presence of (454100) 2013 BO73 is compatible with predictions from the NEO orbit model used here, but that of 2018 LA (and 2018 UA) is probably not. However, and with the available data, we cannot tell anything certain about the significance of the link between 454100 and 2018 LA, spectroscopic (i.e. compositional) information is needed in order to do this properly. After analysing the relative dynamics of relevant NEOs following these orbits, it cannot be discarded that most members of the group could be the result of collisional cascades that produce multi-generation fragments as envisioned by, for example, Farinella et al. (1994). The dynamical landscape is consistent with this scenario; fragments of fragments can easily be produced under those conditions.
As pointed out above, the orbit model used here has intrinsic limitations but a, e, and i define the Tisserand parameter (see e.g. Murray & Dermott 1999) that is approximately conserved during the close encounters of these objects with Venus and the Earth–Moon system as shown in Fig. 1, bottom panel. Even if the true distributions of Ω and ω have been disregarded in our analysis, the essence of the dynamical processes driving the orbital evolution of the relevant NEOs has been captured by our extensive simulations and statistical analyses, and their overall conclusions can be considered as sufficiently robust. It is also worth mentioning that the orbits of 2018 LA and related objects are very typical of Earth’s impactors as seen in Fig. 1 of Vereš et al. (2009), which strongly suggests that they must be preferentially removed (relative to other NEO orbits), yet they seem to be overabundant. Assuming that this is not the result of some hidden and strong observational bias or selection effect, a natural scenario that explains qualitatively what is observed is in the existence of collisional cascades still taking place within this dynamical group; objects like 2018 LA are lost, but new impacts (within the group) replenish the losses (being in the form of impacts or NEOs being scattered away from the dynamical neighbourhood of 2018 LA).
7 Conclusions
In this paper, we have studied the pre-impact orbital evolution of 2018 LA, the parent body of the fireball observed over South Africa and Botswana on 2018 June 2. The dynamical evolution of other, perhaps related, minor bodies has been explored as well. This research has been carried out using the latest data, N-body simulations, a state-of-the-art NEO orbit model, and statistical analyses. Our conclusions can be summarized as follows.
We have identified a group of known NEOs that follow orbits similar to that of 2018 LA and whose dynamical behaviour bears some resemblance to that of 2018 LA, prior to its impact. The largest member of this group is (454100) 2013 BO73.
Extensive calculations show that the pair 454100–2018 LA may have experienced fly-bys at very close range in the past. Based on this fact, we speculate that 2018 LA might have its origin in a relatively recent shattering event that perhaps affected 454100. This putative fragmentation episode may have produced additional debris that might still be identifiable in the available data.
Periodic meteor activity, χ-Scorpiids, that might be consistent with the properties of the radiant of 2018 LA has been found recorded in the literature.
-
We find a statistically significant excess of small bodies moving in orbits similar to that of 2018 LA when comparing with predictions from a state-of-the-art NEO orbit model. This excess can be tentatively explained as a result of collisional cascades operating within the dynamical group.
Future spectroscopic studies of 454100 (and other perhaps related NEOs) should be able to confirm if this PHA could be the source of 2018 LA and other NEOs (by finding, or not, a chemical composition consistent with that of the recovered meteorites of 2018 LA), and perhaps other extraterrestrial materials that have been observed historically as coming from the same general area of the sky in Scorpius.
Acknowledgements
The authors thank the referee, M. Granvik, for a constructive review that led to significant improvements in the interpretation of our results within the context of the NEO orbit model used here, S. J. Aarseth for providing one of the codes used in this research, P. Mialle for comments on CTBTO infrasound recordings from the meteor blast, S. Deen for comments on the overall organization of 2018 LA-like orbits, and A. I. Gómez de Castro for providing access to computing facilities. This work was partially supported by the Spanish “Ministerio de Economía y Competitividad” (MINECO) under grant ESP2015-68908-R. In preparation of this paper, we made use of the NASA Astrophysics Data System, the ASTRO-PH e-print server, and the MPC data server.
References
- Aarseth, S. J. 2003, Gravitational N-Body Simulations (Cambridge: Cambridge University Press), 27 [Google Scholar]
- Babadzhanov, P. B., Williams, I. P., & Kokhirova, G. I. 2013, A&A, 556, A25 [NASA ADS] [CrossRef] [EDP Sciences] [Google Scholar]
- Bodewits, D., Kelley, M. S., Li, J.-Y., et al. 2011, ApJ, 733, L3 [NASA ADS] [CrossRef] [Google Scholar]
- Bottke, W. F., Jr. Vokrouhlický, D., Rubincam, D. P., & Nesvorný, D. 2006, Annu. Rev. Earth Planet. Sci., 34, 157 [NASA ADS] [CrossRef] [EDP Sciences] [Google Scholar]
- de la Fuente Marcos, C., & de la Fuente Marcos, R. 2012, MNRAS, 427, 728 [NASA ADS] [CrossRef] [Google Scholar]
- de la Fuente Marcos, C., & de la Fuente Marcos, R. 2015, MNRAS, 453, 1288 [NASA ADS] [CrossRef] [Google Scholar]
- de la Fuente Marcos, C., & de la Fuente Marcos, R. 2018a, Res. Notes Am. Astron. Soc., 2, 57 [NASA ADS] [CrossRef] [Google Scholar]
- de la Fuente Marcos, C., & de la Fuente Marcos, R. 2018b, Res. Notes Am. Astron. Soc., 2, 131 [NASA ADS] [CrossRef] [Google Scholar]
- de la Fuente Marcos, C., & de la Fuente Marcos, R. 2018c, MNRAS, 473, 3434 [NASA ADS] [CrossRef] [Google Scholar]
- de la Fuente Marcos, C., & de la Fuente Marcos, R. 2019, MNRAS, 483, L37 [NASA ADS] [CrossRef] [Google Scholar]
- de la Fuente Marcos, C., de la Fuente Marcos, R., & Mialle, P. 2016, Ap&SS, 361, 358 [NASA ADS] [CrossRef] [Google Scholar]
- Durda, D. D., Bottke, W. F., Nesvorný, D., et al. 2007, Icarus, 186, 498 [NASA ADS] [CrossRef] [Google Scholar]
- Elvis, M. 2012, Nature, 485, 549 [NASA ADS] [CrossRef] [Google Scholar]
- Farinella, P., Froeschle, C., & Gonczi, R. 1994, Asteroids, Comets, Meteors 1993 (Dordrecht: Kluwer Academic Publishers), 160, 205 [Google Scholar]
- Farnocchia, D., Chesley, S. R., Brown, P. G., & Chodas, P. W. 2016, Icarus, 274, 327 [NASA ADS] [CrossRef] [Google Scholar]
- Fisher, R. A. 1935, The Design of Experiments (Edinburgh: Oliver and Boyd) [Google Scholar]
- Granvik, M., & Brown, P. 2018, Icarus, 311, 271 [NASA ADS] [CrossRef] [Google Scholar]
- Granvik, M., Morbidelli, A., Jedicke, R., et al. 2016, Nature, 530, 303 [Google Scholar]
- Granvik, M., Morbidelli, A., Vokrouhlický, D., et al. 2017, A&A, 598, A52 [NASA ADS] [CrossRef] [EDP Sciences] [Google Scholar]
- Granvik, M., Morbidelli, A., Jedicke, R., et al. 2018, Icarus, 312, 181 [Google Scholar]
- Harris, A. W., & Drube, L. 2014, ApJ, 785, L4 [NASA ADS] [CrossRef] [Google Scholar]
- Ishiguro, M., Hanayama, H., Hasegawa, S., et al. 2011, ApJ, 740, L11 [NASA ADS] [CrossRef] [Google Scholar]
- Jacobson, S. A., & Scheeres, D. J. 2011, Icarus, 214, 161 [NASA ADS] [CrossRef] [Google Scholar]
- Jenniskens, P. 2006, Meteor Showers and their Parent Comets (Cambridge: Cambridge University Press) [CrossRef] [Google Scholar]
- Jenniskens, P., Shaddad, M. H., Numan, D., et al. 2009, Nature, 458, 485 [NASA ADS] [CrossRef] [PubMed] [Google Scholar]
- JeongAhn, Y.,& Malhotra, R. 2014, Icarus, 229, 236 [NASA ADS] [CrossRef] [Google Scholar]
- Jewitt, D., Weaver, H., Mutchler, M., Larson, S., & Agarwal, J. 2011, ApJ, 733, L4 [NASA ADS] [CrossRef] [Google Scholar]
- Kowalski, R. A., Africano, B. M., Christensen, E. J., et al. 2018, MPEC 2018-L04 [Google Scholar]
- Lindblad, B. A. 1994, 75 Years of Hirayama Asteroid Families: The Role of Collisions in the Solar System History (San Francisco: ASP), 63, 62 [NASA ADS] [Google Scholar]
- Mainzer, A. 2017, J. Geophys. Res. Planets, 122, 789 [NASA ADS] [CrossRef] [Google Scholar]
- Makino, J. 1991, ApJ, 369, 200 [NASA ADS] [CrossRef] [Google Scholar]
- Morbidelli, A.,& Gladman, B. 1998, Meteorit. Planet. Sci., 33, 999 [NASA ADS] [CrossRef] [Google Scholar]
- Murray, C. D., & Dermott, S. F. 1999, Solar System Dynamics (Cambridge: Cambridge University Press) [Google Scholar]
- Nugent, C. R., Mainzer, A., Bauer, J., et al. 2016, AJ, 152, 63 [NASA ADS] [CrossRef] [Google Scholar]
- Olech, A., Żoła̧dek, P., Wiśniewski, M., et al. 2015, MNRAS, 454, 2965 [NASA ADS] [CrossRef] [Google Scholar]
- Schunová, E., Jedicke, R., Walsh, K. J., et al. 2014, Icarus, 238, 156 [NASA ADS] [CrossRef] [Google Scholar]
- Sekanina, Z. 1973, Icarus, 18, 253 [NASA ADS] [CrossRef] [Google Scholar]
- Tricarico, P. 2017, Icarus, 284, 416 [NASA ADS] [CrossRef] [Google Scholar]
- Trigo-Rodríguez, J. M., Lyytinen, E., Jones, D. C., et al. 2007, MNRAS, 382, 1933 [NASA ADS] [CrossRef] [Google Scholar]
- Trigo-Rodríguez, J. M., Lyytinen, E., Gritsevich, M., et al. 2015, MNRAS, 449, 2119 [NASA ADS] [CrossRef] [Google Scholar]
- Valsecchi, G. B., Jopek, T. J., & Froeschle, C. 1999, MNRAS, 304, 743 [NASA ADS] [CrossRef] [Google Scholar]
- Vereš, P., Jedicke, R., Wainscoat, R., et al. 2009, Icarus, 203, 472 [NASA ADS] [CrossRef] [Google Scholar]
- Wall, J. V., & Jenkins, C. R. 2012, Practical Statistics for Astronomers (Cambridge: Cambridge University Press) [CrossRef] [Google Scholar]
- Ye, Q., Wiegert, P. A., & Hui, M.-T. 2018, ApJ, 864, L9 [NASA ADS] [CrossRef] [Google Scholar]
Fragments found in Botswana's Central Kalahari Game Reserve.
“Pseudo-MPEC” for ZLAF9B2 = 2018 LA by Bill Gray (archived from the original).
All Tables
Heliocentric Keplerian orbital elements of asteroids (454100) 2013 BO73, 2016 LR, 2018 BA5, 2018 LA, and 2018 TU.
All Figures
|
Fig. 1 Evolution of the distance from the Earth to relevant NEOs (top panel) – the value of the Hill radius of the Earth, 0.0098 AU, is plotted in orange – semi-major axis (second to top panel), eccentricity (middle panel), inclination (second to bottom panel), and Tisserand parameter with respect to the Earth (bottom panel) of the nominal orbits of (454100) 2013 BO73 (black), 2016 LR (blue), 2018 BA5 (green), 2018 GU11 (brown), 2018 TU (purple), and 2018 LA (red). The zero-point in time corresponds to epoch JD 2458200.5 TDB, 2018 March 23. |
| In the text | |
|
Fig. 2 Evolution backwards in time of the dispersions of the values of the orbital elements of (454100) 2013 BO73 (grey/pink), 2016 LR (blue/cyan), 2018 BA5 (green/lime), 2018 TU (purple/lilac), and 2018 LA (black/red): semi-major axis (top panel), eccentricity (second to top panel), inclination (middle panel), longitude of the ascending node (second to bottom panel), and argument of perihelion (bottom panel). Average values are displayed as thick curves and their ranges (1σ uncertainties) as thin curves. This figure shows results for 500 control orbits of each object; initial positions and velocities have been computed using the covariance matrix. The zero-point in time is as in Fig. 1. |
| In the text | |
|
Fig. 3 Velocity distribution between two virtual NEOs following control orbits statistically compatible with those of (454100) 2013 BO73 and 2018 LA (top panel) – in the histogram, the bin width is 0.025 km s−1, with IQR = 0.194 km s−1 and a mean value of 2.6 ± 0.2 km s−1; 454100 and 2018 TU (second to top panel) – bin width is 0.053 km s−1, with IQR = 0.381 km s−1 and a mean value of 21.9 ± 0.3 km s−1; 2016 LR and 2018 LA (middle panel) – bin width is 0.029 km s−1, with IQR = 0.212 km s−1 and a mean value of 1.8 ± 1.9 km s−1; 2018 BA5 and 2018 LA (second to bottom panel) – bin width is 0.119 km s−1, with IQR = 0.859 km s−1 and a mean value of 11.8 ± 1.3 km s−1; 2018 LA and 2018 TU (bottom panel) – bin width is 0.071 km s−1, with IQR = 0.513 km s−1 and a mean value of 21.5 ± 0.4 km s−1. |
| In the text | |
|
Fig. 4 Results of the randomization test described in the text. The observed average differences betwen empirical and synthetic counts are represented by vertical lines. Top panel: results for (454100) 2013 BO73 -like orbits. Middle panel: results for those of 2018 LA-like orbits. Bottom panel: results for those of 2018 UA-like orbits. |
| In the text | |
Current usage metrics show cumulative count of Article Views (full-text article views including HTML views, PDF and ePub downloads, according to the available data) and Abstracts Views on Vision4Press platform.
Data correspond to usage on the plateform after 2015. The current usage metrics is available 48-96 hours after online publication and is updated daily on week days.
Initial download of the metrics may take a while.