| Issue |
A&A
Volume 694, February 2025
|
|
|---|---|---|
| Article Number | L5 | |
| Number of page(s) | 10 | |
| Section | Letters to the Editor | |
| DOI | https://doi.org/10.1051/0004-6361/202452713 | |
| Published online | 06 February 2025 | |
Letter to the Editor
Basaltic quasi-mini-moon: Characterizing 2024 PT5 with the 10.4 m Gran Telescopio Canarias and the Two-meter Twin Telescope⋆
1
AEGORA Research Group, Facultad de Ciencias Matemáticas, Universidad Complutense de Madrid, Ciudad Universitaria, E-28040 Madrid, Spain
2
Instituto de Astrofísica de Canarias (IAC), C/ Vía Láctea s/n, E-38205 La Laguna, Tenerife, Spain
3
Departamento de Astrofísica, Universidad de La Laguna, E-38206 La Laguna, Tenerife, Spain
4
Light Bridges S.L., Observatorio del Teide, Carretera del Observatorio s/n, E-38500 Guimar, Tenerife, Canarias, Spain
5
Universidad Complutense de Madrid, Ciudad Universitaria, E-28040 Madrid, Spain
6
GRANTECAN, Cuesta de San José s/n, E-38712 Breña Baja, La Palma, Spain
⋆⋆ Corresponding author; This email address is being protected from spambots. You need JavaScript enabled to view it.
Received:
23
October
2024
Accepted:
20
January
2025
Abstract
Context. Small bodies in Earth-like orbits, the Arjunas, are good targets for scientific exploration, and space mining or in situ resource utilization (ISRU) trials as they enable low-cost missions. The subset of these objects that experience recurrent temporarily captured flyby or orbiter episodes are among the best ranked in terms of accessibility. Only a handful of objects are known to have engaged in such a dynamical behavior. Finding and characterizing more of them may help to expand scientific and commercial research activities in space over the next few decades. Asteroid 2024 PT5 is a recent finding that shows dynamical traits in common with this group.
Aims. Here we investigate the orbital context of 2024 PT5 and its spectral and rotational properties.
Method. We studied the short-term orbital evolution of 2024 PT5 using direct N-body simulations. We identified its spectral class from the visible reflectance spectrum and used photometric observations to derive its rotational properties. Observational data were obtained with the OSIRIS camera spectrograph at the 10.4 m Gran Telescopio Canarias and the Two-meter Twin Telescope.
Results. Asteroid 2024 PT5 experiences recurrent co-orbital engagements and episodes in which it has negative geocentric orbital energy while inside a geocentric distance under three Hill radii, which we call quasi-mini-moon events. Its visible spectrum is consistent with that of lunar-like silicates. Photometric data suggest a rotation period ≲1 h.
Conclusions. The discovery of 2024 PT5 confirms that events resembling temporary captures are relatively frequent and involve objects larger than a few meters, suitable as accessible targets for scientific research activities and demonstrating ISRU technologies.
Key words: methods: numerical / techniques: spectroscopic / celestial mechanics / minor planets / asteroids: general / minor planets / asteroids: individual: 2024 PT5
Based on observations made with the Gran Telescopio Canarias (GTC) telescope, in the Spanish Observatorio del Roque de los Muchachos of the Instituto de Astrofísica de Canarias (IAC, program IDs 19-GTC16/24B and 63-GTC56/24B), and the Two-meter Twin Telescope (TTT), in the Spanish Observatorio del Teide of the IAC (PEI project SIDERA24).
© The Authors 2025
 Open Access article, published by EDP Sciences, under the terms of the Creative Commons Attribution License (https://creativecommons.org/licenses/by/4.0), which permits unrestricted use, distribution, and reproduction in any medium, provided the original work is properly cited.
This article is published in open access under the Subscribe to Open model. This email address is being protected from spambots. You need JavaScript enabled to view it. to support open access publication.
1. Introduction
Both ESA and NASA are pushing into the commercial space sector supporting a nascent global space economy (see, e.g., Rausser et al. 2023; Paravano et al. 2024). Scientific exploration and mining or in situ resource utilization (ISRU) of asteroids are activities well suited for development within the context of this fast-evolving sector (see, e.g., Granvik et al. 2013; Sercel et al. 2013; Xie et al. 2021), but only if there are enough targets for low-cost missions. NASA’s Near-Earth Object Human Space Flight Accessible Targets Study (NHATS; Abell et al. 2012)1 is compiling a list of near-Earth objects (NEOs) that identifies potential targets for future exploration, but such a database must include information on the composition of the targets for better mission planning. Reflectance spectroscopy can help in finding what these more accessible targets are made of Licandro et al. (2020), de León et al. (2021).
NHATS includes thousands of targets, but few have been characterized spectroscopically (Popescu et al. 2019). Most targets with the highest number of viable trajectories (the most accessible ones) follow heliocentric orbits with periods close to one sidereal year and have low eccentricity and low inclination. They are part of a secondary asteroid belt that surrounds the orbit of the Earth–Moon system and define a dynamical class, the Arjunas (Rabinowitz et al. 1993). Within the 25 most accessible targets, a handful have recurring temporarily captured flyby or orbiter events, also called mini-moon episodes (Granvik et al. 2012).
The recently found asteroid 2024 PT5 is part of the group of very accessible targets (de la Fuente Marcos & de la Fuente Marcos 2024). Here we used reflectance spectroscopy, photometry, and N-body simulations to confirm its nature and dynamical context. This Letter is organized as follows. In Sect. 2 we introduce the background of our research, and present the data and tools used in our analyses. In Sect. 3 we investigate whether 2024 PT5 is natural or artificial and its probable origin. In Sect. 4 we discuss our results. Section 5 summarizes our conclusions. The Appendices include supporting material.
2. Context, methods, and data
In this section we revisit the dynamical concepts that are used in our analysis. Software tools and data are also discussed here.
2.1. Dynamics background
For this work (but see Appendix A) we adopted the criteria in Kary & Dones (1996) and Granvik et al. (2012). Temporarily captured natural irregular satellites of Earth must have negative geocentric energy, and their geocentric distance must be under three Hill radii (Earth’s Hill radius is ∼0.01 au); in other words, the intruding NEO must approach at close range (< 0.03 au) and low relative velocity (≲1 km s−1). The only NEOs that can regularly meet the capture conditions defined by Kary & Dones (1996) are the Arjunas. Some of them also experience resonant behavior induced by the 1:1 mean-motion resonance (see, e.g., de la Fuente Marcos & de la Fuente Marcos 2013) in which their relative mean longitude with respect to our planet (λr) oscillates about a fixed value (Morais & Morbidelli 2002) to become Earth co-orbitals as their orbital periods closely match that of Earth. One of the resonant states compatible with co-orbital behavior drives objects to a horseshoe trajectory when plotted in a heliocentric frame of reference rotating with our planet because in this case the value of λr oscillates about 180°, with an amplitude > 240° (Murray & Dermott 1999). Perturbed horseshoe paths may lead to temporarily captured flybys, as in the case of 2022 NX1 (de la Fuente Marcos & de la Fuente Marcos 2022; de la Fuente Marcos et al. 2023), or orbiters (see Appendix B).
2.2. Data, data sources, and tools
Object A119q0V was initially reported on August 7, 2024, by the Asteroid Terrestrial-impact Last Alert System (ATLAS, Tonry et al. 2018) observing from Sutherland in South Africa. It was announced on August 14 with the provisional designation 2024 PT5 (Tonry et al. 2024). Its orbital solution in Table 1 is consistent with that of an Apollo-class asteroid. It is currently based on 358 observations with an observational timespan of 172 days and referred to epoch JD 2460600.5 TDB, which is the origin of time in the calculations. It was retrieved from the Jet Propulsion Laboratory (JPL) Small-Body Database (SBDB)2 provided by the Solar System Dynamics Group (SSDG, Giorgini et al. 2011; Giorgini 2015)3. The object attracted our attention because it approached Earth at close range and low relative velocity.
Values of the heliocentric osculating orbital elements of 2024 PT5 and their respective 1σ uncertainties.
The orbit of 2024 PT5 resembles that of 2022 NX1, a confirmed natural object that experiences recurrent resonant co-orbital episodes and temporarily captured flybys. Asteroid 2022 NX1 also undergoes periodic close encounters with the Earth–Moon system that make the reconstruction of its past orbital evolution and the prediction of its future behavior beyond a few decades difficult (de la Fuente Marcos & de la Fuente Marcos 2022; de la Fuente Marcos et al. 2023). In such cases, the orbital evolution has to be studied statistically considering the uncertainties of the orbit. The calculations needed to investigate the evolution of 2024 PT5 were carried out using a direct N-body code described by Aarseth (2003), publicly available from the website of the Institute of Astronomy of the University of Cambridge4 which implements the Hermite numerical integration scheme developed by Makino (1991). Further details and the relevant results from this code were discussed in de la Fuente Marcos & de la Fuente Marcos (2012). Our physical model included the perturbations by the eight major planets, the Moon, the barycenter of the Pluto-Charon system, and the 19 largest asteroids: Ceres, Pallas, Vesta, Hygiea, Euphrosyne, Interamnia, Davida, Herculina, Eunomia, Juno, Psyche, Europa, Thisbe, Iris, Egeria, Diotima, Amphitrite, Sylvia, and Doris. For accurate initial positions and velocities (see Appendix C), we used data based on the DE440/441 planetary ephemeris (Park et al. 2021) from JPL’s SSDG Horizons online Solar System data and ephemeris computation service5. Most input data were retrieved from SBDB and Horizons using tools provided by the Python package Astroquery (Ginsburg et al. 2019) and its HorizonsClass class6
3. Results
We used N-body simulations to assess the current dynamical status of 2024 PT5, reflectance spectroscopy to determine its physical nature, and photometry to study its rotational state.
3.1. Orbital evolution
Figure 1 summarizes the results of our calculations, showing the time evolution of the relevant parameters of 2024 PT5: the relative mean longitude, and the geocentric energy and distance. The figure shows the evolution of the nominal orbit and those of the control orbits or clones with state vectors (Cartesian coordinates and velocities; see Table C.1) well away from the nominal orbit, up to ±9σ from the nominal orbital solution in Table 1. The right panels in Fig. 1 show that the short-term evolution of all the control orbits matches that of the nominal orbit. Therefore, we confirm the results in de la Fuente Marcos & de la Fuente Marcos (2024) obtained using an early orbital solution. However, the left panel in Fig. 1 (see also Fig. C.2) shows that recovering the past orbital evolution of 2024 PT5 prior to 1937 is difficult because a close encounter with Earth causes originally close orbits to diverge. This is also found when predicting the behavior of this object beyond 2084. In other words, the orbital evolution over the time interval (−87, 60) yr in the left panel of Fig. 1 can be computed precisely, but beyond this time interval the current orbital solution cannot provide reliable ephemerides.
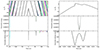 |
Fig. 1. Short-term evolution and capture episode of 2024 PT5. The left panels show the evolution of the values of the relevant parameters over the time interval (−150, 150) yr. The right panels focus on the time window (−1.0, 1.0) yr around the current epoch (2460600.5 TDB, 2024-Oct.-17.0). Top: time evolution of the relative mean longitude. Middle: Time evolution of the geocentric energy that focuses on negative values. Bottom: Time evolution of the geocentric distance for values under 0.03 au. The evolution of the nominal orbit is shown in black, those of the control orbits with state vectors separated ±3σ from the nominal ones in lime–green, ±6σ in cyan–blue, and ±9σ in fuchsia–crimson. The unit of energy is such that the units of mass, distance, and time are 1 M⊙, 1 au, and one sidereal year divided by 2π, respectively. The output interval is 0.36525 d. |
Figure 1, right panels, shows that from 2023 until 2025, 2024 PT5 followed a horseshoe-like trajectory (top panel) not too different from that of 2022 NX1 in Fig. 3 of de la Fuente Marcos et al. (2023). It is also observed in 2024, between September 29 and November 25, that the geocentric energy of all the control orbits had a negative value (Fig. 1, middle right panel), and that its geocentric distance remained under 0.03 au during the same time interval (bottom panel). According to Kary & Dones (1996), 2024 PT5 was a temporary satellite of Earth during that period. Furthermore, as the asteroid failed to complete one revolution around Earth and following Granvik et al. (2012), 2024 PT5 underwent a temporarily captured flyby; we call this a quasi-mini-moon event. This result is statistically robust and consistent across the control orbits tested (104). Figure 1, left panels, shows that the evolution of 2024 PT5 is seriously affected by orbital chaos induced by close encounters with the Earth–Moon system. The middle and bottom panels show that recurrent temporarily captured flyby episodes could be possible. In fact, this object may experience further temporarily captured flybys in the future (in 2084 for about 43 d).
3.2. Spectroscopy
Three visible spectra of 2024 PT5 were obtained on the night of September 7, 2024, starting at 22:45 UTC, using the OSIRIS camera spectrograph (Cepa et al. 2000; Cepa 2010). The instrument is installed at the 10.4 m Gran Telescopio Canarias (GTC), located at the El Roque de los Muchachos Observatory, on La Palma. It has a blue-sensitive 4096 × 4096 pixel CCD that yields a 7.8′ × 7.8′ field of view. Observations were done using a slit width of 1.2″ (oriented to the parallactic angle) and the R300R grism (0.48–0.92 μm). We obtained three individual spectra of 900 s of exposure time each, at an airmass of 1.45. Two solar analog stars (Landolt SA 112-1333 and SA115-271) were also observed with the same instrumental configuration and at a similar airmass to that of the asteroid in order to get its reflectance spectrum. The 2D spectral images of the asteroid and the two solar analogs were bias and flat-field corrected, background subtracted, and collapsed to 1D using an aperture equal to the distance from the center of the spatial profile to the pixel with 10% peak intensity. One-dimensional spectra were then wavelength calibrated with Xe+Ne+HgAr arc lamps, and a final averaged spectrum for the asteroid and for each star were obtained. As a last step, we divided the spectrum of the asteroid by the spectrum of each solar analog star, and averaged the two resulting ratios. The final reflectance spectrum of 2024 PT5 is shown in Fig. 2, in green.
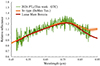 |
Fig. 2. Visible spectrum of 2024 PT5 obtained with GTC, in green, compared with the best taxonomical fit (Sv-type from DeMeo et al. 2009), in orange. The hatched light orange area corresponds to ±1σ of the mean spectrum of Sv-types. A best-fit spectrum of a RELAB powder sample (ID LU-CMP-004-B) of a mare breccia from the Moon (Luna 24 mission) is also shown as a comparison, in red. The spectra were normalized to unity at 0.55 μm. |
We used the M4AST7 online tool (Popescu et al. 2012) to get the most representative taxonomical type for 2024 PT5. This tool fits a curve to the spectrum and compares it to the “taxons” defined by DeMeo et al. (2009) using a χ2 procedure. The best fit corresponds to an Sv-type (in orange in Fig. 2), a class that serves as a link between S-types (mixtures of silicates and metal) and V-types, indicative of basaltic surfaces, and with asteroid (4) Vesta as the main representative of the class. The M4AST tool was also used to compare the spectrum of the asteroid with more than 15 000 spectra of meteorites, terrestrial rocks, and lunar soils contained in the RELAB8 database. Figure 2 shows the best fit in red, corresponding to a powder sample (grain sizes from 10 to 45 μm) from a mare breccia of the Moon, collected by the Luna 24 mission. Interestingly, and in order of increasing values of χ2, this best fit is followed by several samples from Moon maria collected at the Apollo 12 landing site, and a sample of a terrestrial basaltic rock (Brockenheim, Germany).
Sharkey et al. (2021) found that Earth’s quasi-satellite (469219) 2016 HO3 Kamo’oalewa (de la Fuente Marcos & de la Fuente Marcos 2016) has a visible spectrum consistent with the S- and L-type taxonomic classes (see Fig. 3), similar to that of 2022 NX1 published in de la Fuente Marcos et al. (2023) and classified as a K-type, and different from the visible spectrum of 2024 PT5. However, when extended to the near-infrared, Kamo’oalewa shows a very red spectral slope, consistent with space-weathered lunar-like silicates. This outlines the importance of having spectral information at near-infrared wavelengths, even in the form of colors, as in Sharkey et al. (2021), to better constrain the surface composition of asteroids. We note that our visible spectrum of 2024 PT5 shows a deeper absorption band at 1 μm compared to that of Kamo’oalewa, suggesting less weathered lunar-like silicates.
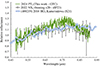 |
Fig. 3. Comparison between the visible spectrum of 2022 NX1, in gray (dlF23 – de la Fuente Marcos et al. 2023); 2024 PT5, in green; and that of the quasi-satellite (469219) 2016 HO3 Kamo’oalewa, in light blue (S21 – Sharkey et al. 2021), all normalized to unity at 0.55 μm. |
3.3. Light curve
The OSIRIS instrument was also used to study the rotational properties of the object. On September 28, 2024, a series of continuous 30 s exposures was taken over one hour using the Sloan-r filter and the standard CCD configuration (2 × 2 binning, plate scale of 0.254″ pixel−1, readout time of 21 s). At the time of observation, the object had an apparent magnitude of r ∼ 23 and a total apparent angular rate of 1.2″ min−1. Standard bias and flat-field corrections were applied to reduce the images.
Relative aperture photometry was performed on the images using three field stars as reference stars, scaled by the mean magnitude of the target during the observed interval. Different aperture radii were tested, including both fixed and variable apertures with aperture corrections. The best result, obtained using a fixed aperture radius of about 1.25 × FWHM, is shown in Fig. 4.
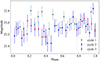 |
Fig. 4. Light curve of 2024 PT5 obtained with GTC/OSIRIS. The data are displayed binned in three cycles for a rotation period of 20.96 min. |
The phased light curve is shown in Fig. 4 for a possible value of the period of 21 ± 2 min (see further details in Appendix D). A variability with an amplitude of ∼0.3–0.4 mag was observed during the one-hour observing block, which is consistent with the uncertainty in H in Table 1. We also note that the low signal-to-noise ratio (S/N) of the data do not allow an unambiguous determination of the rotation period; but our data, together with those in Bolin et al. (2025), suggest a rotation period ≲1 h.
4. Discussion
Our spectroscopic results on the surface composition of 2024 PT5 are not conclusive due to the lack of a near-infrared reflectance spectra, but they are suggestive of a lunar origin. Kareta et al. (2025) presented a visible to near-infrared spectrum of 2024 PT5 that, as in our case, is well matched by samples of the Moon, and is indicative of the presence of less weathered lunar-like silicates for 2024 PT5 than for (469219) 2016 HO3 Kamo’oalewa and 2022 NX1. Everything considered, the three objects may all have a common origin as lunar ejecta.
The topic of the dynamics of lunar ejecta in the neighborhood of the Earth–Moon system was first studied by Warren (1994) and Gladman et al. (1995), who arrived at the conclusion that these materials can be scattered out of their source region relatively quickly, on an effective timescale of ∼105 yr. This subject is now receiving renewed attention (Castro-Cisneros et al. 2023, 2025; Jiao et al. 2024) after the confirmation of Kamo’oalewa as lunar ejecta, but it is also being linked to the origin of the NEOs involved in temporary capture events (Jedicke et al. 2024). Nevertheless, the theoretical expectations drawn from the literature indicate that Kamo’oalewa, 2022 NX1, and 2024 PT5 may have all emerged out of lunar impact craters formed during the last one million years or so.
Our rotation period results are consistent with the ∼20 min periodic variation reported by Bolin et al. (2025). The different results obtained by Kareta et al. (2025) can be attributed to changed viewing geometry. The obtained periodic variability would be similar to that of Kamo’oalewa, which has an estimated rotation period of  min (Sharkey et al. 2021). For an object with an absolute magnitude of 27.4, the possibility of a higher rotational frequency or even tumbling motion cannot be excluded. However, observations with higher time resolution and better S/N are required to confirm any such behavior.
5. Summary and conclusions
In this Letter we presented a detailed analysis of a mini-moon-like engagement experienced by Arjuna asteroid 2024 PT5 in 2024, from September 29 to November 25. The study of the short-term orbital evolution of 2024 PT5 was carried out using direct N-body simulations. We derived its spectral class from a visible reflectance spectrum obtained with the OSIRIS camera spectrograph at the 10.4 m Gran Telescopio Canarias. Data from the same instrument were used to perform a preliminary assessment of its rotational state. Astrometry was obtained using the Two-meter Twin Telescope (see Appendix E). Our conclusions can be summarized as follows:
-
We confirm that 2024 PT5 is a natural object with a visible spectrum consistent with that of lunar mare breccia, suggesting the presence of less weathered lunar-like silicates than in the case of (469219) 2016 HO3 Kamo’oalewa or 2022 NX1.
-
We estimate a rotational period ≲1 h, tumbling not excluded.
-
We confirm that 2024 PT5 had negative geocentric orbital energy while inside a geocentric distance under three Hill radii between September 29 and November 25, 2024. We call such engagements quasi-mini-moon events.
-
The orbital evolutions of 2022 NX1 and 2024 PT5 as Arjunas are very similar.
Both ESA and NASA now emphasize a low-cost approach to NEO missions for small body science and planetary defense, including the reuse and repurposing of already active missions (Freeman et al. 2024). The discovery and characterization of accessible objects such as 2022 NX1 and 2024 PT5 using ground-based facilities is a necessary step before deciding whether an ongoing mission can be extended to study a newly found NEO or if a new low-cost mission is perhaps preferable.
Acknowledgments
We thank the referee, M. Granvik, for a constructive, detailed, and actionable report. JdL and JL acknowledge support from the Spanish ‘Agencia Estatal de Investigación del Ministerio de Ciencia e Innovación’ (AEI-MCINN) under the grant PID2020-120464GB-I00. This work was partially supported by the Spanish ‘Agencia Estatal de Investigación (Ministerio de Ciencia e Innovación)’ under grant PID2020-116726RB-I00 /AEI/10.13039/501100011033. Based on observations made with the Gran Telescopio Canarias (GTC), installed at the Spanish Observatorio del Roque de los Muchachos of the Instituto de Astrofísica de Canarias, on the island of La Palma. This work is partly based on data obtained with the instrument OSIRIS, built by a Consortium led by the Instituto de Astrofísica de Canarias in collaboration with the Instituto de Astronomía of the Universidad Nacional Autónoma de Mexico. OSIRIS was funded by GRANTECAN and the National Plan of Astronomy and Astrophysics of the Spanish Government. This Letter includes observations made in the Two-meter Twin Telescope (TTT) and Transient Survey Telescope (TST) in the Teide Observatory of the IAC, that Light Bridges operates in the Island of Tenerife, Canary Islands (Spain). The Observing Time Rights (DTO) used for this research were provided by PEI project SIDERA24. This Letter used flash storage and GPU computing resources as Indefeasible Computer Rights (ICRs) being commissioned at the ASTRO POC project that Light Bridges will operate in the Island of Tenerife, Canary Islands (Spain). The ICRs used for this research were provided by Light Bridges in cooperation with Hewlett Packard Enterprise (HPE) and VAST DAT. This research utilizes spectra acquired by Carle M. Pieters with the NASA RELAB facility at Brown University. In preparation of this Letter, we made use of the NASA Astrophysics Data System, the ASTRO-PH e-print server, and the Minor Planet Center (MPC) data server.
References
- Aarseth, S. J. 2003, Gravitational N-Body Simulations (Cambridge: Cambridge University Press), 27 [Google Scholar]
- Abell, P. A., Barbee, B. W., Mink, R. G., et al. 2012, 43rd Annual Lunar and Planetary Science Conference, 2842 [Google Scholar]
- Alarcon, M. R., Licandro, J., Serra-Ricart, M., et al. 2023, PASP, 135, 055001 [NASA ADS] [CrossRef] [Google Scholar]
- Bolin, B. T., Fremling, C., Holt, T. R., et al. 2020, ApJ, 900, L45 [NASA ADS] [CrossRef] [Google Scholar]
- Bolin, B. T., Denneau, L., Abron, L.-M., et al. 2025, ApJ, 978, L37 [NASA ADS] [CrossRef] [Google Scholar]
- Carusi, A., & Valsecchi, G. B. 1979, Riunione della Societa Astronomica Italiana, 22, 181 [NASA ADS] [Google Scholar]
- Castro-Cisneros, J. D., Malhotra, R., & Rosengren, A. J. 2023, Communications Earth and Environment, 4, 372 [Google Scholar]
- Castro-Cisneros, J. D., Malhotra, R., & Rosengren, A. J. 2025, Icarus, 429, 116379 [NASA ADS] [CrossRef] [Google Scholar]
- Cepa, J., Aguiar, M., Escalera, V. G., et al. 2000, Proc. SPIE, 4008, 623 [NASA ADS] [CrossRef] [Google Scholar]
- Cepa, J. 2010, Astrophysics and Space Science Proceedings, 14, 15 [NASA ADS] [CrossRef] [Google Scholar]
- de la Fuente Marcos, C., & de la Fuente Marcos, R. 2012, MNRAS, 427, 728 [Google Scholar]
- de la Fuente Marcos, C., & de la Fuente Marcos, R. 2013, MNRAS, 434, L1 [NASA ADS] [CrossRef] [Google Scholar]
- de la Fuente Marcos, C., & de la Fuente Marcos, R. 2016, MNRAS, 462, 3441 [CrossRef] [Google Scholar]
- de la Fuente Marcos, C., & de la Fuente Marcos, R. 2020, MNRAS, 494, 1089 [NASA ADS] [CrossRef] [Google Scholar]
- de la Fuente Marcos, C., & de la Fuente Marcos, R. 2022, RNAAS, 6, 160 [NASA ADS] [Google Scholar]
- de la Fuente Marcos, C., & de la Fuente Marcos, R. 2024, RNAAS, 8, 224 [NASA ADS] [Google Scholar]
- de la Fuente Marcos, R., de León, J., de la Fuente Marcos, C., et al. 2023, A&A, 670, L10 [NASA ADS] [CrossRef] [EDP Sciences] [Google Scholar]
- de León, J., Licandro, J., Popescu, M., et al. 2021, 7th IAA Planetary Defense Conference, 25 [Google Scholar]
- DeMeo, F., Binzel, R. P., Slivan, S. M., et al. 2009, Icarus, 202, 160 [NASA ADS] [CrossRef] [Google Scholar]
- Fedorets, G., Granvik, M., & Jedicke, R. 2017, Icarus, 285, 83 [Google Scholar]
- Freeman, A., Fesq, L., Matousek, S., et al. 2024, Acta Astronautica, 224, 122 [NASA ADS] [CrossRef] [Google Scholar]
- Ginsburg, A., Sipőcz, B. M., Brasseur, C. E., et al. 2019, AJ, 157, 98 [Google Scholar]
- Giorgini, J. 2011, in Journées Systèmes de Référence Spatio-temporels 2010, ed. N. Capitaine, 87 [Google Scholar]
- Giorgini, J. D. 2015, IAUGA, 22, 2256293 [Google Scholar]
- Gladman, B. J., Burns, J. A., Duncan, M. J., et al. 1995, Icarus, 118, 302 [NASA ADS] [CrossRef] [Google Scholar]
- Granvik, M., Vaubaillon, J., & Jedicke, R. 2012, Icarus, 218, 262 [NASA ADS] [CrossRef] [Google Scholar]
- Granvik, M., Jedicke, R., Bolin, B., et al. 2013, in Earth’s Temporarily-Captured Natural Satellites– The First Step towards Utilization of Asteroid Resources in Asteroids: ProspectiveEnergy and Material Resources, ed. V. Badescu (Berlin, Heidelberg: Springer), 151 [Google Scholar]
- Jedicke, R., Alessi, E., Wiedner, N., et al. 2024, American Astronomical Society Meeting Abstracts, 243, 363.03 [NASA ADS] [Google Scholar]
- Jiao, Y., Cheng, B., Huang, Y., et al. 2024, Nature Astronomy, 8, 819 [CrossRef] [Google Scholar]
- Kareta, T., Fuentes-Muñoz, O., Moskovitz, N., et al. 2025, ApJ, 979, L8 [CrossRef] [Google Scholar]
- Kary, D. M., & Dones, L. 1996, Icarus, 121, 207 [NASA ADS] [CrossRef] [Google Scholar]
- Kwiatkowski, T., Kryszczyńska, A., Polińska, M., et al. 2009, A&A, 495, 967 [NASA ADS] [CrossRef] [EDP Sciences] [Google Scholar]
- Licandro, J., Popescu, M., Oscoz, A., et al. 2020, 14th European Planetary Science Congress, 203 [Google Scholar]
- Makino, J. 1991, ApJ, 369, 200 [Google Scholar]
- Morais, M. H. M., & Morbidelli, A. 2002, Icarus, 160, 1 [NASA ADS] [CrossRef] [Google Scholar]
- Murray, C. D., & Dermott, S. F. 1999, Solar System Dynamics (Cambridge: Cambridge University Press) [Google Scholar]
- Paravano, A., Patrizi, M., Razzano, E., et al. 2024, Acta Astronautica, 222, 162 [NASA ADS] [CrossRef] [Google Scholar]
- Park, R. S., Folkner, W. M., Williams, J. G., et al. 2021, AJ, 161, 105 [NASA ADS] [CrossRef] [Google Scholar]
- Popescu, M., Birlan, M., & Nedelcu, D. A. 2012, A&A, 544, A130 [NASA ADS] [CrossRef] [EDP Sciences] [Google Scholar]
- Popescu, M., Vaduvescu, O., de León, J., et al. 2019, A&A, 627, A124 [NASA ADS] [CrossRef] [EDP Sciences] [Google Scholar]
- Rabinowitz, D. L., Gehrels, T., Scotti, J. V., et al. 1993, Nature, 363, 704 [NASA ADS] [CrossRef] [Google Scholar]
- Rausser, G., Choi, E., & Bayen, A. 2023, Proceedings of the National Academy of Science, 120 [CrossRef] [Google Scholar]
- Rickman, H., & Malmort, A. M. 1981, A&A, 102, 165 [NASA ADS] [Google Scholar]
- Sercel, J. C., Peterson, C. E., Britt, D. T., et al. 2013, in Practical Applications of Asteroidal ISRU in Support of Human Exploration in Primitive Meteorites and Asteroids, ed. N. Abreu (Amsterdam: Elsevier), 477 [Google Scholar]
- Sharkey, B. N. L., Reddy, V., Malhotra, R., et al. 2021, Communications Earth and Environment, 2, 231 [NASA ADS] [CrossRef] [Google Scholar]
- Stellingwerf, R. F. 1978, ApJ, 224, 953 [Google Scholar]
- Tonry, J. L., Denneau, L., Heinze, A. N., et al. 2018, PASP, 130, 064505 [Google Scholar]
- Tonry, J., Robinson, J., Fitzsimmons, A., et al. 2024, Minor Planet Electronic Circulars, 2024–P170 [Google Scholar]
- Warren, P. H. 1994, Icarus, 111, 338 [NASA ADS] [CrossRef] [Google Scholar]
- Xie, R., Bennett, N. J., & Dempster, A. G. 2021, Acta Astronautica, 181, 249 [NASA ADS] [CrossRef] [Google Scholar]
Appendix A: One Hill radius versus three Hill radii
A gravitationally bound two-body system has negative total energy. Although within the two-body problem this criterion is unambiguous, subsystems within complex N-body systems may require additional constraints to ensure that a certain subsystem is indeed bound. In the particular case of planets and captured objects, Carusi & Valsecchi (1979) advocated the use of a simple criterion, that the planetocentric energy of the object must be negative. Rickman & Malmort (1981) recommended adding, as a second restriction, that the object completes at least one revolution around the planet.
Kary & Dones (1996) recognized the critical role played by the relative distance during temporary captures by planets hosted by stars and defined temporary satellite capture by a planet using two conditions that must be met at the same time: The planetocentric energy of the object must be negative and its planetocentric distance must be under three Hill radii for the planet involved. The value of the Hill radius of Earth is roughly 0.01 au so the second condition for our planet implies flybys closer than ∼0.03 au. This criterion involving both geocentric energy and separation was used by Granvik et al. (2012) to define what temporarily captured natural irregular satellites of Earth are. From there, they designated captured objects that do not complete at least one revolution around Earth as temporarily captured flybys and those completing one or more revolutions as temporarily captured orbiters. However, Fedorets et al. (2017) made the temporary capture criterion more restrictive by decreasing the separation threshold from three Hill radii to one Hill radius. For Fedorets et al. (2017), temporarily captured flybys must have negative planetocentric orbital energy and maximum planetocentric distance under one Hill radius.
In this work, we use the definitions in Kary & Dones (1996) and Granvik et al. (2012). For a temporary capture to take place, the intruding NEO must approach at close range (< 0.03 au) and low relative velocity (≲1 km s−1). For Fedorets et al. (2017), the unusual choreography interpreted by 2024 PT5 and the Earth–Moon system is not a temporary capture.
The Hill radius is often used to define the sphere of influence of a planet within the context of the two-body problem and the restricted three-body problem (Murray & Dermott 1999). As in Fedorets et al. (2017), it is often argued that true temporary captures can only take place when the planetocentric energy becomes negative inside the Hill radius of the planet. We believe that the restrictive use of the one Hill radius versus the three Hill radii criterion may lead to inconsistent interpretations of the actual temporary orbital status of these objects. In fact, if calculations are repeated giving negligible mass to the Earth–Moon system, no looping around Earth is observed; in other words, the gravitational influence of Earth in these cases is not negligible beyond one Hill radius. In addition, the strict one revolution around Earth condition cited by some is often difficult to assess because the geocentric loops traveled during temporary captures are far from closed elliptical orbits.
Appendix B: Mini-moons: The tally so far
So far, temporary captures by Earth, meeting the conditions in Kary & Dones (1996) and Granvik et al. (2012), have been reported for Apollo-class asteroids 2006 RH120 (Kwiatkowski et al. 2009), 2020 CD3 (Bolin et al. 2020; de la Fuente Marcos & de la Fuente Marcos 2020), 2022 NX1 (de la Fuente Marcos & de la Fuente Marcos 2022; de la Fuente Marcos et al. 2023), and 2024 PT5 (de la Fuente Marcos & de la Fuente Marcos 2024; Bolin et al. 2025). However, considering the more restrictive criterion featured in Fedorets et al. (2017), only 2006 RH120, 2020 CD3, and 2022 NX1 experienced temporary captures by Earth.
The condition requiring negative planetocentric energy during capture is equivalent to having planetocentric eccentricity < 1. Figures B.1 to B.4 are similar to Fig. C.1, but they show the ephemerides retrieved from JPL’s Horizons instead of displaying the results of our computer simulations. They clearly show the differences between temporarily captured orbiters (2006 RH120 and 2020 CD3) and temporarily captured flybys (2022 NX1 and 2024 PT5), but they also show that the strict application of the one Hill radius criterion may lead us to reclassify the capture episodes of 2006 RH120 and 2020 CD3 as a sequence of temporarily captured flybys, which is obviously incorrect.
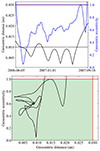 |
Fig. B.1. Capture episode for 2006 RH120. Top panel: Time evolution of the geocentric eccentricity and distance. Bottom panel: Geocentric eccentricity as a function of the geocentric distance. The one Hill radius mark is shown in pink, the three Hill radii mark in red. Source: JPL’s Horizons. |
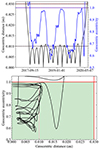 |
Fig. B.2. Capture episode for 2020 CD3. Top panel: Time evolution of the geocentric eccentricity and distance. Bottom panel: Geocentric eccentricity as a function of the geocentric distance. The one Hill radius mark is shown in pink, the three Hill radii mark in red. Source: JPL’s Horizons. |
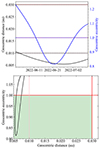 |
Fig. B.3. Capture episode for 2022 NX1. Top panel: Time evolution of the geocentric eccentricity and distance. Bottom panel: Geocentric eccentricity as a function of the geocentric distance. The one Hill radius mark is shown in pink, the three Hill radii mark in red. Source: JPL’s Horizons. |
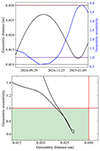 |
Fig. B.4. Capture episode for 2024 PT5. Top panel: Time evolution of the geocentric eccentricity and distance. Bottom panel: Geocentric eccentricity as a function of the geocentric distance. Source: JPL’s Horizons. |
Appendix C: Input data and uncertainties
Here we include the barycentric Cartesian state vector of NEO 2024 PT5. This vector and its uncertainties were used to perform the calculations discussed above and to generate the figures that display the time evolution of the critical angle, λr, and the geocentric energy and distance. As an example, a new value of the X-component of the state vector was computed using Xc = X + σXr, where r is an univariate Gaussian random number, and X and σX are the mean value and its 1σ uncertainty in Table C.1.
Barycentric Cartesian state vector of 2024 PT5: Components and associated 1σ uncertainties.
Figure C.1 shows the capture episode for the nominal orbit in greater detail. The minimum value of the geocentric energy coincides with a local maximum in the geocentric distance. The capture takes place when the asteroid approaches the apogee of its highly asymmetric geocentric trajectory and its geocentric velocity reaches a minimum.
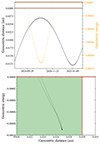 |
Fig. C.1. Capture episode for 2024 PT5. Top panel: Time evolution of the geocentric energy and distance. Bottom panel: Geocentric energy as a function of the geocentric distance. The green zone signals the region where the definition in Kary & Dones (1996) holds. The unit of energy is such that the unit of mass is 1 M⊙, the unit of distance is 1 au, and the unit of time is one sidereal year divided by 2π. |
Figure C.2 is analogous to Fig. 1, but corresponds to control orbits with state vectors separated by ±1σ, ±2σ, and ±3σ from that of the nominal orbit. These results are consistent with those presented in Sect. 3.1, the orbital evolution of 2024 PT5 over the time interval (−87, 60) yr is robust, but outside this interval the dynamics have to be discussed in statistical terms as the evolution of arbitrarily close orbits diverges exponentially. Figure C.2, top panel, shows that 2024 PT5 might have experienced 1:1 resonant behavior of the horseshoe type in the past, and perhaps it will again in the future, but the evolution is strongly affected by orbital chaos driven by close encounters with the Earth–Moon system.
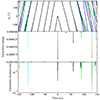 |
Fig. C.2. Short-term evolution and capture episode of 2024 PT5. The panels show the evolution of the values of relevant parameters over the time interval (−150, 150) yr around the current epoch. Top panel: Time evolution of the relative mean longitude. Middle panel: Time evolution of the geocentric energy that focuses on negative values. Bottom panel: Time evolution of the geocentric distance that focuses on values under 0.03 au. The evolution of the nominal orbit is shown in black, those of control orbits with state vectors separated ±1σ from the nominal ones in lime–green, ±2σ in cyan–blue, and ±3σ in fuchsia–crimson. The unit of energy is such that the unit of mass is 1 M⊙, the unit of distance is 1 au, and the unit of time is one sidereal year divided by 2π. The output interval is 0.36525 d. The origin of time is epoch 2460600.5 (2024-Oct-17.0) TDB. |
Appendix D: Time series analysis
We analyzed the light curve using the Phase Dispersion Minimization method (PDM; Stellingwerf 1978) to find its rotation period. The PDM method minimizes the sum of the squares of the differences in the ordinate from one data point to the next. The chosen period is the one resulting in the smallest sum; in other words, the one producing the least possible scatter about the derived light curve. The dispersion as a function of the test period is shown in Fig. D.1. We obtained a possible variation with a period P = 21±2 min.
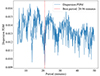 |
Fig. D.1. Sum of the squares of the differences in the ordinate from one data point to the next for the light curve of 2024 PT5 obtained with GTC/OSIRIS. The value that produces the least possible scatter is ∼21 min. |
Appendix E: TTT and TST astrometry
Astrometric observations were obtained using three telescopes located at Teide Observatory (OT, Tenerife, Canary Islands, Spain), the TTT1 and TTT2 (Two-meter Twin Telescope), and the TST (Transient Survey Telescope) as part of the key project observations during the commissioning phase. The observational circumstances are shown in Table E.1. Additional astrometry from these telescopes was submitted to the Minor Planet Center (MPC).9 A stacked image of 2024 PT5 obtained with TTT1 is shown in Fig. E.1.
TTT10 currently has two telescopes, TTT1 and TTT2. They are two Ritchey-Chrétien optical systems, with an aperture of 0.80 m, altazimuthal mount, and two f/6.85 Nasmyth foci each. TST11 is an ultra-wide-field prime corrector optical system, with an aperture of 1 m, equatorial mount, and a f/1.3 primary foci.
TTT1 was equipped with a 2Kpx×2Kpx Andor iKon-L 936 camera, with a back-illuminated 13.5 μm pixel−1 BEX2-DD CCD sensor, resulting in a FoV of 17.3′×17.3′, and a plate scale of 0.51″ pixel−1. QHY411M12 cameras (Alarcon et al. 2023) are installed on TTT2 and TST telescopes. The QHY411M camera sports a scientific Complementary Metal-Oxide-Semiconductor (sCMOS) image sensor with 14304 px × 10748 px (151 Mpx = 302 MB) of size 3.76 μm pixel−1. This setup provides an effective FoV of 34′×25′ (with a plate scale of 0.14″ pixel−1) for TTT2 and 2.4°×1.8° (0.6″ pixel−1) for TST.
All the images were taken using the Luminance filter (Lum), that covers the 0.4 to 0.7 μm wavelength range. Data reduction was done using standard procedures, correcting for bias, dark, and sky flat-fielding. The astrometry was extracted using the Tycho software,13 applying the track and stack method. To increase the object’s S/N, stacking was done tracking on 2024 PT5 orbit using the orbital ephemeris of the object (individual images have sidereal tracking). The ephemerides were obtained from the MPC website.14
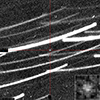 |
Fig. E.1. Image of 2024 PT5 (center, point source) obtained with TTT1. This image is a combination of a sequence of individual images, each obtained in sidereal tracking mode. The asteroid remains stationary in the combined image because it was tracked and stacked using 2024 PT5 ephemeris data from the MPC website (see text for details). The background stars trail because of 2024 PT5’s motion. The bottom right square shows a magnified view of the point-like source. |
Observing log.
All Tables
Values of the heliocentric osculating orbital elements of 2024 PT5 and their respective 1σ uncertainties.
Barycentric Cartesian state vector of 2024 PT5: Components and associated 1σ uncertainties.
All Figures
|
Fig. 1. Short-term evolution and capture episode of 2024 PT5. The left panels show the evolution of the values of the relevant parameters over the time interval (−150, 150) yr. The right panels focus on the time window (−1.0, 1.0) yr around the current epoch (2460600.5 TDB, 2024-Oct.-17.0). Top: time evolution of the relative mean longitude. Middle: Time evolution of the geocentric energy that focuses on negative values. Bottom: Time evolution of the geocentric distance for values under 0.03 au. The evolution of the nominal orbit is shown in black, those of the control orbits with state vectors separated ±3σ from the nominal ones in lime–green, ±6σ in cyan–blue, and ±9σ in fuchsia–crimson. The unit of energy is such that the units of mass, distance, and time are 1 M⊙, 1 au, and one sidereal year divided by 2π, respectively. The output interval is 0.36525 d. |
| In the text | |
|
Fig. 2. Visible spectrum of 2024 PT5 obtained with GTC, in green, compared with the best taxonomical fit (Sv-type from DeMeo et al. 2009), in orange. The hatched light orange area corresponds to ±1σ of the mean spectrum of Sv-types. A best-fit spectrum of a RELAB powder sample (ID LU-CMP-004-B) of a mare breccia from the Moon (Luna 24 mission) is also shown as a comparison, in red. The spectra were normalized to unity at 0.55 μm. |
| In the text | |
|
Fig. 3. Comparison between the visible spectrum of 2022 NX1, in gray (dlF23 – de la Fuente Marcos et al. 2023); 2024 PT5, in green; and that of the quasi-satellite (469219) 2016 HO3 Kamo’oalewa, in light blue (S21 – Sharkey et al. 2021), all normalized to unity at 0.55 μm. |
| In the text | |
|
Fig. 4. Light curve of 2024 PT5 obtained with GTC/OSIRIS. The data are displayed binned in three cycles for a rotation period of 20.96 min. |
| In the text | |
|
Fig. B.1. Capture episode for 2006 RH120. Top panel: Time evolution of the geocentric eccentricity and distance. Bottom panel: Geocentric eccentricity as a function of the geocentric distance. The one Hill radius mark is shown in pink, the three Hill radii mark in red. Source: JPL’s Horizons. |
| In the text | |
|
Fig. B.2. Capture episode for 2020 CD3. Top panel: Time evolution of the geocentric eccentricity and distance. Bottom panel: Geocentric eccentricity as a function of the geocentric distance. The one Hill radius mark is shown in pink, the three Hill radii mark in red. Source: JPL’s Horizons. |
| In the text | |
|
Fig. B.3. Capture episode for 2022 NX1. Top panel: Time evolution of the geocentric eccentricity and distance. Bottom panel: Geocentric eccentricity as a function of the geocentric distance. The one Hill radius mark is shown in pink, the three Hill radii mark in red. Source: JPL’s Horizons. |
| In the text | |
|
Fig. B.4. Capture episode for 2024 PT5. Top panel: Time evolution of the geocentric eccentricity and distance. Bottom panel: Geocentric eccentricity as a function of the geocentric distance. Source: JPL’s Horizons. |
| In the text | |
|
Fig. C.1. Capture episode for 2024 PT5. Top panel: Time evolution of the geocentric energy and distance. Bottom panel: Geocentric energy as a function of the geocentric distance. The green zone signals the region where the definition in Kary & Dones (1996) holds. The unit of energy is such that the unit of mass is 1 M⊙, the unit of distance is 1 au, and the unit of time is one sidereal year divided by 2π. |
| In the text | |
|
Fig. C.2. Short-term evolution and capture episode of 2024 PT5. The panels show the evolution of the values of relevant parameters over the time interval (−150, 150) yr around the current epoch. Top panel: Time evolution of the relative mean longitude. Middle panel: Time evolution of the geocentric energy that focuses on negative values. Bottom panel: Time evolution of the geocentric distance that focuses on values under 0.03 au. The evolution of the nominal orbit is shown in black, those of control orbits with state vectors separated ±1σ from the nominal ones in lime–green, ±2σ in cyan–blue, and ±3σ in fuchsia–crimson. The unit of energy is such that the unit of mass is 1 M⊙, the unit of distance is 1 au, and the unit of time is one sidereal year divided by 2π. The output interval is 0.36525 d. The origin of time is epoch 2460600.5 (2024-Oct-17.0) TDB. |
| In the text | |
|
Fig. D.1. Sum of the squares of the differences in the ordinate from one data point to the next for the light curve of 2024 PT5 obtained with GTC/OSIRIS. The value that produces the least possible scatter is ∼21 min. |
| In the text | |
|
Fig. E.1. Image of 2024 PT5 (center, point source) obtained with TTT1. This image is a combination of a sequence of individual images, each obtained in sidereal tracking mode. The asteroid remains stationary in the combined image because it was tracked and stacked using 2024 PT5 ephemeris data from the MPC website (see text for details). The background stars trail because of 2024 PT5’s motion. The bottom right square shows a magnified view of the point-like source. |
| In the text | |
Current usage metrics show cumulative count of Article Views (full-text article views including HTML views, PDF and ePub downloads, according to the available data) and Abstracts Views on Vision4Press platform.
Data correspond to usage on the plateform after 2015. The current usage metrics is available 48-96 hours after online publication and is updated daily on week days.
Initial download of the metrics may take a while.