Fig. 2
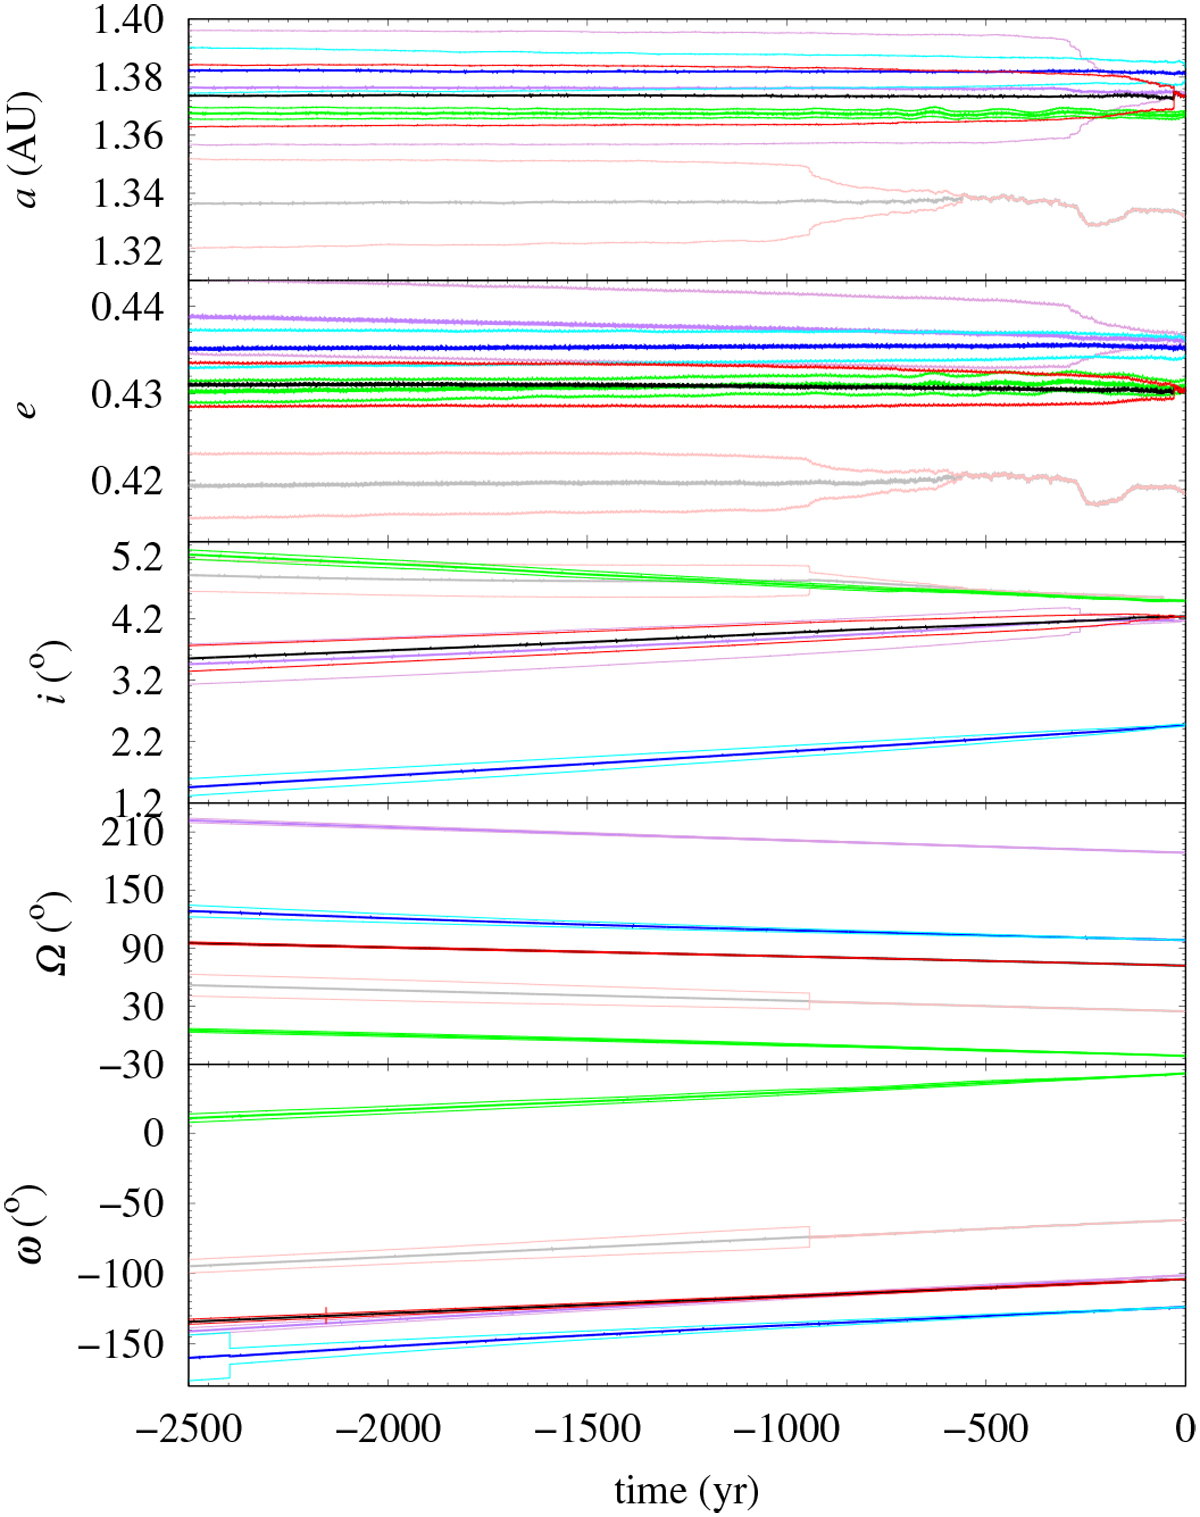
Evolution backwards in time of the dispersions of the values of the orbital elements of (454100) 2013 BO73 (grey/pink), 2016 LR (blue/cyan), 2018 BA5 (green/lime), 2018 TU (purple/lilac), and 2018 LA (black/red): semi-major axis (top panel), eccentricity (second to top panel), inclination (middle panel), longitude of the ascending node (second to bottom panel), and argument of perihelion (bottom panel). Average values are displayed as thick curves and their ranges (1σ uncertainties) as thin curves. This figure shows results for 500 control orbits of each object; initial positions and velocities have been computed using the covariance matrix. The zero-point in time is as in Fig. 1.
Current usage metrics show cumulative count of Article Views (full-text article views including HTML views, PDF and ePub downloads, according to the available data) and Abstracts Views on Vision4Press platform.
Data correspond to usage on the plateform after 2015. The current usage metrics is available 48-96 hours after online publication and is updated daily on week days.
Initial download of the metrics may take a while.