Fig. 4
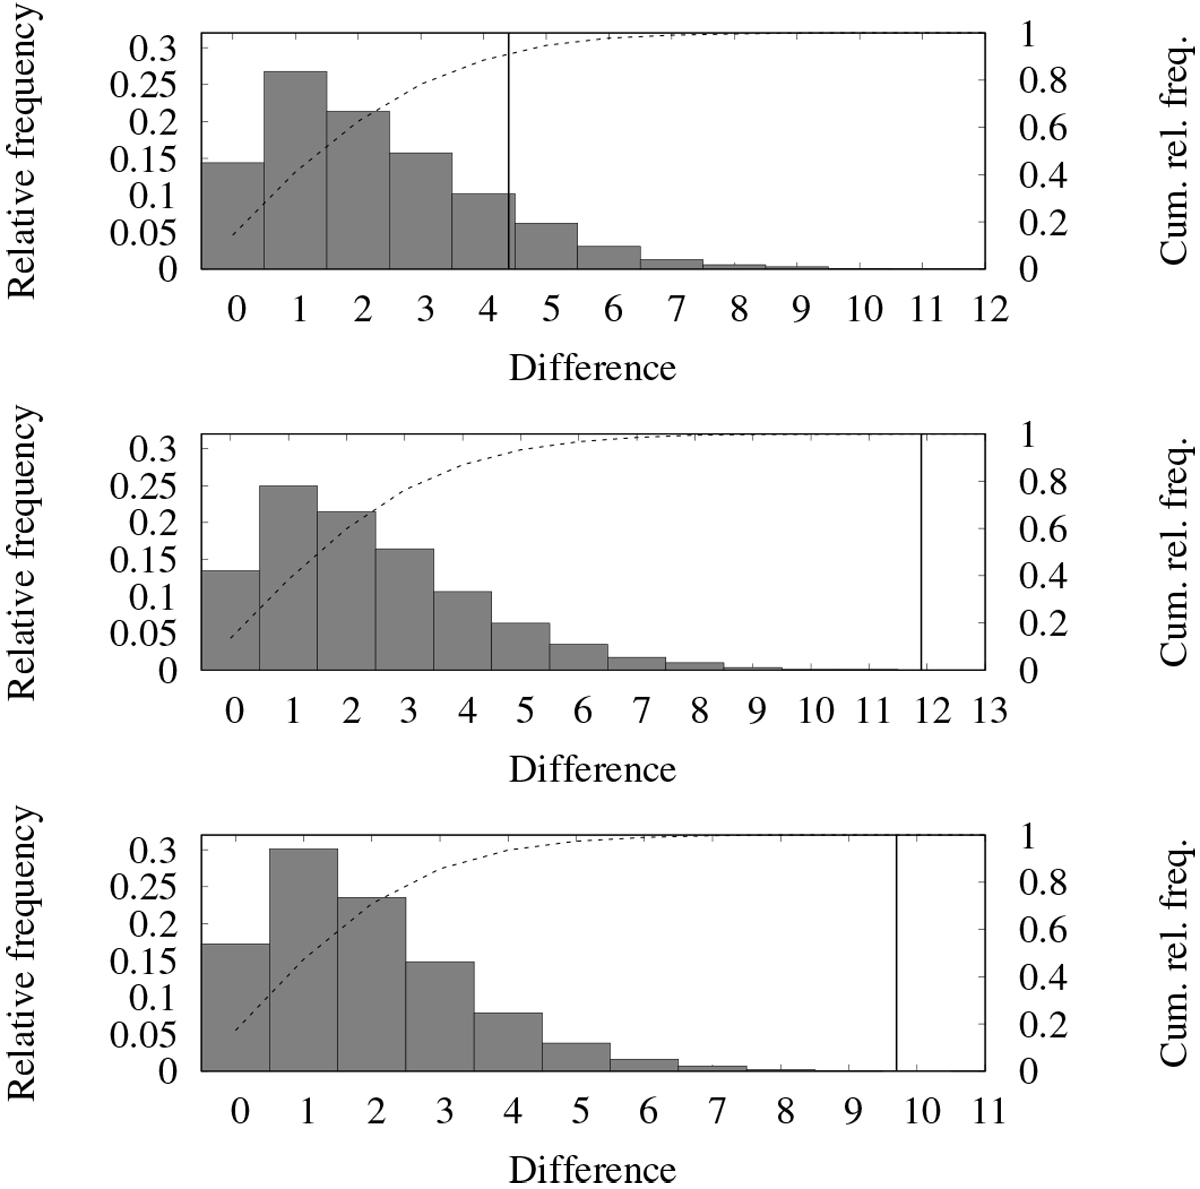
Results of the randomization test described in the text. The observed average differences betwen empirical and synthetic counts are represented by vertical lines. Top panel: results for (454100) 2013 BO73 -like orbits. Middle panel: results for those of 2018 LA-like orbits. Bottom panel: results for those of 2018 UA-like orbits.
Current usage metrics show cumulative count of Article Views (full-text article views including HTML views, PDF and ePub downloads, according to the available data) and Abstracts Views on Vision4Press platform.
Data correspond to usage on the plateform after 2015. The current usage metrics is available 48-96 hours after online publication and is updated daily on week days.
Initial download of the metrics may take a while.