| Issue |
A&A
Volume 621, January 2019
|
|
|---|---|---|
| Article Number | A6 | |
| Number of page(s) | 8 | |
| Section | Stellar atmospheres | |
| DOI | https://doi.org/10.1051/0004-6361/201834171 | |
| Published online | 19 December 2018 | |
Spatially resolving the atmosphere of the non-Mira-type AGB star SW Vir in near-infrared molecular and atomic lines with VLTI/AMBER★,★★
1
Instituto de Astronomía, Universidad Católica del Norte,
Avenida Angamos 0610,
Antofagasta, Chile
e-mail: This email address is being protected from spambots. You need JavaScript enabled to view it.
2
Centre de Recherche en Astronomie, Astrophysique et Géophysique (CRAAG), Route de l’Observatoire, BP 63,
Bouzareah,
16340,
Alger,
Algeria
Received:
31
August
2018
Accepted:
3
November
2018
Abstract
Aims. We present a near-infrared spectro-interferometric observation of the non-Mira-type, semiregular asymptotic giant branch star SW Vir. Our aim is to probe the physical properties of the outer atmosphere with spatially resolved data in individual molecular and atomic lines.
Methods. We observed SW Vir in the spectral window between 2.28 and 2.31 μm with the near-infrared interferometric instrument AMBER at ESO’s Very Large Telescope Interferometer (VLTI).
Results. Thanks to AMBER’s high spatial resolution and high spectral resolution of 12 000, the atmosphere of SW Vir has been spatially resolved not only in strong CO first overtone lines but also in weak molecular and atomic lines of H2O, CN, HF, Ti, Fe, Mg, and Ca. While the uniform-disk diameter of the star is 16.23 ± 0.20 mas in the continuum, it increases up to 22–24 mas in the CO lines. Comparison with the MARCS photospheric models reveals that the star appears larger than predicted by the hydrostatic models not only in the CO lines but also even in the weak molecular and atomic lines. We found that this is primarily due to the H2O lines (but also possibly due to the HF and Ti lines) originating in the extended outer atmosphere. Although the H2O lines manifest themselves very little in the spatially unresolved spectrum, the individual rovibrational H2O lines from the outer atmosphere can be identified in the spectro-interferometric data. Our modeling suggests an H2O column density of 1019–1020 cm−2 in the outer atmosphere extending out to ~2 R⋆.
Conclusions. Our study has revealed that the effects of the nonphotospheric outer atmosphere are present in the spectro-interferometric data not only in the strong CO first overtone lines but also in the weak molecular and atomic lines. Therefore, analyses of spatially unresolved spectra, such as, for example, analyses of the chemical composition, should be carried out with care even if the lines appear to be weak.
Key words: infrared: stars / techniques: interferometric / stars: atmospheres / stars: AGB and post-AGB / stars: mass-loss / stars: individual: SW Vir
Based on AMBER observations made with the Very Large Telescope Interferometer of the European Southern Observatory. Program ID: 092.D-0461(A).
The visibilities are only available at the CDS via anonymous ftp to cdsarc.u-strasbg.fr (130.79.128.5) or via http://cdsarc.u-strasbg.fr/viz-bin/qcat?J/A+A/621/A6
© ESO 2018
1 Introduction
Mass loss in late evolutionary stages of low- and intermediate-mass stars is important not only for the evolution of stars themselves but also for the chemical enrichment of the interstellar medium. In particular, the stars in the asymptotic giant branch (AGB) experience mass loss with mass-loss rates of ~ 10−8 M⊙ yr−1 up to ~ 10−4 M⊙ yr−1. Nevertheless, the mass-loss mechanism in AGB stars is not yet fully understood. The levitation of the atmosphere by the large-amplitude pulsation and the radiation pressure on dust grains are a viable mechanism to drive the mass loss inMira-type AGB stars (e.g., Höfner & Olofsson 2018). However, non-Mira-type AGB stars with semiregular and irregular variability with much smaller variability amplitudes also show noticeable mass loss. At the moment, it is not clear how the mass loss is driven in these non-Mira-type AGB stars. The fact that the number of non-Mira-type AGB stars is comparable to that of Mira stars as mentioned by Ohnaka et al. (2012) highlights the importance of improving our understanding of the mass-loss mechanism in these non-Mira-type AGB stars.
The acceleration of stellar winds in AGB stars is considered to take place within several stellar radii. High spatial resolution achieved by infrared long-baseline interferometry provides an excellent opportunity to spatially resolve this key region and improve our understanding of its physical properties. Taking advantage of the high spatial resolution and high spectral resolution (up to λ ∕Δ λ = 12 000) of the near-infrared interferometric instrument AMBER (Petrov et al. 2007) at ESO’s Very Large Telescope Interferometer (VLTI), we have been studying the outer atmosphere of K–M giants. The VLTI/AMBER observations in the individual CO first overtone lines near 2.3 μm have allowed us to spatially resolve the molecular outer atmosphere–so-called MOLsphere as coined by Tsuji (2000) – and deriveits physical properties such as radius, temperature, and CO column density in three K and M giants, Arcturus (α Boo, K1.5III), Aldebaran (α Tau, K5III), and BK Vir(M7III) (Ohnaka & Morales Marín 2018; Ohnaka 2013; Ohnaka et al. 2012). These studies show that the MOLsphere is extending out to 2–3 R⋆ even in K giants, which cannot be explained by the current hydrostatic photospheric models. The presence of the MOLsphere in K–M giants has also been revealed by infrared interferometric observations with lower spectral resolutions across the molecular bands (instead of individual lines) of CO, H2 O, and TiO (e.g., Quirrenbach et al. 1993; Mennesson et al. 2002; Sacuto et al. 2008, 2013; Martí-Vidal et al. 2011; Arroyo-Torres et al. 2014).
The high spectral resolution of VLTI/AMBER of 12 000 also allows us to probe the atmospheric structure not only with the strong CO lines but also with weaker molecular and atomic lines. They are considered to form in deeper photospheric layers, and therefore high-spectral- and high-spatial-resolution observations in the weak lines provide us with an opportunity to probe the atmospheric layers different from those studied with the CO lines. In this paper, we present the results of a spatially resolved observation of the non-Mira-type AGB star SW Vir in the strong CO first overtone lines as well as in weaker molecular and atomic lines near 2.3 μm.
The M7III star SW Vir is one of the nearby red giants at a distance of  pc (based on a parallax of 6.99 ± 0.83 mas, van Leeuwen 2007). It is a semiregular variable with a period of 150 days, classified as SRB in the General Catalogue of Variable Stars (Samus et al. 2017). The light curve compiled by the American Association of Variable Star Observers (AAVSO) shows a variability amplitude of ~1 mag (from minimum to maximum) in the visible. The mass-loss rate and the expansion velocity of the stellar wind of SW Vir are estimated to be (1.7−9.8) × 10−7 M⊙ yr−1 and 7.5–8.5 km s−1, respectively (Knapp et al. 1998; González Delgado et al. 2003; Winters et al. 2003). Despite its small variability amplitude, the mass-loss rate of SW Vir is comparable to that of some of the optically bright Miras with much larger variability amplitudes (see the samples of Knapp et al. 1998; González Delgado et al. 2003; Winters et al. 2003). The spatially unresolved spectroscopic studies of infrared molecular lines such as CO, H2 O, OH, SiO, and CO2 in SW Vir reveal that they cannot be entirely reproduced by the current photospheric models, suggesting the presence of the MOLsphere (Tsuji 1988, 2008; Tsuji et al. 1994, 1997). Also, Mennesson et al. (2002) found that the L′ -band (3.79 μm) diameter of SW Vir is 1.4 times larger than that in the K′ band (2.13 μm), which can be explained by molecular emission (presumably H2O) from the MOLsphere.
We describe our AMBER observation and data reduction in Sect. 2 and the observational results in Sect. 3. The comparison with the current photospheric models and our modeling of the observed data are presented in Sect. 4, followed by concluding remarks in Sect. 5.
Summary of the VLTI/AMBER observations of SW Vir and the calibrator α Cen A.
2 Observation and data reduction
Our VLTI/AMBER observation of SW Vir took place on 2014 February 11 (UTC) using the Auxiliary Telescope (AT) configuration of B2-C1-D0, which resulted in projected baseline lengths of 9.8, 19.6, and 29.4 m. As in our previous studies, we observed the spectral region between 2.28 and 2.31 μm with a spectral resolution of 12 000 without the VLTI fringe tracker FINITO. A summary of our AMBER observations of SW Vir and its calibrator α Cen A (G2V) is given in Table 1. The calibrator α Cen A was observed five times throughout the night not only for the observation of SW Vir but also for other targets in the program.
The data were reduced with amdlib ver. 3.0.71, which is based on the P2VM algorithm (Tatulli et al. 2007; Chelli et al. 2009). We adopted a uniform-disk diameter of 8.314 ± 0.016 mas for the calibrator α Cen A (Kervella et al. 2003) for the calculation of the transfer function. The interferometric data of SW Vir were calibrated using the transfer function values measured before and after SW Vir. However, using only two measurements before and after SW Vir can underestimate the errors in the transfer function. Therefore, we adopted the standard deviation (1σ) of the transfer function values measured throughout the night as the errors in the transfer function. The atmospheric conditions (seeing and coherence time) were stable throughout the night, which resulted in a very stable transfer function during the night (see Appendix of Ohnaka & Morales Marín 2018). We compared the calibrated interferometric observables–squared visibility amplitude, closure phase (CP), and differential phase (DP)–derived by taking the best 20 and 80% of the frames in terms of the fringe S/N. We took the squared visibility amplitude obtained with the best 20% of the frames, because the errors are smaller than with the best 80%. For the CP and DPs, we took the results with the best 80% because of their smaller errors.
The wavelength calibration was done using the telluric lines observed in the spectrum of α Cen A. The uncertainty in the wavelength calibration is 2.1 × 10⁻⁵ μm, which corresponds to 2.7 km s−1. The observed wavelength scale was converted to the laboratory frame, using the heliocentric velocity of − 15.0 km s−1 of SW Vir (Gontcharov 2006) and the correction for the motion of the observer in the direction of the observation computed with the IRAF2 task rvcorrect. The spectroscopic calibration to correct for the telluric lines and instrumental effects was done using the observed spectrum of α Cen A, as described in Ohnaka et al. (2013).
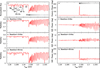 |
Fig. 1 VLTI/AMBER observation of SW Vir in the CO first overtone lines as well as in weak atomic and molecular lines. Panel a: observed spectrum. The identification of some of the lines is shown. Panels b–d: visibilities observed at the baselines of 9.8, 19.6, and 29.4 m, respectively. The typical errors in the visibilities are shown on the left. Panel e: observed closure phase. The typical errors are ~5°. The errorbars are not shown because they would appear too small to recognize in the plot. The ticks show the positions of the CO lines. Panels f–h: differential phases observed at the baselines of 9.8, 19.6, and 29.4 m, respectively. The typical errors at each baseline are as follows: 9.8 m: 0.5°–1° throughout the spectral window. 19.6 m: 0.5°–1° in the continuum and in the CO lines and ~3° at the CO bandhead. 29.4 m: 1°–2° in the continuum, 10°–20° in the CO lines, and ~40° at the CO band head. |
3 Results
The calibrated visibilities, CP, and DPs are shown in Fig. 1. The observed spectrum, plotted in Fig. 1a, shows that the individual CO lines are clearly resolved. The visibilities measured at three baselines show noticeable decrease in the individual CO lines, which means that the star appears larger in the CO lines than in the continuum.
Furthermore, the observed spectrum shows some weak lines shortward of the CO band head at 2.294 μm. We identified them to be the lines of neutral atoms (Mg, Ca, Ti, and Fe) and molecules (CN and HF) by comparing with the high-resolution spectrum of the M8 giant RX Boo presented by Wallace & Hinkle (1996). The observed visibilities, particularly the one obtained at the longest baseline (Fig. 1d), show signatures of these weak lines. It is worth noting that the visibility dips do not necessarily correspond to the lines identified in the spectrum. For example, the visibility dips at 2.2802 and 2.2808 μm (Figs. 1a–c) do not correspond to any clear lines but only to a weak trough in the spectrum (Fig. 1a). This puzzling point will be analyzed in detail in Sect. 4.3.
Figure 2 shows the uniform-disk diameter obtained by fitting the visibilities obtained at three baselines at each wavelength channel. The uniform-disk diameter is 16.23 ± 0.20 mas in the continuum, while it increases up to 22–24 mas (36–48% with respect to the continuum diameter) in the CO band head and strong CO lines. The uniform-disk diameter in the continuum is in agreement with the previous measurements around 2.2 μm (16.81 ± 0.12 mas, Perrin et al. 1998; 16.24 ± 0.06 mas, Mennesson et al. 2002; 15.9 ± 0.6 mas, Mondal & Chandrasekhar 2005). The uniform-disk diameter also increases by ~5% in the weak lines shortward of the CO band head, reflecting the visibility dips described above.
The CP and DPs observed in the individual CO lines show nonzero or non-180° values (Figs. 1e–h), which indicate asymmetry in the outer atmosphere where the CO lines form. Furthermore, as shown in Fig. 3, the visibility observed at the longest baseline of 29.4 m and the DPs measured at all three baselines are asymmetric with respect to the center of the line profile. The visibility minima at the 29.4 m baseline (Fig. 3a) are shifted to the blue wing of the lines. The DPs measured at the 9.8 and 29.4 m show minima in the blue wing and maxima in the red wing. The DP measured at the 19.6 m baseline is also asymmetric with respect to the line center but the asymmetry is much less pronounced compared to the other two baselines.
The asymmetry detected in the visibility and DPs means that the star appears differently across the line profiles. The analysis of the AMBER data of the red supergiants Betelgeuse and Antares shows that inhomogeneous velocity fields can make the star appear differently across the CO line profile (Ohnaka et al. 2009, 2011, 2013). The velocity-field map of Antares reconstructed from the AMBER data indeed reveals inhomogeneous, turbulent motions of large gas clumps (Ohnaka et al. 2017). Therefore, the asymmetry in the visibility and DPs seen in SW Vir suggests that there might be inhomogeneous motions in the CO-line-forming upper photosphere and outer atmosphere.
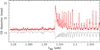 |
Fig. 2 Uniform-disk diameter of SW Vir (red line with the error bars). The scaled observed spectrum is shown with the black solid line. |
4 Modeling of the AMBER data
4.1 Determination of basic stellar parameters
It is necessary to determine basic stellar parameters of SW Vir so that we can specify MARCS photospheric models (Gustafsson et al. 2008)appropriate for this star. We collected photometric data from the visible to the mid-infrared: broadband photometry from the U to K band (Hall 1974; Mermilliod et al. 1987; Ducati 2002; Cutri et al. 2003; Zacharias et al. 2005; Ammons et al. 2006; Kharchenko & Roeser 2009) and the spectrophotometric data of up to 45 μm obtained with the Short-Wavelength Spectrometer (SWS) onboard the Infrared Space Observatory (ISO; Sloan et al. 2003)3. The data were de-reddened with AV = 0.077, which was obtained using the interstellar extinction map presented by Arenou et al. (1992).
The bolometric flux computed by integrating these (spectro) photometric data is 7.0 ×10⁻⁹ W m−2. We estimated the uncertainty in the bolometric flux to be 6% based on the variations in the collected photometric data. Combined with the distance of  pc, this results in a luminosity of 4500 ± 1100 L⊙ (MBOL = − 4.4), which agrees very well with the value obtained by Tsuji (2008). Using the continuum angular diameter of 16.23 ± 0.20 mas, we derived the effective temperatureto be 2990 ± 50 K. This effective temperaturealso agrees with the 2886 ± 100 K obtained byTsuji (2008) using the infrared flux method. We estimated a stellar mass to be 1–1.25 M⊙ based on a comparison with the theoretical evolutionary tracks from Marigo et al. (2013; see also Fig. 13 in Rau et al. 2017) and also from Lagarde et al. (2012). The surface gravity (log g) is then estimated to be − 0.3 ± 0.1.
In addition to these basic stellar parameters, it is necessary to specify the micro-turbulent velocity (vmicro) and chemical composition to select a MARCS model appropriate for SW Vir. We adopted a micro-turbulent velocity of 4 km s−1 based on the analysis of high-resolution spectra of the CO lines (Tsuji 2008). The C, N, and O abundances of SW Vir indicate the mixing of the CN-cycled material (Tsuji 2008). The sum of the C, N, O abundances of SW Vir derived by Tsuji (2008) suggests a solar or slightly subsolar metallicity.
The MARCS model with the parameters closest to the observationally derived values has Teff = 3000 K, log g = 0.0, M⋆ = 1 M⊙, vmicro = 2 km s−1, [Fe/H] = 0.0, and the moderately CN-cycled composition.
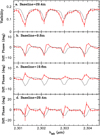 |
Fig. 3 Enlarged view of the visibility obtained at the longest baseline of 29.4 m (panel a) and the differential phases observed at three baselines (panels b–d). In each panel, the interferometric observable (visibility or differential phase) is shown with the red line with the error bars, while the black line represents the scaled observed spectrum. |
4.2 CO first overtone lines
Our previous AMBER observations of the non-Mira-type AGB star BK Vir, very similar to SW Vir, show the presence of an extended component not accounted for by the hydrostatic photospheric models (Ohnaka et al. 2012). However, Arroyo-Torres et al. (2014) show that the AMBER observations of five red giant stars (four stars probably on the AGB and one star on the red giant branch) across the CO bands at 2.3–2.45 μm can be explained by hydrostatic models. Therefore, we first compared the AMBER data observed in the CO first overtone lines with the MARCS model selected for SW Vir. The spectrum and visibility were calculated as describedin Ohnaka (2013), using the CO line list of Goorvitch (1994). We also included lines of H2 O, HF, CN, and atomic lines, which we discuss in more detail in Sect. 4.3, although their contribution is minor compared to the CO lines in the spectral region longward of 2.2936 μm. The spectrum and visibility predicted by the MARCS model are shown by the thin black lines in Fig. 4. Although the observed spectrum is well reproduced (the thin black line is almost entirely overlapping with the blue solid line that we discuss below), the visibilities predicted by the MARCS model are too high compared to the observed data. This is what was observed during our previous studies of K–M giants (Ohnaka et al. 2012; Ohnaka 2013; Ohnaka & Morales Marín 2018). As Ohnaka & Morales Marín (2018) discuss, the negative detection of an extended outer atmosphere by Arroyo-Torres et al. (2014) may be due to the lower spectral resolution of 1500 used in their AMBER observations.
We applied the semi-empirical models that consist of the MARCS photospheric model and additional two CO layers and searched for the best-fit parameters for the CO layers, as described in Ohnaka et al. (2012). Figure 4 shows a comparison of the observed data with the best-fit MARCS+2-layer model (blue solid lines). This model is characterized by the inner CO layer located at 1.3 R⋆ with a CO column density of 2 × 1022 cm−2 and a temperature of 2000 K and the outer CO layer located at 2.0 R⋆ with a CO column density of 1020 cm−2 and a temperature of 1700 K. The model can reasonably reproduce not only the observed spectrum but also the visibilities observed on all three baselines. Also, the model predicts the CP at the band head at 2.2936 μm to be 180°, which roughly agrees with the observed data. This is because the MOLsphere makes the object appear large enough thatthe longest baseline of 29.4 m corresponds to the second visibility lobe, where the phase is 180°.
4.3 Weak molecular and atomic lines
As Fig. 1a shows, the weak lines of CN, HF, Mg, Ti, Ca, and Fe are present shortward of the CO band head. In general, weak lines form in deep layers, where the atmospheric structure is considered to be reasonably described by hydrostatic photospheric models. Therefore, weak molecular and atomic lines are often used for the determination of chemical composition in red giant stars in combination with hydrostatic photospheric models (e.g., Abia et al. 2017; Gałan et al. 2017; Rich et al. 2017; Do et al. 2018; D’Orazi et al. 2018; Thorsbro et al. 2018). Therefore, it is meaningful to see whether the AMBER data in these weak lines can be explained by the photosphere alone without the MOLsphere. We computed the synthetic visibilities and spectrum from the MARCS model, including the lines of 12 C14N and 13 C14N using the line list of Sneden et al. (2014)4, assuming 12 C/13C = 22 (Tsuji 2008). The line data of HF were taken from Jorissen et al. (1992). The atomic line data were taken from Kurucz & Bell (1995)5. We also included 1 H2 16O lines using the list published by Barber et al. (2006)6.
Figure 5 shows a comparison of the AMBER data with the MARCS model (thin black solid lines). The figure shows that the observed spectrum of the weak lines is fairly reproduced. However, the model predicts the visibility dips observed in most of the weak lines to be too small compared to the observed data. It is particularly clearly seen in the data obtained at the longest baseline (Fig. 5d). Furthermore, as mentioned in Sect. 3, the observed visibility dips do not necessarily correspond to the features seen in the spectrum. These results suggest that some molecular or atomic species in the extended MOLsphere may be making the star appear larger also in the weak lines than in the continuum, as in the case of the CO lines.
We found out that the positions of the visibility dips correspond well to the positions of H2 O lines. To check whether or not the H2O lines in the extended outer atmosphere can explain the observed visibility dips, we added H2 O in the best-fit MARCS+2-layer model obtained in Sect. 4.2. Figure 5 shows the spectrum and visibilities predicted by the best-fit model with H2O in the MOLsphere (blue solid lines). The model is characterized with an H2 O column density of 1020 cm−2 in the inner layer and 2 × 1019 cm−2 in the outer layer (other parameters are set the same as the best-fit model with CO alone). Obviously, the visibility dips are much better reproduced not only at the longest baseline but also at the shortest and middle baselines (the offset between the data and the model seen at the middle baseline is due to the uncertainty in the absolute visibility calibration). The identification of the individual rovibrational H2 O lines responsible for the visibility dips is listed in Table 2.
There are still several visibility dips that cannot be reproduced even with the MOLsphere model with H2 O. The visibility dips in the HF lines at 2.2832 and 2.2893 μm as well as the Ti line at 2.2896 μm are much deeper than predicted by the model. This indicates the presence of HF and Ti in the MOLsphere. Nevertheless, it is difficult to confirm it with only one or two lines, and therefore, we refrain from modeling these HF and Ti lines. The visibility dip at 2.2862 μm coincides with a Co line. However, it is very weak in the synthetic spectrum predicted by the MARCS model, and the H2 O or CN lines cannot explain it either. While it is possible thatit indicates the presence of Co in the MOLsphere, it may be affected by the blend of (an) unidentified line(s). Therefore, this feature remains unidentified at the moment.
The presence of H2O in the MOLsphere in non-Mira-type K–M giants is known from the previous spectroscopic analyses (e.g., Tsuji et al. 1997; Tsuji 2001, 2008) and is also revealed by the spectro-interferometric observations at 2–2.45 μm with VLTI/AMBER by Martí-Vidal et al. (2011) and Arroyo-Torres et al. (2014). The resolution of these studies of 1500 was sufficient to resolve the H2 O band but not sufficient to resolve individual H2O lines. The present work is the first study to spatially resolve individual near-infrared H2 O lines originating in the MOLsphere.
It should be noted that the H2O lines originating in the MOLsphere manifest themselves very little in the spectrum (as can be seen when comparing the spectra predicted by the MARCS-only model and MARCS+MOLsphere model in Fig. 5a), although their effects on the visibilities can be clearly recognized. This is explained as follows. As Fig. 6 shows, on the one hand, the spatially resolved synthetic spectrum predicted at the center of the stellar disk (red line) shows the individual H2 O lines in absorption, because we see the cooler MOLsphere in front of the warmer photosphere. On the other hand, the spatially resolved spectrum predicted off the limb of the star (blue line) shows the H2 O lines in emission, because we do not see the warmer radiation from the photosphere in this case (Kirchhoff’s law). The spatially unresolved spectrum is the sum of the spatially resolved spectra over the stellar disk and the extended atmosphere. Therefore, the H2 O lines in absorption are filled in by the emission from the same H2O lines originating in the extended atmosphere, resulting in the spatially unresolved spectrum without conspicuous signatures of the H2 O lines.
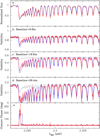 |
Fig. 4 Comparison of the AMBER data obtained in the CO first overtone lines with the MARCS-only model and MARCS+MOLsphere model for SW Vir. Panel a: spectrum. Panels b–d: visibilities observed at the baselines of 9.8, 19.6, and 29.4 m, respectively. Panel e: closure phase. In each panel, the red thick line with the error bars shows the observed data. The thin solid black line represents the MARCS-only model, while the thin solid blue line represents the MARCS+MOLsphere model. In panel a, the black and blue solid lines are almost entirely overlapping. |
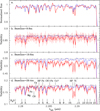 |
Fig. 5 Comparison of the AMBER data obtained in the weak atomic and molecular lines with the MARCS-only model and MARCS+MOLsphere model for SW Vir. Panel a: spectrum. Panels b–d: visibilities observed at the baselines of 9.8, 19.6, and 29.4 m, respectively. In each panel, the red thick line with the error bars shows the observed data. The thin solid black line represents the MARCS-only model, while the thin solid blue line represents the MARCS+MOLsphere model. In panel a, the black and blue solid lines are almost entirely overlapping. In panel d, the ticks in the bottom mark the H2 O lines responsible for the visibility dips. Their identification is listed in Table 2. The ticks indicate the position of the H2 O features seen inthe observed spectrum. As the table shows, they consist of more than one H2 O line in some cases. |
H2O lines identified in the observed visibilities of SW Vir.
5 Concluding remarks
We have spatially resolved the non-Mira-type AGB star SW Vir not only in the CO first overtone lines but also in the weak atomic and molecular lines, taking advantage of the high spatial and spectral resolution of VLTI/AMBER. The AMBER data reveal that the star appears larger than the MARCS photospheric model predicts, not only in the CO first overtone lines but also even in many of the weak atomic and molecular lines observed between 2.28 and 2.294 μm. This new observational result about the weak lines can be explained primarily by the H2 O lines originating in the extended outer atmosphere. Our modeling suggests the presence of H2 O with column densities of 1019 –1020 cm−2 in the outer atmosphere extending to ~2 R⋆. Therefore, our spatially resolved observation of the individual H2 O lines confirms the presence of H2O in the extended molecular atmosphere. An important point is that while the effects of the H2 O lines are clearly visible in the spectro-interferometric data, the H2O lines themselves manifest very little in the spatially unresolved spectrum owing to the filling-in effect. This means that analyses of spatially unresolved spectra of red giants should be carried out with care (e.g., determination of chemical composition), even if the lines appear to be weak.
The recent theoretical modeling of dynamical atmospheres including pulsation and/or convection covers the stellar parameters of relatively cool non-Mira-type AGB stars with Teff≲ 3200, including SW Vir (Bladh et al. 2015; Freytag et al. 2017). It would be of great interest to see whether or not the present spectro-interferometric AMBER data can be explained by these dynamical models.
The MOLsphere parameters of SW Vir derived from the CO first overtone lines are similar to those derived for another M7 giant, BK Vir, by Ohnaka et al. (2012). The basic stellar parameters of BK Vir are very similar to those of SW Vir. Therefore, it is not very surprising that the MOLsphere of two stars is similar, which in turn implies that the MOLsphere parameters might depend on basic stellar parameters. This point will be studied in more detail in a future paper based on the AMBER data that we have obtained for a small sample of red giant stars with spectral types ranging from K1.5 to M8, for most of which no theoretical dynamical models exist yet.
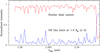 |
Fig. 6 Spatially resolved synthetic spectra of the H2O lines at the stellardisk center (red line) and off the limb at 1.3 R⋆ (blue line). This latter spectrum is scaled by a factor of five for an easier comparison. Both spectra were obtained from the MARCS+MOLsphere model with H2O described in Sect. 4.3 and shown in Fig. 5. |
Acknowledgements
We thank the ESO VLTI team for supporting our AMBER observation. K.O. acknowledges the support of the Comisión Nacional de Investigación Científica y Tecnológica (CONICYT) through the FONDECYT Regular grant 1180066. The present work was also financed by the ALMA-CONICYT Fund, allocated to the project No. 31150002. This research made use of the SIMBAD database, operated at the CDS, Strasbourg, France, and NSO/Kitt Peak FTS data on the Earth’s telluric features produced by NSF/NOAO. We acknowledgewith thanks the variable star observations from the AAVSO International Database contributed by observers worldwide and used in this research.
References
- Abia, C., Hedrosa, R. P., Domínguez, I., & Straniero, O. 2017, A&A, 599, A39 [NASA ADS] [CrossRef] [EDP Sciences] [Google Scholar]
- Ammons, S. M., Robinson, S. E., Strader, J., et al. 2006, ApJ, 638, 1004 [NASA ADS] [CrossRef] [Google Scholar]
- Arenou, F., Grenon, M., & Gómez, A. 1992, A&A, 258, 104 [NASA ADS] [Google Scholar]
- Arroyo-Torres, B., Martí-Vidal, I., Marcaide, J. M., et al. 2014, A&A, 566, A88 [NASA ADS] [CrossRef] [EDP Sciences] [Google Scholar]
- Barber, R. J., Tennyson, J., Harris, G. J., & Tolchenov, R. N. 2006, MNRAS, 368, 1087 [NASA ADS] [CrossRef] [Google Scholar]
- Bladh, S., Höfner, S., Aringer, B., & Eriksson, K. 2015, A&A, 575, A105 [NASA ADS] [CrossRef] [EDP Sciences] [Google Scholar]
- Chelli, A., Hernandez Utrera, O., & Duvert, G. 2009, A&A, 502, 705 [NASA ADS] [CrossRef] [EDP Sciences] [Google Scholar]
- Cutri, R. M., Skrutskie, M. F., Van Dyk, S., et al. 2003, The 2MASS All-Sky Catalog of Point Sources [Google Scholar]
- Do, T., Kerzendorf, W., Konopacky, Q., et al. 2018, ApJ, 855, L5 [NASA ADS] [CrossRef] [Google Scholar]
- D’Orazi, V., Magurno, D., Bono, G., et al. 2018, ApJ, 855, L9 [NASA ADS] [CrossRef] [Google Scholar]
- Ducati, J. R. 2002, ViZieR Online Data Catalog: II/237 [Google Scholar]
- Freytag, B., Liljegren, S., & Höfner, S. 2017, A&A, 600, A137 [NASA ADS] [CrossRef] [EDP Sciences] [Google Scholar]
- Gałan C., Mikołajewska, J., & Hinkle, K. H. 2017, MNRAS, 466, 2194 [NASA ADS] [CrossRef] [Google Scholar]
- Gontscharov, G. A. 2006, Astron. Lett., 32, 759 [NASA ADS] [CrossRef] [Google Scholar]
- González Delgado, D., Olofsson, H., Kerschbaum, F., et al. 2003, A&A, 411, 123 [NASA ADS] [CrossRef] [EDP Sciences] [Google Scholar]
- Goorvitch, D. 1994, ApJS, 95, 535 [NASA ADS] [CrossRef] [Google Scholar]
- Gustafsson, B., Edvardsson, B., Eriksson, K., et al. 2008, A&A, 486, 951 [NASA ADS] [CrossRef] [EDP Sciences] [Google Scholar]
- Hall, R. T. 1974, The Catalogue of 10-micron celestial objects, Report for Space & Missile System Organisation: SAMSO-TR-74, 212 [Google Scholar]
- Höfner, S., & Olofsson, H. 2018, A&ARv 26, 1 [NASA ADS] [CrossRef] [Google Scholar]
- Jorissen, A., Smith, V. V., & Lambert, D. L. 1992, A&A, 261, 164 [NASA ADS] [Google Scholar]
- Kervella, P., Thévenin, F., Ségransan, D., et al. 2003, A&A, 404, 1087 [NASA ADS] [CrossRef] [EDP Sciences] [Google Scholar]
- Kharchenko, N. V., & Roeser, S. 2009, ViZieR Online Data Catalog: I/280 [Google Scholar]
- Knapp, G. R., Young, E., Lee, E., & Jorissen, A. 1998, ApJS, 117, 209 [NASA ADS] [CrossRef] [Google Scholar]
- Kurucz, R. L., & Bell, B. 1995, Atomic Line Data, Kurucz CD-ROM No. 23. Cambridge, Mass.: Smithsonian Astrophysical Observatory [Google Scholar]
- Lagarde, N., Decressin, T., Charbonnel, C., et al. 2012, A&A, 543, A108 [NASA ADS] [CrossRef] [EDP Sciences] [Google Scholar]
- Marigo, P., Bressan, A., Nanni, A., et al. 2013, MNRAS, 434, 488 [NASA ADS] [CrossRef] [Google Scholar]
- Martí-Vidal, I., Marcaide, J. M., Quirrenbach, A., et al. 2011, A&A, 529, A115 [NASA ADS] [CrossRef] [EDP Sciences] [Google Scholar]
- Mennesson, B., Perrin, G., Chagnon, G., et al. 2002, ApJ, 579, 446 [NASA ADS] [CrossRef] [Google Scholar]
- Mermilliod, J. C. 1987, A&AS, 71, 413 [NASA ADS] [Google Scholar]
- Mondal, S., & Chandrasekhar, T. 2005, AJ, 130, 842 [NASA ADS] [CrossRef] [Google Scholar]
- Ohnaka, K. 2013, A&A, 553, A3 [NASA ADS] [CrossRef] [EDP Sciences] [Google Scholar]
- Ohnaka, K., & Morales Marín C. A. L. 2018, A&A, 620, A23 [Google Scholar]
- Ohnaka, K., Hofmann, K.-H., Benisty, M., et al. 2009, A&A, 503, 183 [NASA ADS] [CrossRef] [EDP Sciences] [Google Scholar]
- Ohnaka, K., Weigelt, G., Millour, F., et al. 2011, A&A, 529, A163 [NASA ADS] [CrossRef] [EDP Sciences] [Google Scholar]
- Ohnaka, K., Hofmann, K.-H., Schertl, D., et al. 2012, A&A, 537, A53 [NASA ADS] [CrossRef] [EDP Sciences] [Google Scholar]
- Ohnaka, K., Hofmann, K-.H., Schertl, D., et al. 2013, A&A, 555, A24 [NASA ADS] [CrossRef] [EDP Sciences] [Google Scholar]
- Ohnaka, K., Weigelt, G., & Hofmann, K-.H. 2017, Nature, 548, 310 [NASA ADS] [CrossRef] [Google Scholar]
- Perrin, G., Coudé du Foresto, V., Ridgway, S. T., et al. 1998, A&A, 331, 619 [NASA ADS] [Google Scholar]
- Petrov, R. G., Malbet, F., Weigelt, G., et al. 2007, A&A, 464, 1 [NASA ADS] [CrossRef] [EDP Sciences] [Google Scholar]
- Quirrenbach, A., Mozurkewich, D., Armstrong, J. T., Buscher, D. F., & Hummel, C. A. 1993, ApJ, 406, 215 [NASA ADS] [CrossRef] [Google Scholar]
- Rau, G., Hron, J., Paladini, C., et al. 2017, A&A, 600, A92 [NASA ADS] [CrossRef] [EDP Sciences] [Google Scholar]
- Rich, R. M., Ryde, N., Thorsbro, B., et al. 2017, AJ, 154, 239 [NASA ADS] [CrossRef] [Google Scholar]
- Sacuto, S., Jorissen, A., Cruzalébes, P., et al. 2008, A&A, 482, 561 [NASA ADS] [CrossRef] [EDP Sciences] [Google Scholar]
- Sacuto, S., Ramstedt, S., Höfner, S., et al. 2013, A&A, 551, A72 [NASA ADS] [CrossRef] [EDP Sciences] [Google Scholar]
- Samus, N. N., Kazarovets, E. V., Durlevich, O. V., Kireeva, N. N., Pastukhova, E. N. 2017, Astron. Rep., 61, 80 [NASA ADS] [CrossRef] [Google Scholar]
- Sloan, G. C., Kraemer, K. E., Price, S. D., & Shipman, R. F. 2003, ApJS, 147, 379 [NASA ADS] [CrossRef] [Google Scholar]
- Sneden, C., Lucatello, S., Ram, R. S., Brooke, J. S. A., & Bernath, P. 2014, ApJS, 214, 26 [Google Scholar]
- Tatulli, E., Millour, F., Chelli, A., et al. 2007, A&A, 464, 29 [NASA ADS] [CrossRef] [EDP Sciences] [Google Scholar]
- Thorsbro, B., Ryde, N., Schultheis, M., et al. 2018, ApJ, 866, 52 [NASA ADS] [CrossRef] [Google Scholar]
- Tsuji, T. 1988, A&A, 197, 185 [NASA ADS] [Google Scholar]
- Tsuji, T. 2000, ApJ, 540, L99 [NASA ADS] [CrossRef] [Google Scholar]
- Tsuji, T., 2001, A&A, 376, L1 [NASA ADS] [CrossRef] [EDP Sciences] [Google Scholar]
- Tsuji, T. 2008, A&A, 489, 1271 [NASA ADS] [CrossRef] [EDP Sciences] [Google Scholar]
- Tsuji, T., Ohnaka, K., Hinkle, K. H., & Ridgway, S. T. 1994, A&A, 289, 469 [NASA ADS] [Google Scholar]
- Tsuji, T., Ohnaka K., Aoki, W., & Yamamura, I. 1997, A&A, 320, L1 [NASA ADS] [Google Scholar]
- van Leeuwen, F. 2007, A&A, 474, 653 [NASA ADS] [CrossRef] [EDP Sciences] [Google Scholar]
- Wallace, L., & Hinkle, K. 1996, ApJS, 107, 312 [NASA ADS] [CrossRef] [Google Scholar]
- Winters, J. M., Le Bertre, T., Jeong, K. S., Nyman, L.-Å., & Epchtein, N. 2003, A&A, 409, 715 [NASA ADS] [CrossRef] [EDP Sciences] [Google Scholar]
- Zacharias N., Monet D. G., Levine S. E., et al. 2005, Naval Observatory Merged Astrometric Dataset (NOMAD) [Google Scholar]
IRAF is distributed by the National Optical Astronomy Observatory, which is operated by the Association of Universities for Research in Astronomy (AURA) under a cooperative agreement with the National Science Foundation.
All Tables
All Figures
|
Fig. 1 VLTI/AMBER observation of SW Vir in the CO first overtone lines as well as in weak atomic and molecular lines. Panel a: observed spectrum. The identification of some of the lines is shown. Panels b–d: visibilities observed at the baselines of 9.8, 19.6, and 29.4 m, respectively. The typical errors in the visibilities are shown on the left. Panel e: observed closure phase. The typical errors are ~5°. The errorbars are not shown because they would appear too small to recognize in the plot. The ticks show the positions of the CO lines. Panels f–h: differential phases observed at the baselines of 9.8, 19.6, and 29.4 m, respectively. The typical errors at each baseline are as follows: 9.8 m: 0.5°–1° throughout the spectral window. 19.6 m: 0.5°–1° in the continuum and in the CO lines and ~3° at the CO bandhead. 29.4 m: 1°–2° in the continuum, 10°–20° in the CO lines, and ~40° at the CO band head. |
| In the text | |
|
Fig. 2 Uniform-disk diameter of SW Vir (red line with the error bars). The scaled observed spectrum is shown with the black solid line. |
| In the text | |
|
Fig. 3 Enlarged view of the visibility obtained at the longest baseline of 29.4 m (panel a) and the differential phases observed at three baselines (panels b–d). In each panel, the interferometric observable (visibility or differential phase) is shown with the red line with the error bars, while the black line represents the scaled observed spectrum. |
| In the text | |
|
Fig. 4 Comparison of the AMBER data obtained in the CO first overtone lines with the MARCS-only model and MARCS+MOLsphere model for SW Vir. Panel a: spectrum. Panels b–d: visibilities observed at the baselines of 9.8, 19.6, and 29.4 m, respectively. Panel e: closure phase. In each panel, the red thick line with the error bars shows the observed data. The thin solid black line represents the MARCS-only model, while the thin solid blue line represents the MARCS+MOLsphere model. In panel a, the black and blue solid lines are almost entirely overlapping. |
| In the text | |
|
Fig. 5 Comparison of the AMBER data obtained in the weak atomic and molecular lines with the MARCS-only model and MARCS+MOLsphere model for SW Vir. Panel a: spectrum. Panels b–d: visibilities observed at the baselines of 9.8, 19.6, and 29.4 m, respectively. In each panel, the red thick line with the error bars shows the observed data. The thin solid black line represents the MARCS-only model, while the thin solid blue line represents the MARCS+MOLsphere model. In panel a, the black and blue solid lines are almost entirely overlapping. In panel d, the ticks in the bottom mark the H2 O lines responsible for the visibility dips. Their identification is listed in Table 2. The ticks indicate the position of the H2 O features seen inthe observed spectrum. As the table shows, they consist of more than one H2 O line in some cases. |
| In the text | |
|
Fig. 6 Spatially resolved synthetic spectra of the H2O lines at the stellardisk center (red line) and off the limb at 1.3 R⋆ (blue line). This latter spectrum is scaled by a factor of five for an easier comparison. Both spectra were obtained from the MARCS+MOLsphere model with H2O described in Sect. 4.3 and shown in Fig. 5. |
| In the text | |
Current usage metrics show cumulative count of Article Views (full-text article views including HTML views, PDF and ePub downloads, according to the available data) and Abstracts Views on Vision4Press platform.
Data correspond to usage on the plateform after 2015. The current usage metrics is available 48-96 hours after online publication and is updated daily on week days.
Initial download of the metrics may take a while.