Fig. 1
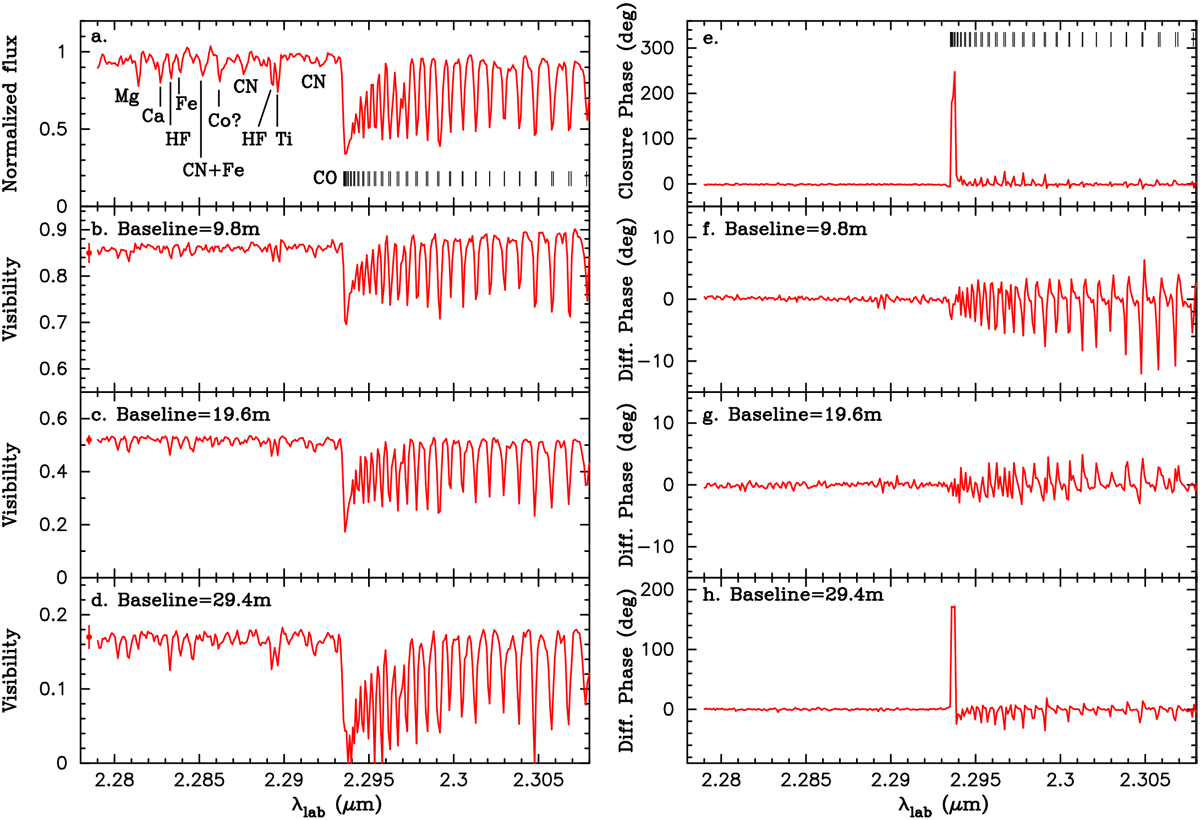
VLTI/AMBER observation of SW Vir in the CO first overtone lines as well as in weak atomic and molecular lines. Panel a: observed spectrum. The identification of some of the lines is shown. Panels b–d: visibilities observed at the baselines of 9.8, 19.6, and 29.4 m, respectively. The typical errors in the visibilities are shown on the left. Panel e: observed closure phase. The typical errors are ~5°. The errorbars are not shown because they would appear too small to recognize in the plot. The ticks show the positions of the CO lines. Panels f–h: differential phases observed at the baselines of 9.8, 19.6, and 29.4 m, respectively. The typical errors at each baseline are as follows: 9.8 m: 0.5°–1° throughout the spectral window. 19.6 m: 0.5°–1° in the continuum and in the CO lines and ~3° at the CO bandhead. 29.4 m: 1°–2° in the continuum, 10°–20° in the CO lines, and ~40° at the CO band head.
Current usage metrics show cumulative count of Article Views (full-text article views including HTML views, PDF and ePub downloads, according to the available data) and Abstracts Views on Vision4Press platform.
Data correspond to usage on the plateform after 2015. The current usage metrics is available 48-96 hours after online publication and is updated daily on week days.
Initial download of the metrics may take a while.