Fig. 5
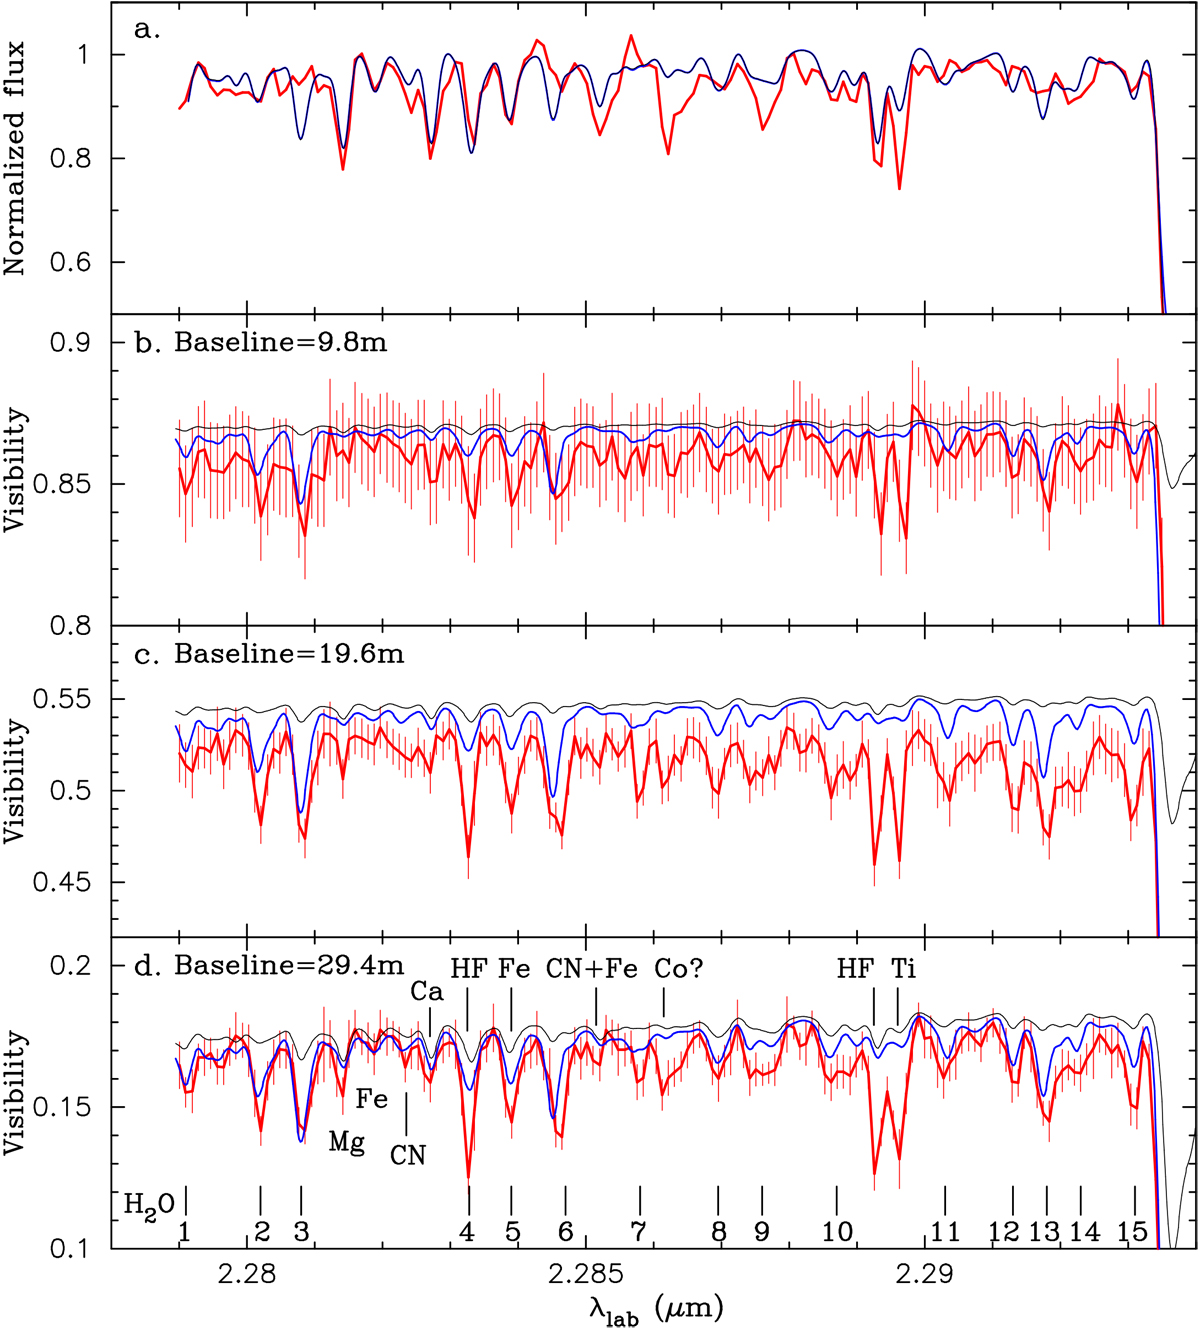
Comparison of the AMBER data obtained in the weak atomic and molecular lines with the MARCS-only model and MARCS+MOLsphere model for SW Vir. Panel a: spectrum. Panels b–d: visibilities observed at the baselines of 9.8, 19.6, and 29.4 m, respectively. In each panel, the red thick line with the error bars shows the observed data. The thin solid black line represents the MARCS-only model, while the thin solid blue line represents the MARCS+MOLsphere model. In panel a, the black and blue solid lines are almost entirely overlapping. In panel d, the ticks in the bottom mark the H2 O lines responsible for the visibility dips. Their identification is listed in Table 2. The ticks indicate the position of the H2 O features seen inthe observed spectrum. As the table shows, they consist of more than one H2 O line in some cases.
Current usage metrics show cumulative count of Article Views (full-text article views including HTML views, PDF and ePub downloads, according to the available data) and Abstracts Views on Vision4Press platform.
Data correspond to usage on the plateform after 2015. The current usage metrics is available 48-96 hours after online publication and is updated daily on week days.
Initial download of the metrics may take a while.