| Issue |
A&A
Volume 621, January 2019
|
|
|---|---|---|
| Article Number | A80 | |
| Number of page(s) | 8 | |
| Section | Atomic, molecular, and nuclear data | |
| DOI | https://doi.org/10.1051/0004-6361/201834130 | |
| Published online | 11 January 2019 | |
Effect of molecular structure on the infrared signatures of astronomically relevant PAHs
1
Sackler Laboratory for Astrophysics, Leiden Observatory, Leiden University, PO Box 9513, 2300 RA Leiden, The Netherlands
e-mail: bouwman@strw.leidenuniv.nl, pablo@strw.leidenuniv.nl
2
Leiden Observatory, Leiden University, PO Box 9513, 2300 RA Leiden, The Netherlands
3
Department of Physics and Astronomy, University of Western Ontario, London ON N6A 3K7, Canada
4
SETI Institute, 189 N. Bernardo Ave, Suite 200, Mountain View, CA 94043, USA
Received:
24
August
2018
Accepted:
6
November
2018
Emission bands from polycyclic aromatic hydrocarbons (PAHs) dominate the mid-infrared spectra of a wide variety of astronomical sources, encompassing nearly all stages of stellar evolution. Despite their similarities, details in band positions and shapes have allowed a classification of PAH emission to be developed. It has been suggested that this classification is in turn associated with the degree of photoprocessing of PAHs. Over the past decade, a more complete picture of the PAH interstellar life-cycle has emerged, in which a wide range of PAH species are formed during the later stages of stellar evolution. After this they are photoprocessed, increasing the relative abundance of the more stable (typically larger and compact) PAHs. For this work we have tested the effect of the symmetry, size, and structure of PAHs on their fragmentation pattern and infrared spectra by combining experiments at the free electron laser for infrared experiments (FELIX) and quantum chemical computations. Applying this approach to the cations of four molecular species, perylene (C20H12), peropyrene (C26H14), ovalene (C32H14) and isoviolanthrene (C34H18), we find that a reduction of molecular symmetry causes the activation of vibrational modes in the 7–9 μm range. We show that the IR characteristics of less symmetric PAHs can help explain the broad band observed in the class D spectra, which are typically associated with a low degree of photoprocessing. Such large, nonsymmetrical irregular PAHs are currently largely missing from the NASA Ames PAH database. The band positions and shapes of the largest more symmetric PAH measured here, show the best resemblance with class A and B sources, representative of regions with high radiation fields and thus heavier photoprocessing. Furthermore, the dissociation patterns observed in the mass spectra hint to an enhanced stability of the carbon skeleton in more symmetric PAHs with respect to the irregular and less symmetric species, which tend to loose carbon containing units. Although not a direct proof, these findings are fully in line with the grandPAH hypothesis, which claims that symmetric large PAHs can survive as the radiation field increases, while their less symmetric counterparts are destroyed or converted to symmetric PAHs.
Key words: methods: laboratory: molecular / ISM: molecules / photon-dominated region / molecular processes
© ESO 2019
1. Introduction
Mid-infrared (mid-IR) emission bands at 3.3, 6.2, 7.7, 8.6, and 11.2 μm are observed toward a large variety of astronomical sources, ranging from star forming regions to the later stages of stellar evolution (Tielens 2008, and references therein). The wavelengths at which the emission occurs are typical for vibrational normal modes of polycyclic aromatic hydrocarbons (PAHs; Leger & Puget 1984; Allamandola et al. 1985). It is now well established that the mid-IR emission bands are emitted by large PAHs, as they relax down to their ground state after being excited by the absorption of interstellar photons (Allamandola et al. 1989). The PAH emission bands, also known as aromatic infrared bands (AIBs), have developed into a valuable diagnostic for probing the local physical conditions in the interstellar medium (ISM), and revealing information about the size distribution, charge state, and possible hetero-atom substitutions in the PAHs themselves (e.g., Joblin et al. 1996; Hudgins et al. 2005; Galliano et al. 2008).
While AIB positions and shapes are rather consistent along different astronomical sources, some variations have been observed. A classification of mid-IR interstellar spectra has been based on such variations, with the different spectral types classified from A to D (Peeters et al. 2002; Matsuura et al. 2014). The classification is mostly based on the shape and position of the bands between 6 and 9 μm; classes A to C show a progressive redshift of the main bands in this range, as well as a blending of the 7.7 and 8.6 μm bands in the case of class C (Peeters et al. 2002). Class D sources show a general shape reminiscent of class C, with no clearly separated 8.6 μm band, but the peak emission in this case is shifted toward shorter wavelengths (Matsuura et al. 2014). As the shifts in peak position are correlated with the effective temperature of the illuminating source, it has been suggested that the different classes are associated with the degree of photoprocessing, with class A corresponding to the most heavily processed material, while classes C and D are associated with either less harsh radiation fields or shorter periods of exposure to interstellar radiation (Sloan et al. 2014).
One particular hypothesis about the photoprocessing of PAHs in the interstellar medium has emerged in recent years. This hypothesis suggests that carbonaceous, very small dust grains (VSGs) are formed in the envelope of evolved stars and, as the interstellar material becomes exposed to high energy photons, these VSGs evaporate, releasing a variety of individual PAHs (Cesarsky et al. 2000; Joblin et al. 2008; Pilleri et al. 2012). Additional processing is expected to lead to only the most stable (large and highly symmetric) PAHs surviving in photodissociation regions (PDRs), in what has been dubbed the grandPAH hypothesis (Andrews et al. 2015; Peeters et al. 2017). Multiphoton events, even in regions where the photon flux is less intense, eventually lead to the destruction of large PAHs (Montillaud et al. 2013). Such destruction has successfully been linked to the formation of fullerenes in close proximity to the illuminating star of PDRs (Berné & Tielens 2012; Castellanos et al. 2014; Berné et al. 2015). Laboratory evidence for this conversion and the chemical pathways involved has also been presented (Zhen et al. 2014a; Bouwman et al. 2015; de Haas et al. 2017).
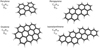 |
Fig. 1. Structures of the four species investigated here shown together with their chemical composition and symmetry point group. |
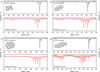 |
Fig. 2. Time-of-flight mass spectra of (A) perylene•+, (B) peropyrene•+, (C) ovalene•+, and (D) isoviolanthrene•+ formed by electron impact ionization (black) displayed together with mass spectra recorded after being resonantly dissociated using three intense infrared radiation pulses from FELIX (red). |
Much effort has been put into the experimental and computational characterization of PAH spectra. Experimental spectra of a large number of species, both small and large, neutral and charged, as well as hetero-atom substituted aromatics have been recorded by means of matrix isolation spectroscopy (e.g., Vala et al. 1994; Hudgins & Sandford 1998; Hudgins et al. 2005; Mattioda et al. 2005). Infrared spectra of PAHs and PAH cations in the gas phase have also been reported (e.g., Joblin et al. 1994; Oomens et al. 2001, 2006). In earlier works we demonstrated that with our instrument for Photoprocessing of PAHs (i-PoP) connected to the free electron laser for infrared experiments (FELIX) we can record infrared multiphoton dissociation (IRMPD) spectra of large aromatic cations up to  (Zhen et al. 2017, 2018). Large sets of density functional theory (DFT) computed normal modes of PAHs have also been reported (e.g., Bauschlicher et al. 2008, 2009; Ricca et al. 2012). Both experimental and computed spectra have been made available through the NASA Ames PAH database (Bauschlicher et al. 2010; Boersma et al. 2014) that has been very successfully applied as a tool to decompose contributions of the various PAH species in interstellar spectra, thereby revealing the chemical evolution of PAHs (Boersma et al. 2013).
In this work, we extend on previous studies by reporting on the infrared spectra of a series of radical cations of aromatic molecules isolated in the gas phase. The focus is on the cations of the intermediately sized PAHs perylene (pery, C20H12), peropyrene (pero, C26H14), ovalene (ova, C32H14), and isoviolanthrene (iso, C34H18) (see Fig. 1). These species are still smaller than those expected to be present in space, but representative for different geometrical structures. These species comprise a carefully selected group of molecules that cover various symmetry point groups as well as degrees of compactness, or irregularity. In particular, pery and ova are highly symmetric and compact PAHs. Pero is symmetric but less compact and iso is both a less symmetric and an irregular PAH. A systematic study of this kind allows us to investigate experimentally the effect of the symmetry and edge topology as well as size on their infrared spectral signatures and dissociation patterns. The astronomical relevance of our findings is discussed in light of the different astronomical classes of observed emission bands.
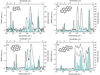 |
Fig. 3. IRMPD spectra of (A) perylene•+, (B) peropyrene•+, (C) ovalene•+ , and (D) isoviolanthrene•+ plotted together with scaled computed spectra (stick diagrams) that have been convolved with a Gaussian line profile with a FWHM of 30 cm−1 to facilitate comparison. The gray line in the spectrum of iso•+ indicates a spectrum measured at reduced FELIX exposure to avoid saturation and thereby attempting to better resolve the vibrational modes. |
2 Methods
2.1. Experimental method
The IR spectra have been recorded on our instrument i-PoP connected to FELIX (Oepts et al. 1995), a free electron laser covering the IR fingerprint region. The experimental apparatus has been described in detail in a prior publication (Zhen et al. 2014b) and here we only provide a brief summary of the relevant experimental details.
A quadrupole ion-trap (QIT) was used that is mounted inside a vacuum chamber pumped down to a base pressure of ∼10−8 mbar. An oven containing the PAH sample (pery, Sigma-Aldrich, ≥99%; pero, Kentax, 99.5%; ova, Kentax, >99.0%; iso, Kentax, >99.5%) in this vacuum chamber is located just under an electron gun. The polyaromatic molecules were brought into the gas phase by gently heating the oven to the temperature required for the specific species, i.e., ∼333, 470, 523, and 533 K for pery, pero, ova, and iso, respectively. We note that our iso sample is the fully aromatic species of C34H18 composition shown in Fig. 1, while in the literature isoviolanthrene is commonly mistakenly denoted as C34H20, which has two aliphatic sites. Cations were generated by means of electron impact ionization with 85 eV electrons. The formed ions were guided into the QIT using electrostatic lenses. Ions were accumulated for a period of 1.5 s for each cycle.
The ions were trapped in the 1 MHz, 2450 Vt–t electric field that is supplied to the ring electrode of the QIT. The stored waveform inverse Fourier transform (SWIFT) technique was applied to isolate the parent ion. A time-of-flight (TOF) mass spectrum was measured by supplying a high voltage pulse of –800 V and +800 V to the extractor and repeller endcaps, respectively, ejecting the ions into a reflectron type mass spectrometer. Time zero was defined by the high voltage pulse and the flight time to the Z-gap MCP detector was measured. Helium was introduced to the trap assembly at a pressure of ∼10−6 mbar to cool the ion cloud and reduce its size and thus improve the mass resolution, which amounts to m/Δm ≈ 1100.
Spectra were recorded by means of infrared multiphoton dissociation spectroscopy using the intense and tunable radiation of FELIX. The laser was operated at a repetition rate of 10 Hz with a macropulse duration of 6 μs and pulse energies up to 80 mJ per macropulse. The radiation was focused onto the ion cloud through a KBr window that provides the vacuum seal. A mechanical shutter was placed on an optical table outside the vacuum chamber to allow for selection of the number of free electron laser (FEL) pulses used. The optics and shutter were placed in a purge box that was flushed with dry nitrogen to prevent absorption of infrared radiation. Dissociation of the molecule was induced when the light from FELIX was tuned to a vibrational resonance of the trapped ion.
A spectrum was obtained by recording the dissociation yield of the trapped ion as a function of wavelength. To calculate the dissociation yield, a Pearson IV function was fitted to each mass peak observed in every recorded mass spectrum in order to extract the intensity of each peak. The yield itself was calculated by dividing the added intensity of all the fragments by the total intensity (fragment intensity plus parent intensity). The laser was tuned from 600 to 1700 cm−1 in steps of 3 cm−1 and an average of ten mass spectra was recorded at each photon energy. Typically, the ion cloud was exposed to three FEL macropulses, but experiments on iso•+ were also performed using one FEL pulse to prevent saturation (100% dissociation) from occurring. Power scans were performed at the end of each experiment to allow for a first-order correction of the dissociation yield to the power emitted by FELIX and a typical power curve is shown in the appendices. We note that IRMPD has a nonlinear intensity response.
2.2. Computational method
Infrared spectra for the four species studied here were simulated using quantum chemical computations that were performed with the Gaussian~09 suite of programs (Frisch et al. 2009). Molecular structures were optimized at the B3LYP/6-311G(d,p) level of theory and the resulting 0 K harmonic frequencies were scaled using a uniform scaling factor of 0.965 (Andersson & Uvdal 2005). The scaled vibrational normal modes were convolved with a Gaussian line profile with a 30 cm−1 full-width-at-half-maximum (FWHM) to facilitate a good comparison with the measured IRMPD spectra. This convolution accounts for the temperature effects resulting from the IRMPD excitation process.
3. Results
The black traces in Fig. 2 show the off-resonance TOF mass spectra of each of the studied species, while the red traces show the mass spectra recorded after the cations in the QIT have been exposed to three FEL macropulses at a resonant photon energy. Dissociation of the parent cations is very efficient for all species, yet differences are apparent in the dissociation patterns. The dissociation and stability of aromatics is strongly associated with their respective heat capacity (and thus size). When comparing the two largest species, ova•+ and iso•+, their dissociation patterns are strikingly different given their similar sizes. The compact and symmetric species ova•+ loses up to ten hydrogen atoms while retaining all of its carbon atoms. In contrast, the mass spectrum of the irregular iso•+ reveals a similar loss of H atoms but also a channel in which carbon loss is important – likely in the form of C2H2 – either preceding or following H-loss. Small PAHs such as pero•+ and pery•+ are known to incur C2H2-losses before full dehydrogenation has completed (Ekern et al. 1998), although these are weaker than for isoviolanthrene. Thus, it seems that the carbon backbone of symmetric and regular large PAHs is more resilient against fragmentation, while the less symmetric, large irregular PAHs as well as small PAHs shed C2H2 units. This observation is in agreement with findings reported earlier (Ekern et al. 1998; Zhen et al. 2018).
Mass spectra such as those shown in Fig. 2 are recorded as a function of infrared wavelength to produce an IR spectrum. The PAH dissociation yield is determined for each of the mass spectra and infrared action spectra are obtained by plotting the dissociation yield as a function of photon energy. The resulting IRMPD spectra are shown in Figs. 3A–D. Many of the experimentally measured bands can still be (partly) resolved, despite the fact that the IRMPD method inherently results in broad bands. The spectrum of iso•+ (Fig. 3D) is close to saturation (i.e. the point where 100% of the parent ion in the trap dissociates) in the range between 1150 and 1350 cm−1 and appears to be the least resolved of all the IR measured spectra. In an attempt to resolve these bands, this spectrum was also recorded at a reduced FEL exposure (one macro pulse exposure per trap fill). This measurement is overlaid in light gray in Fig. 3D and exhibits the same features as the spectrum exposed to three FEL pulses. We expect that we did not run into saturation effects, based on a comparison of dissociation yields for the different FEL pulse exposures. However, although not expected, it is possible that the FELIX beam does not cover the full ion cloud, as the beam is tightly focused and the ions in the cloud make a secular motion. In that case the intensity ratios may be affected by saturation, but as stated earlier, given the nonlinear response of IRMPD, the intensity information should anyway be judged with care.
In Fig. 3 we also show the computed vibrational normal modes, scaled uniformly to account for anharmonic effects. The computed modes are represented both as sticks and as a spectrum that is the result of a convolution of the sticks with a Gaussian line profile of 30 cm−1 FWHM. Generally there is reasonably good agreement between the IRMPD measured spectrum and the computed (convolved) data. The strongest computed modes are all represented in the experimental spectrum. Experimental band positions are extracted by fitting the IRMPD spectrum using an unconstrained multiple Gaussian fit procedure and the resulting band positions are compared to the (scaled) computed modes in the appendices. The match between calculated and experimental peak position is generally within 10 cm−1, but deviations of up to 20 cm−1 are apparent in the more crowded parts of the spectra. While the peak positions are generally reasonably well reproduced, the match between computed and measured intensities is not so good. As stated already, this is a common drawback of IRMPD spectroscopy and is caused by the fact that it relies on a nonlinear physical process, and the applied first-order power correction only partially accounts for this effect.
As expected, the spectra of the four radical cations are clearly different in the 600–1000 cm−1 range, which involves CH-out-of-plane (CHoop) vibrations. Perylene has four sets of trio hydrogens and CHoop modes are observed at 729 and 794 cm−1 belonging to the same symmetry group, but differing in the motion relative to the carbon skeleton. Peropyrene has two trios and four duos. The infrared spectrum below 1000 cm−1 reduces to an intense mode shifted to higher energy that involves the trio CHoop beating in phase with the CHoop motion of the duos and a weaker band to the red. Ovalene has six duos and two solos and displays two strong modes that are clearly visible. The first is located at 831 cm−1 and involves an out of phase motion of the CHoop duos and CHoop solos. The second band is observed at 891 cm−1 and involves mostly an out of plane motion of the solo hydrogens. Isoviolanthrene, like pero, has four duos, but now combined with two quatros and two solos. Only one vibration is observed at 739 cm−1 that contains contributions by the quatro CHoop mode beating out of phase with the solo CHoop and the quatro mode beating in phase with the duo CHoop mode.
A striking difference can be found when comparing the four spectra in Fig. 3 in the range from 1000 to 1600 cm−1, which contains the CH in plane modes, as well as the aromatic C=C stretch modes. Generally, it appears that the spectra of the more regular molecules with higher symmetry (i.e., pery, pero, ova) are better resolved than that of the molecule with the lowest symmetry (iso). The main bands of pery•+, pero•+ and ova•+ are pronounced and centered around 1200 cm−1 (8.33 μm), 1300 cm−1 (7.70 μm) and 1550 cm−1 (6.45 μm), while iso•+ reveals two much broader (blended) features ranging from 1100–1400 cm−1 and 1400–1600 cm−1. The denser spectrum is a direct result of the lower symmetry, which causes more infrared modes to be active in this spectral range.
4. Astrophysical implications
In order to assess the significance of the aforementioned differences between the experimental spectra and their relation to molecular geometry and symmetry, we focus on a comparison with astronomical spectra, particularly based on the mid-IR spectral types (Peeters et al. 2002; Matsuura et al. 2014). The top panel in Fig. 4 shows astronomical spectra representative for each of the classes (A–D) in the 6–10 μm range. This range is most commonly used to classify the interstellar and circumstellar PAH emission and, furthermore, it is dominated by emission from ionized PAHs (Allamandola et al. 1999), which allows for a better comparison with the molecules studied here.
The lower panel in Fig. 4 shows the experimental spectra in the 6–10 μm range for iso•+, ova•+, pero•+, and pery•+. The molecules show a progression in the bands between 7 and 9 μm. The mode at 8.6 μm in ova•+, which overlaps with the interstellar 8.6 μm feature, is absent in the spectrum of pery•+ and pero•+. The same variation is observed in the computed spectra, as seen in Fig. 3. In the past, the interstellar 8.6 μm emission band position has been attributed to emission by large compact PAHs (Bauschlicher et al. 2008). The data shown here confirm this spectral change with PAH size, albeit on a limited set of experimentally measured spectra.
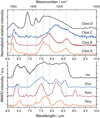 |
Fig. 4. Top panel: mid-IR spectra of astronomical sources illustrating examples of type~D (IRAS 05110–6616; black), type C (IRAS 13416-6243; blue), type~B (HD 44179; red), and type A (IRAS 23133+6050; orange), all normalized to the maximum intensity of the 7–8 μm complex and with continuum subtracted. The type D spectrum was recorded by Spitzer/IRS (Werner et al. 2004; Houck et al. 2004), while the others are from ISO/SWS (Kessler et al. 1996; de Graauw et al. 1996), as calibrated by Sloan et al. (2003). Bottom panel: IRMPD spectra of pery•+ (orange), pero•+ (red), ova•+ (blue), and iso•+ (black) in the 6–10 μm spectral range. |
The spectrum of the largest and most irregular PAH in our data set, iso•+, is clearly different from the other spectra. Iso•+ has the lowest symmetry of the molecules measured here and therefore has a larger number of IR active modes in the 7.0–9.0 μm range. In this range, its spectrum appears most like the class D spectra, exhibiting a broad distribution and a peak emission toward 7.6 μm, rather than distinct AIBs bands (as in class A and B) or broad emission peaking beyond 8 μm (as in class C). The DFT calculations show that, in contrast to more symmetric PAHs, even the strong band around 7.6 μm in iso•+ is a blend of a large number of bands. Such characteristics appear to support the idea that – in addition to regular PAH species – highly irregular PAHs also contribute to the spectra of class~D sources. However, this must be considered with care given the limited data sample reported here, and will have to be explored further, also as IRMPD fails to resolve the many vibrational bands in this region and poorly reflects intensity ratios. Large irregular and less symmetric PAHs, however, are expected to show a broad range of peaks in the 7–9 μm range that are molecule specific. A wide family of such PAHs – likely combined with regular PAH species – will then lead to a broad feature observed in the class D spectrum. The dominance of 7.6 and 7.8 μm bands in the interstellar spectrum then points to a weeding out of this family and/or a conversion of the irregular species to the most stable (compact) PAHs toward class A and B sources.
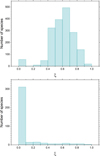 |
Fig. 5. Histograms showing the occurrence of PAHs with irregularity parameter ξ in the NASA Ames PAH database. Top panel: occurrence of PAHs of a certain irregularity parameter considering only small PAHs (defined as NC ≤ 34), while the bottom panel shows that for large PAHs (with NC > 34). The irregularity parameter is defined in Eq. (1). |
In order to put our results in a further astrochemical context, we perused the NASA Ames PAH database to investigate whether it contains large, irregular and thus less symmetric PAHs. To this end, we characterized the irregularity of PAHs in the database by defining the irregularity parameter, ξ, according to the equation:
where Ni denotes the number of hydrogen atoms in an i position. Histograms are constructed based on this parameter and are shown in Fig. 5 for NC ≤ 34 and NC > 34 and from these plots it is obvious that irregular PAHs of astronomically relevant sizes are currently underrepresented in the database. This may in turn affect the selected population for database fits to class C and D spectra in particular, as the additional IR activity in the 6–9 μm band of large irregular PAHs would be beneficial in fitting these spectra.
To investigate the bearings that the lack of large irregular PAHs may have on the interpretation of database fits, we performed a database fit on the computed isoviolanthrene cation spectrum (see appendices). PAHs of all charge states, sizes and degrees of irregularity (ξ) need to be included to fit the spectrum, while if similar large and irregular species were to be present, one would expect the fit to include preferentially molecules with similar characteristics as those of isoviolanthrene. Based on the work presented here, we conclude that it may be beneficial to include more large irregular PAH species in the existing database. This would reduce the risk of a bias and could particularly help establish a more reliable interpretation of the class C and D spectra.
The experimental spectra presented here suggest that type C and D sources can have significant contributions of (highly) irregular PAHs. This result lines up with the suggestion that the degree of photoprocessing of PAHs increases when transitioning from type C or D to type A sources (Sloan et al. 2014). The abundance of small PAHs and irregular PAHs (e.g., iso•+) is expected to decrease in type B and A sources as they get photoconverted by C2H2 loss to more symmetric PAHs, while symmetric and stable PAHs (e.g., ova•+) can survive in such environments as suggested in the grandPAH hypothesis. This structural evolution of PAHs is further supported by AIB fits using the NASA Ames PAH database on the evolution of spectral variations within a single source (Boersma et al. 2013). The photodissociation patterns shown in Fig. 2 lend additional evidence to the decrease in stability of the carbon structure of (highly) irregular PAHs, with respect to the more symmetric ones. The experimental data reported here are in line with the hypothesis of only grandPAHs surviving in regions with high radiation fields and the evolution of the interstellar mid-IR spectra with increased exposure to strong UV fields (Andrews et al. 2015; Peeters et al. 2017). The data presented here involve a rather restricted subset of PAHs and general findings should, therefore, be considered with care. However, these data offer a good starting point for future work and additional studies will be conducted to confirm or refine the conclusions presented here.
Acknowledgments
JB acknowledges the Netherlands Organisation for Scientific Research (Nederlandse Organisatie voor Wetenschappelijk Onderzoek, NWO) for a VIDI grant (grant number 723.016.006). AGGMT acknowledges support through the Spinoza premie of NWO. MB acknowledges the European Union (EU) and Horizon 2020 funding awarded under the Marie Skłodowska-Curie action to the EUROPAH consortium (grant number 722346). This work was supported by NWO Exact and Natural Sciences for the use of supercomputer facilities (grant number 16638). The authors gratefully thank the staff at FELIX for their local support and Dr. Junfeng Zhen for construction and commissioning of the i-PoP apparatus.
Appendix A: Power calibration
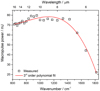 |
Fig. A.1. A typical FEL power curve shown together with a third-order polynomial fit to the data. |
Mass spectra are recorded as a function of photon energy and the IRMPD spectra are constructed from these data by plotting the fragment yield as a function of wavelength. The fragment yield is corrected for the power emitted by the free electron laser. The power curve that was obtained after the measurement of the spectrum of iso•+ was finished is shown in Fig. A.1. This is a typical power curve and is representative for all other curves measured after recording the pery•+, pero•+, or ova•+ spectra. Also shown in Fig. A.1 is a third-order polynomial fit to the data (in red), that is used for a first-order correction of the fragment yield.
Appendix B: Experimental band fits and density functional theory results
Experimental band positions are extracted by fitting the IRMPD spectrum using multiple Gaussian line profiles. The number of Gaussian line profiles used for the fit is based on a visual inspection of the experimental data, rather than by using the computed spectra as an input, as to make the fit as unbiased as possible. The results of the fitting procedure are shown in Fig. B.1 and the extracted band positions are shown in Tables B.1–B.4. Also shown in these tables are the DFT computed (scaled) band positions, their intensities and the symmetries corresponding to the different modes.
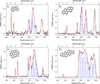 |
Fig. B.1. IRMPD spectra of (A) perylene•+, (B) peropyrene•+, (C) ovalene•+, and (D) isoviolanthrene•+ plotted together with Gaussian profiles that are fitted to determine the band positions of the measured IR absorptions. |
Perylene•+
Peropyrene•+
Ovalene•+
Isoviolanthrene•+
References
- Allamandola, L. J., Tielens, A. G. G. M., & Barker, J. R. 1985, ApJ, 290, L25 [NASA ADS] [CrossRef] [Google Scholar]
- Allamandola, L. J., Tielens, A. G. G. M., & Barker, J. R. 1989, ApJS, 71, 733 [NASA ADS] [CrossRef] [Google Scholar]
- Allamandola, L. J., Hudgins, D. M., & Sandford, S. A. 1999, ApJ, 511, L115 [NASA ADS] [CrossRef] [PubMed] [Google Scholar]
- Andersson, M. P., & Uvdal, P. 2005, JPCA, 109, 2937 [Google Scholar]
- Andrews, H., Boersma, C., Werner, M. W., et al. 2015, ApJ, 807, 99 [NASA ADS] [CrossRef] [Google Scholar]
- Bauschlicher, C. W. Jr., Peeters, E., & Allamandola, L. J. 2008, ApJ, 678, 316 [NASA ADS] [CrossRef] [Google Scholar]
- Bauschlicher, C. W. Jr., Peeters, E., & Allamandola, L. J. 2009, ApJ, 697, 311 [NASA ADS] [CrossRef] [Google Scholar]
- Bauschlicher, C. W. Jr., Boersma, C., Ricca, A., et al. 2010, ApJS, 189, 341 [NASA ADS] [CrossRef] [Google Scholar]
- Berné, O., & Tielens, A. G. G. M. 2012, PNAS, 109, 401 [CrossRef] [Google Scholar]
- Berné, O., Montillaud, J., & Joblin, C. 2015, A&A, 577, A133 [NASA ADS] [CrossRef] [EDP Sciences] [Google Scholar]
- Boersma, C., Bregman, J. D., & Allamandola, L. J. 2013, ApJ, 769, 117 [NASA ADS] [CrossRef] [Google Scholar]
- Boersma, C., Bauschlicher, C. W. Jr., Ricca, A., et al. 2014, ApJS, 211, 8 [NASA ADS] [CrossRef] [Google Scholar]
- Bouwman, J., Sztray, B., Oomens, J., Hemberger, P., & Bodi, A. 2015, JPCA, 119, 1127 [NASA ADS] [CrossRef] [Google Scholar]
- Castellanos, P., Berné, O., Sheffer, Y., Wolfire, M. G., & Tielens, A. G. G. M. 2014, ApJ, 794, 83 [NASA ADS] [CrossRef] [Google Scholar]
- Cesarsky, D., Lequeux, J., Ryter, C., & Gérin, M. 2000, A&A, 354, L87 [Google Scholar]
- de Graauw, T., Haser, L. N., Beintema, D. A., et al. 1996, A&A, 315, L49 [NASA ADS] [Google Scholar]
- de Haas, A. J., Oomens, J., & Bouwman, J. 2017, PCCP, 19, 2974 [NASA ADS] [CrossRef] [Google Scholar]
- Ekern, S. P., Marshall, A. G., Szczepanski, J., & Vala, M. 1998, JPCA, 102, 3498 [Google Scholar]
- Frisch, M., Trucks, G., Schlegel, H. B., et al. 2009, Gaussian 09, Revision A. 02 (Wallingford, CT: Gaussian Inc.) 19, 227 [Google Scholar]
- Galliano, F., Madden, S. C., Tielens, A. G. G. M., Peeters, E., & Jones, A. P. 2008, ApJ, 679, 310 [NASA ADS] [CrossRef] [Google Scholar]
- Houck, J. R., Roellig, T. L., van Cleve, J., et al. 2004, ApJS, 154, 18 [NASA ADS] [CrossRef] [Google Scholar]
- Hudgins, D. M., & Sandford, S. A. 1998, JPCA, 102, 344 [NASA ADS] [CrossRef] [Google Scholar]
- Hudgins, D. M., Bauschlicher, C. W. Jr., & Allamandola, L. J. 2005, ApJ, 632, 316 [NASA ADS] [CrossRef] [EDP Sciences] [Google Scholar]
- Joblin, C., D’Hendecourt, L., Leger, A., & Defourneau, D. 1994, A&A, 281, 923 [Google Scholar]
- Joblin, C., Tielens, A. G. G. M., Geballe, T. R., & Wooden, D. H. 1996, ApJ, 460, L119 [NASA ADS] [CrossRef] [Google Scholar]
- Joblin, C., Szczerba, R., Berné, O., & Szyszka, C. 2008, A&A, 490, 189 [NASA ADS] [CrossRef] [EDP Sciences] [Google Scholar]
- Kessler, M. F., Steinz, J. A., Anderegg, M. E., et al. 1996, A&A, 315, L27 [NASA ADS] [Google Scholar]
- Leger, A., & Puget, J. L. 1984, A&A, 137, L5 [Google Scholar]
- Matsuura, M., Bernard-Salas, J., Lloyd Evans, T., et al. 2014, MNRAS, 439, 1472 [NASA ADS] [CrossRef] [Google Scholar]
- Mattioda, A. L., Hudgins, D. M., Bauschlicher, C. W., & Allamandola, L. J. 2005, Adv. Space Res., 36, 156 [NASA ADS] [CrossRef] [Google Scholar]
- Montillaud, J., Joblin, C., & Toublanc, D. 2013, A&A, 552, A15 [NASA ADS] [CrossRef] [EDP Sciences] [Google Scholar]
- Oepts, D., van der Meer, A. F. G., & van Amersfoort, P. W. 1995, Infrared Phys. Technol., 36, 297 [NASA ADS] [CrossRef] [Google Scholar]
- Oomens, J., Meijer, G., & von Helden, G. 2001, JPCA, 105, 8302 [Google Scholar]
- Oomens, J., Sartakov, B. G., Meijer, G., & von Helden, G. 2006, IJMS, 254, 1 [Google Scholar]
- Peeters, E., Hony, S., Van Kerckhoven, C., et al. 2002, A&A, 390, 1089 [NASA ADS] [CrossRef] [EDP Sciences] [Google Scholar]
- Peeters, E., Bauschlicher, C.W. Jr., Allamandola, L. J., et al. 2017, ApJ, 836, 198 [NASA ADS] [CrossRef] [Google Scholar]
- Pilleri, P., Montillaud, J., Berné, O., & Joblin, C. 2012, A&A, 542, A69 [NASA ADS] [CrossRef] [EDP Sciences] [Google Scholar]
- Ricca, A., Bauschlicher, C. W. Jr., Boersma, C., Tielens, A. G. G. M., & Allamandola, L. J. 2012, ApJ, 754, 75 [NASA ADS] [CrossRef] [Google Scholar]
- Sloan, G. C., Kraemer, K. E., Price, S. D., & Shipman, R. F. 2003, ApJS, 147, 379 [NASA ADS] [CrossRef] [Google Scholar]
- Sloan, G. C., Lagadec, E., Zijlstra, A. A., et al. 2014, ApJ, 791, 28 [NASA ADS] [CrossRef] [Google Scholar]
- Tielens, A. G. G. M. 2008, ARA&A, 46, 289 [NASA ADS] [CrossRef] [EDP Sciences] [Google Scholar]
- Vala, M., Szczepanski, J., Pauzat, F., et al. 1994, JPC, 98, 9187 [CrossRef] [Google Scholar]
- Werner, M. W., Roellig, T. L., Low, F. J., et al. 2004, ApJS, 154, 1 [NASA ADS] [CrossRef] [Google Scholar]
- Zhen, J., Castellanos, P., Paardekooper, D. M., Linnartz, H., & Tielens, A. G. G. M. 2014a, ApJ, 797, L30 [NASA ADS] [CrossRef] [Google Scholar]
- Zhen, J., Paardekooper, D. M., Candian, A., Linnartz, H., & Tielens, A. G. G. M. 2014b, CPL, 592, 211 [Google Scholar]
- Zhen, J., Castellanos, P., Bouwman, J., Linnartz, H., & Tielens, A. G. G. M. 2017, ApJ, 836, 28 [NASA ADS] [CrossRef] [Google Scholar]
- Zhen, J., Candian, A., Castellanos, P., et al. 2018, ApJ, in press [Google Scholar]
All Tables
All Figures
|
Fig. 1. Structures of the four species investigated here shown together with their chemical composition and symmetry point group. |
| In the text | |
|
Fig. 2. Time-of-flight mass spectra of (A) perylene•+, (B) peropyrene•+, (C) ovalene•+, and (D) isoviolanthrene•+ formed by electron impact ionization (black) displayed together with mass spectra recorded after being resonantly dissociated using three intense infrared radiation pulses from FELIX (red). |
| In the text | |
|
Fig. 3. IRMPD spectra of (A) perylene•+, (B) peropyrene•+, (C) ovalene•+ , and (D) isoviolanthrene•+ plotted together with scaled computed spectra (stick diagrams) that have been convolved with a Gaussian line profile with a FWHM of 30 cm−1 to facilitate comparison. The gray line in the spectrum of iso•+ indicates a spectrum measured at reduced FELIX exposure to avoid saturation and thereby attempting to better resolve the vibrational modes. |
| In the text | |
|
Fig. 4. Top panel: mid-IR spectra of astronomical sources illustrating examples of type~D (IRAS 05110–6616; black), type C (IRAS 13416-6243; blue), type~B (HD 44179; red), and type A (IRAS 23133+6050; orange), all normalized to the maximum intensity of the 7–8 μm complex and with continuum subtracted. The type D spectrum was recorded by Spitzer/IRS (Werner et al. 2004; Houck et al. 2004), while the others are from ISO/SWS (Kessler et al. 1996; de Graauw et al. 1996), as calibrated by Sloan et al. (2003). Bottom panel: IRMPD spectra of pery•+ (orange), pero•+ (red), ova•+ (blue), and iso•+ (black) in the 6–10 μm spectral range. |
| In the text | |
|
Fig. 5. Histograms showing the occurrence of PAHs with irregularity parameter ξ in the NASA Ames PAH database. Top panel: occurrence of PAHs of a certain irregularity parameter considering only small PAHs (defined as NC ≤ 34), while the bottom panel shows that for large PAHs (with NC > 34). The irregularity parameter is defined in Eq. (1). |
| In the text | |
|
Fig. A.1. A typical FEL power curve shown together with a third-order polynomial fit to the data. |
| In the text | |
|
Fig. B.1. IRMPD spectra of (A) perylene•+, (B) peropyrene•+, (C) ovalene•+, and (D) isoviolanthrene•+ plotted together with Gaussian profiles that are fitted to determine the band positions of the measured IR absorptions. |
| In the text | |
Current usage metrics show cumulative count of Article Views (full-text article views including HTML views, PDF and ePub downloads, according to the available data) and Abstracts Views on Vision4Press platform.
Data correspond to usage on the plateform after 2015. The current usage metrics is available 48-96 hours after online publication and is updated daily on week days.
Initial download of the metrics may take a while.