Fig. 4.
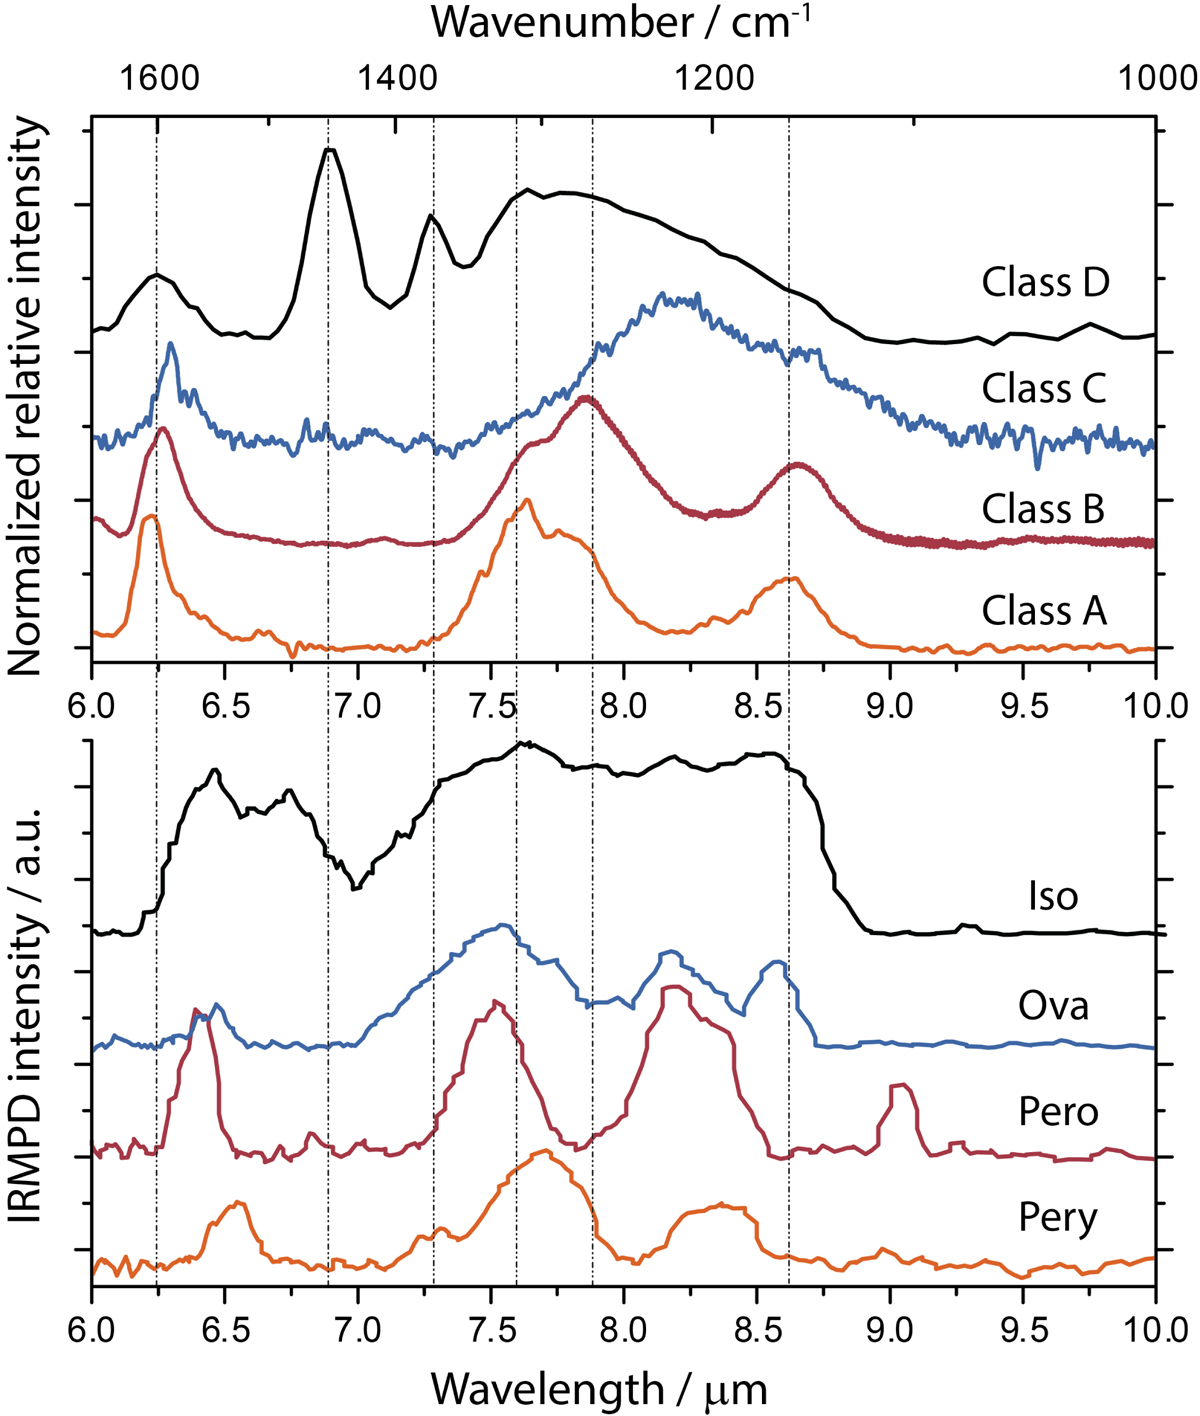
Top panel: mid-IR spectra of astronomical sources illustrating examples of type~D (IRAS 05110–6616; black), type C (IRAS 13416-6243; blue), type~B (HD 44179; red), and type A (IRAS 23133+6050; orange), all normalized to the maximum intensity of the 7–8 μm complex and with continuum subtracted. The type D spectrum was recorded by Spitzer/IRS (Werner et al. 2004; Houck et al. 2004), while the others are from ISO/SWS (Kessler et al. 1996; de Graauw et al. 1996), as calibrated by Sloan et al. (2003). Bottom panel: IRMPD spectra of pery•+ (orange), pero•+ (red), ova•+ (blue), and iso•+ (black) in the 6–10 μm spectral range.
Current usage metrics show cumulative count of Article Views (full-text article views including HTML views, PDF and ePub downloads, according to the available data) and Abstracts Views on Vision4Press platform.
Data correspond to usage on the plateform after 2015. The current usage metrics is available 48-96 hours after online publication and is updated daily on week days.
Initial download of the metrics may take a while.