Fig. 3.
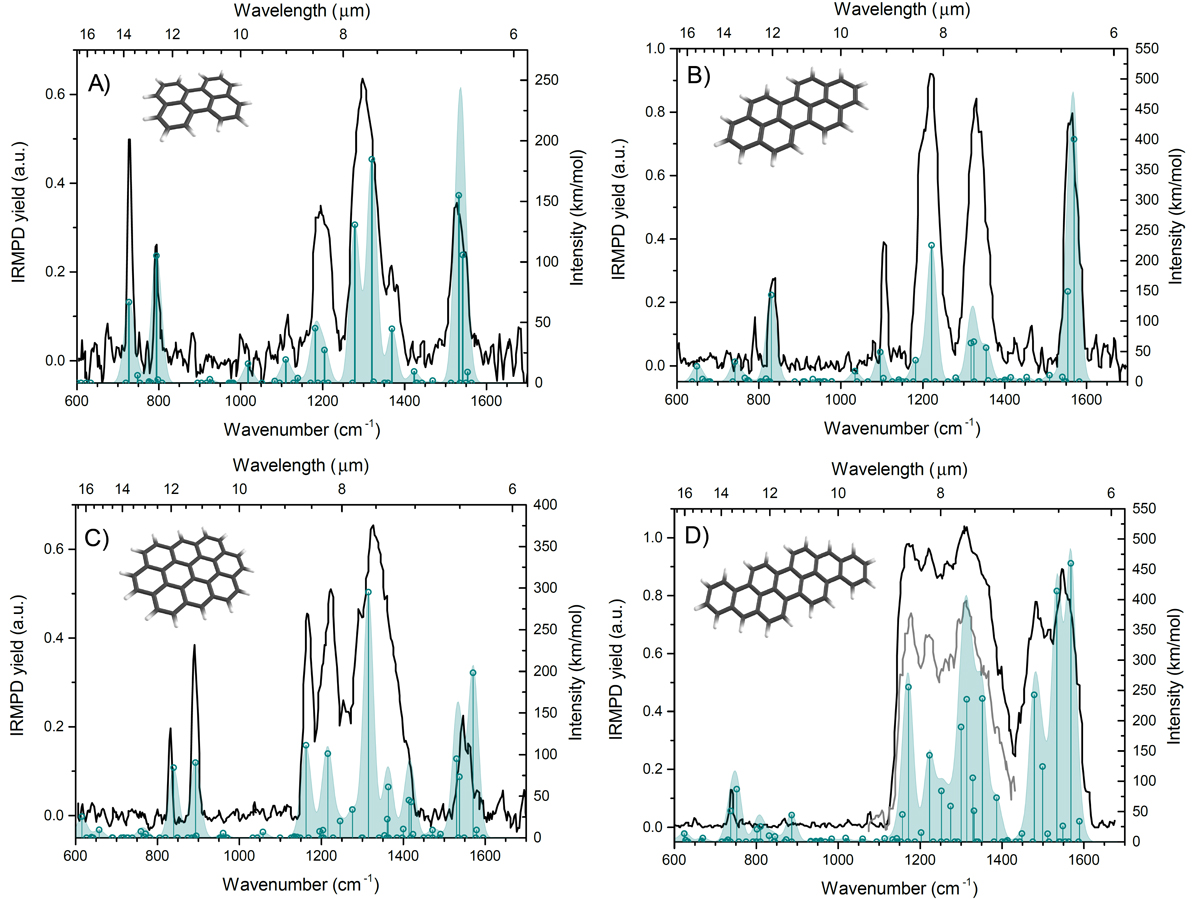
IRMPD spectra of (A) perylene•+, (B) peropyrene•+, (C) ovalene•+ , and (D) isoviolanthrene•+ plotted together with scaled computed spectra (stick diagrams) that have been convolved with a Gaussian line profile with a FWHM of 30 cm−1 to facilitate comparison. The gray line in the spectrum of iso•+ indicates a spectrum measured at reduced FELIX exposure to avoid saturation and thereby attempting to better resolve the vibrational modes.
Current usage metrics show cumulative count of Article Views (full-text article views including HTML views, PDF and ePub downloads, according to the available data) and Abstracts Views on Vision4Press platform.
Data correspond to usage on the plateform after 2015. The current usage metrics is available 48-96 hours after online publication and is updated daily on week days.
Initial download of the metrics may take a while.