| Issue |
A&A
Volume 621, January 2019
|
|
|---|---|---|
| Article Number | A77 | |
| Number of page(s) | 7 | |
| Section | Extragalactic astronomy | |
| DOI | https://doi.org/10.1051/0004-6361/201833068 | |
| Published online | 11 January 2019 | |
Interaction of the massive cluster system Abell 3016/3017 embedded in a cosmic filament
1
Max-Planck-Institut für extraterrestrische Physik, Garching 85748, Germany
2
Universitäts-Sternwarte München, Fakultät für Physik, Ludwig-Maximilian-Universität München, Scheinerstr. 1, München 81679, Germany
3
Department of Physics & Astronomy, University of Alabama in Huntsville, Huntsville, AL 35899, USA
4
Harvard-Smithsonian Center for Astrophysics, 60 Garden Street, Cambridge MA 02138, USA
Received:
21
March
2018
Accepted:
5
November
2018
The galaxy cluster system RXCJ0225.9-4154 with the two sub-clusters A3016 and A3017 is embedded in a large-scale structure filament with signatures of filamentary accretion. In a Chandra observation of this system at a redshift of z = 0.2195 we detect both clusters in X-rays. In addition we detect a filament of X-ray emission connecting the two clusters and a galaxy group therein. The main cluster, A3017, shows indications of shocks most probably from a recent interaction with cluster components along the filament axis as well as a cold front at about 150 kpc from the cluster centre. The filament between the two clusters is likely to be heated by the accretion shocks of the clusters. We discuss two scenarios for the origin of the X-ray filament between the two clusters. In the first scenario the material of the filament has been ripped off of A3017 during the fly-by of A3016 and is now trailing the latter sub-cluster. Support for this scenario is a gas deficit on the eastern side of A3017. In the second scenario the filament between the two clusters does not come from either of them, but a significant contribution could come from the galaxy group located inside and the entire structure is on its first collapse. We favour the second explanation as the gas mass in the filament seems to be too large to be supplied by the interaction of the two Abell clusters. The paper describes many properties of the components of this cluster merger system that are used to assist the interpretation of the observed configuration.
Key words: galaxies: clusters: intracluster medium / galaxies: clusters: general / X-rays: galaxies: clusters
© ESO 2019
1. Introduction
The currently adopted model for the formation of the large-scale structure of the universe, as also studied in detail with cosmological N-body simulations, displays the emergence of a cosmic web of filamentary structures, where galaxy clusters grow preferentially at the intersections of the filaments. The dominant mode of growth of clusters is the inhomogeneous accretion of matter from these filaments. Because the way galaxy clusters accrete material from their surroundings is a determining factor for the resulting structure of the clusters, in particular for the thermodynamics of their intra-cluster medium (ICM), it is important to also study this process observationally. In X-ray observations, which provide much detail about the structure of clusters of galaxies, we have only seen this clearly in a few cases of this connection of clusters to the cosmic web (e.g. Kull & Böhringer 1999; Scharf et al. 2000; Werner et al. 2008; Buote et al. 2009; Eckert et al. 2015).
We found an interesting cluster system, RXCJ0225.9-4154, which is embedded in a large-scale galaxy filament and shows an interesting dynamical behaviour in X-rays. RXCJ0225.9-4154 (A3016/3017) was identified as an X-ray luminous cluster system in our REFLEX cluster survey based on the ROSAT All-Sky Survey (RASS). At redshift z = 0.2195 with an X-ray luminosity of LX = 6.5 × 1044 erg s−1 (0.1–2.4 keV) it is one of the eleven most luminous clusters at z ≤ 0.22 in the southern sky (Böhringer et al. 2013). It also belongs to the REFLEX superstes-cluster sample (Chon et al. 2013) which implies that it is located in an overdense region compared to the mean density at its redshift.
In this paper we use two archival exposures from Chandra ACIS-I observations to study the properties of the cluster system and to infer the formation history. Our analysis of the Chandra data shows a complex structure of the cluster system with two sub-clusters, A3017 and A3016, connected by an X-ray luminous bridge aligned along the larger galaxy filament with signatures of cluster and filament interactions. We report in the paper on a detailed study of the X-ray observation of the system and offer our interpretations, which we also compare to the results produced by Parekh et al. (2017).
In Sect. 2 we describe the X-ray data and give a brief summary of the analysis and Sect. 3 provides an overview of the morphology of the system in X-rays, while Sect. 4 reports the properties and masses of the sub-cluster components. In Sect. 5 we analyse the properties of the filamentary structures connecting the two sub-clusters and the clusters with the filament, and in Sect. 6 we conclude on the overall dynamics of the system and compare our findings and interpretations to those of Parekh et al. (2017). Section 7 provides a summary.
For the derivation of distance-dependent parameters we use a geometrically flat Λ cold dark matter model with ΩM = 0.3 and h70 = H0/70 km s−1 Mpc−1 = 1. All uncertainties without further specifications refer to 1σ confidence limits. At the cluster distance, 1 arcsec corresponds to the physical scale of 3.55 kpc for the adopted cosmology.
2. Observations and data reduction
The cluster system was observed twice with Chandra (OBSID 15110, 17464) for 14.88 and 13.88 ks, respectively. The data were taken with the ACIS-I detector in VFAINT mode. Standard data analysis was performed with CIAO 4.8.1 with calibration database (CALDB) 4.7.1. This includes flare cleaning by filtering light curves of source-free regions, VFAINT mode, gain, and charge transfer inefficiency corrections. The final exposure after cleaning is slightly less than 28 ks. We applied the same procedure to the ACIS Blank-sky data, which was used as our background estimate after adjusting the normalisation. We used the 9.5–12 keV count rate to get the appropriate normalisation for the background exposure. We used a fluximage to obtain flux and exposure maps after background subtraction. The resulting combined map is shown in Fig. 1 in the 0.5–2 keV band.
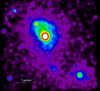 |
Fig. 1. Chandra image of the cluster system A3016/A3017 in the 0.5–2.0 energy keV band. The brightest component in the northern region is A3017 and A3016 is identified with the component in the southwest. The two cluster components are connected by a bridge of diffuse X-ray emission. |
For the spectral analysis we used the area well outside r500 of the cluster as a background region in each dataset. We considered three background components: unresolved X-ray point sources, the local bubble, and the hot halo. The first component was modelled with a power law for a fixed index of 1.4, the second with a thermal model for a fixed temperature of 0.1 keV and the last one for a fixed temperature of 0.25 keV. The amplitudes of these three background components were fitted in the background region of the data and were scaled for each source region accordingly.
Our optical survey of the cluster includes photometric images of the system taken with the Wide Field Imager (WFI) at the ESO/MPG 2.2 m telescope at ESO La Silla in four optical bands (B, V, Rc, I). Total integration time was 60 min for each of the B, Rc, and I bands and 30 min for the V band. The V band dataset was discarded due to its low signal-to-noise ratio (S/N) and sparse sampling. The total field of view for all datasets is 0.3 deg2.
The basic data reduction included bias subtraction, flat fielding, and masking of bad pixels and satellite tracks. Sky subtraction was performed by averaging the normalised images in which every source with a surface brightness of less than 28 mag arcsec−2 was masked. This background model was then flux-rescaled to the individual exposures and was subtracted. General details for this method will be described in Kluge et al. (in prep.). The astrometric and photometric solutions were calculated using SCAMP (Bertin 2006) and the final calibrated images were co-added using SWarp (Bertin 2002). A composite image of the WFI data based on the three bands is shown in Fig. 2 with the surface brightness contours of the Chandra data.
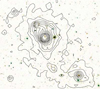 |
Fig. 2. Surface-brightness contours of the Chandra superposed on an optical composite image based on the B, Rc, and I bands from the WFI data. |
We identified 8697 sources with SExtractor (Bertin & Arnouts 1996) in the co-added Rc-band image. These sources were sorted according to their stellarity indices and cluster member candidates were selected for those sources whose apparent brightnesses were between 17.7 < mRc < 22.0 and 17.0 < mI < 21.0. We used two red sequences based on B – Rc and Rc – I to select cluster members applying the thresholds of ± 0.15 mag and ± 0.08 mag around the fitted red sequence, respectively. This results in a sample of 610 galaxies which belong to both red sequences.
3. Large-scale morphology of the cluster complex
Figure 1 shows a Chandra X-ray image of the cluster complex in the 0.5–2.0 keV band. The image shows the two major sub-cluster components: the main cluster, A3017, in the upper left, and A3016, which has a lower X-ray luminosity than A3017, in the lower right. The two clusters are connected by a bridge of X-ray emission.
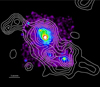 |
Fig. 3. Distribution of the red-sequence galaxies in the RXCJ0225.9-4154 cluster region shown in white contours superposed on the Chandra image. |
A contour plot of the red-sequence galaxy distribution superposed on the X-ray image is shown in Fig. 3. The images show that the structure traced by the X-ray gas is embedded in a large-scale structure filament. The galaxy distribution follows the orientation of the X-ray emission very closely and extends beyond it, displaying a galaxy filament which stretches in the northeast to southwest direction over at least 6 Mpc. In the southern part, the filament could have an even larger extent, since in the figure the filament ends at the edge of the WFI field-of-view. Both sub-clusters have a luminous, dominant elliptical galaxy near the X-ray peak. The galaxy redshifts show that we are almost looking from a perpendicular direction at the filament. The southern cluster has a velocity difference to the main cluster of about 650 km s−1 and the filament of 250 km s−1 (Foëx et al. 2017). Also, the distribution of the red-sequence galaxies confirms that the two Abell clusters are indeed associated. This makes our interpretation of the system more straightforward than that given in Parekh et al. (2017). In Fig. 3 one can clearly see that the galaxy overdensities coincide with regions of high X-ray surface brightness. This is also shown in the top two panels of Fig. 4, where we find giant galaxies near the X-ray maxima of the two clusters, typical brightest cluster galaxies (BCG). We note that the largest galaxy in Fig. 2 and in the top-left panel of Fig. 4, at the distance of 1.5 arcmin from the centre of A3017 is a foreground galaxy, 6dF J0225450-415458 (z = 0.0178).
Closer inspection of the X-ray surface brightness distribution shows, apart from the three main features, the bridge between the sub-clusters. Within the bridge there is a compact source, centred on a luminous galaxy. The bottom-left panel of Fig. 4 focusses on this feature, which clearly shows extended X-ray emission. The surrounding ICM is also brighter and in the optical we note a clear galaxy concentration as shown in Fig. 3. Therefore this part of the bridge harbours a smaller group of galaxies with a central dominant galaxy, which seems to harbour its own coronal X-ray halo.
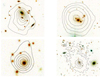 |
Fig. 4. X-ray contours superposed on the optical image from the ESO/MPG Wide Field Imager. Shown are the central region of A3017 (top left panel), A3016 (top right panel), the intermediate group (bottom left panel), and the northern clump (bottom right panel). We note that the centre of the X-ray emission is also marked in all first three figures by a bright early-type galaxy. |
The X-ray halo of A3017, the main cluster of the system, is strongly elongated towards the northeast. At smaller radii from the cluster centre there is a bright feature that protrudes with its own X-ray peak. The bottom right panel in Fig. 4 shows that this clump of X-ray emitting gas has no luminous galaxy inside, thus it is not a freshly infalling X-ray luminous group. A small point source embedded in this extended emission, which coincides in the optical with a compact bluish object, is most probably an AGN unassociated with the cluster. Therefore the localised peak in the extended emission of the northern clump in A3017 is probably due to this contaminating source. At larger radii from the cluster centre to the northeast we see fainter X-ray emission that follows the extension of the galaxy filament in this direction. It is probably marking the connection of the cosmic filament to the cluster.
Thus we note six features in the X-ray image, that we further investigate in the following: (i) the main sub-cluster A3017 (ii) the second sub-cluster, A3016 (iii) the X-ray luminous bridge between the clusters (iv) the X-ray luminous galaxy group near the middle of the bridge (v) the X-ray luminous clump to the northeast of A3017 (vi) the extension of the X-ray surface brightness towards the northeast close to the direction of the large-scale structure filament. Features (i)–(v) are marked in Fig. 5 and (vi) is indicated by the most northern box in Fig. 11.
4. Cluster components
4.1. Physical properties of the cluster components
We used X-ray spectroscopic data to determine temperatures for different parts of the cluster complex to obtain further information about the different components. Spectra were extracted in three regions of the cluster as defined by the white polygons in Fig. 5.
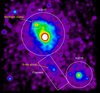 |
Fig. 5. X-ray image of RXCJ0225.9-4154 with the three regions marked in white where the spectral temperatures were determined. |
Fitting these regions, we find  keV for A3017 (T1),
  keV for A3016 (T2) and
  keV for the area between the two clusters (T3). The value of r500 of A3017 is 5.8 arcmin, but the spectrum was extracted between 0.3 and 3 arcmin to avoid the southern interaction region and also the cool-core. That of A3016 is 4.2 arcmin, and for the same reason as above, the spectrum was extracted inside the circular region of 2 arcmin. The size of the T3 region is 2 by 5 arcmin2. The metallicities for A3017 and A3016 were also fitted yielding the values of 0.19 ± 0.1 Z⊙ and
  , respectively. The metallicity was fixed to 0.2 solar for T3 due to photon statistics. The temperature fit in the T3 region has a very large uncertainty due to low photon statistics. Decreasing the metallicity to 0.1 solar results in the best-fit temperature of
  keV. The ICM in these regions may have a multi-temperature structure, but due to the relatively short exposure we cannot obtain more accurate information by either subdividing the regions into smaller bins or fitting more complex spectral models. Within the relatively large error budget the temperature distribution indicates that the filament between the two clusters has likely been heated due to their interaction.
To estimate the masses of the two sub-clusters we also determined X-ray surface brightness profiles of these components. Since A3017 shows major disturbances of an azimuthally symmetric structure, we sub-divided the cluster data into six sectors as shown in Fig. 6. The northern sectors N1 and N2 are clearly disturbed by the accretion of material from the northern filament. The sector S2 shows an extension into the bridge. Only the sectors S3 and N3 seem to reflect the shape of the cluster undisturbed by recent accretion.
A close inspection of the sector S1 in the X-ray image of Fig. 6 shows that the surface brightness contours are squeezed at radii between about one and two arcmin. Since we suspect that this could have been caused by an interaction of the two sub-clusters, we subject this sector to further investigation.
In Fig. 7 we show the average surface-brightness profile in sectors S3 and S1. The surface-brightness profile in sector N3 is very similar to that of S3. We clearly note the deficit of X-ray-emitting gas in sector S1 compared to sector S2 in the region from about 0.7–2 arcmin.
From the X-ray surface-brightness distribution and the measured ICM temperatures we estimated the total and the gas masses of the different components of the merging cluster complex. The mass estimates were determined assuming hydrostatic equilibrium of the ICM and approximate spherical symmetry of the cluster components. Due to the sparsity of the data we keep the spatial modeling relatively simple, as most of the uncertainty in the mass originates from the uncertainties on the ICM temperature determination. Therefore, we modelled the surface-brightness distribution with a β-model (Cavaliere & Fusco-Femiano 1976) and made sure that the best fit is a fair description of the data. For the temperature profile we used two solutions, which bracket the typical temperature distributions in clusters outside the core region, as found for example in our REXCESS survey of a representative sample of X-ray clusters from X-ray sky surveys (Böhringer et al. 2007). We use an isothermal profile and profiles with polytropic indices of 1.2 and 1.1, which are characterised by T(r) ∝ ρ(r)0.2. The polytropic temperature profiles are normalised such that the emission-measure-weighted average temperature outside the core is equal to the measured bulk temperature. In the case of A3017 we excised the core of radius 0.3 arcmin to determine the bulk temperature as indicated at the beginning of this section. For the overall result of the mass profile we evaluated the best fit for a polytropic index of 1.1 and the minimum and maximum of the combinations of all extreme density and temperature profiles.
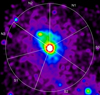 |
Fig. 6. X-ray image of RXCJ0225.9-4154 with the six sectors in A3017 from which surface brightness profiles were extracted. |
For A3017 we obtained the following results from the best-fitting β-model to the surface-brightness profile of sector S3 (with similar values for N3). A resulting core radius of 0.18 arcmin and a β-parameter of 0.48 implies a cluster mass of 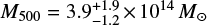 with the above quoted values for the bulk temperature of the ICM of this component. For the gas mass of A3017 we obtained a value of M500 = 5.6 × 10¹³ M⊙. Figure 8 shows the resulting mass and gas mass profiles for A3017.
From the difference of the two surface-brightness profiles for the sectors S1 and S3 we find that approximately 3−4 × 10¹¹ M⊙ of gas is missing in sector S1 in the radial range from about 200 to 400 kpc, compared to what we consider as the undisturbed cluster. This amounts to about one third of the gas mass inside 400 kpc in sector S3. At larger radii we do not note such a deficit.
 |
Fig. 7. X-ray surface brightness profiles of the sectors S1 (blue) and S3 (black) of the A3017 sub-cluster. The profiles were fitted with β-models as shown by the solid lines. For the sector S1 the inner and outer profiles were fitted by two separate β-models. |
The southern component, A3016, is less disturbed than the main cluster. Here it is the northeast part of the cluster that overlaps with the bridge between the clusters. Therefore we used the southwest half of the cluster to obtain an undisturbed reference surface brightness profile, yielding a core radius of 0.13 arcmin and a β-parameter of 0.46. The resulting total mass based on the temperature determination quoted above is 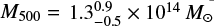 with a gas mass of M500 = 1.6 × 10¹³ M⊙.
As a first consistency check we may look at the gas mass fractions of the two sub-clusters, which results in 10–16% for A3017 and 9–14% for A3016. This covers the expected values for the gas mass fraction for high mass clusters found to be in the range of about 8–15% in the studies by Vikhlinin et al. (2006) and Pratt et al. (2009), for example. We can also compare to the mass estimate from our X-ray luminosity to mass relation from the REXCESS study (Böhringer et al. 2007; Pratt et al. 2009) which yields an X-ray luminosity for A3017 of L500 ∼ 4 − 5 × 1044 erg s−1 and a mass of 6.2 × 10¹⁴ M⊙, and for A3016 of L500 ∼ 0.7 × 1044 erg s−1 with an estimated mass of 1.8 × 10¹⁴ M⊙.
Similarly we can use the X-ray temperature–mass relation to estimate the sub-cluster masses (e.g. Arnaud et al. 2005). For the above quoted temperatures we obtain the following mass estimates: M = 7.0±1.3×10¹⁴ M⊙ for A3017 and 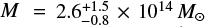 for A3016. While consistent within the 1σ uncertainties, the masses estimated this way are higher than the values derived above. There may be two reasons for this; the core-excised temperatures are higher than those for the whole cluster regions, and the clusters used in Arnaud et al. (2005) to construct the scaling relations are preferentially regular, and therefore are expected to have a slightly different scaling relation than this disturbed system (see e.g. Chon et al. 2012; Chon & Böhringer 2017). The coronal halo of the central galaxy of the group in the middle of the bridge has an X-ray luminosity of LX = ∼ 2.3 × 1042 erg s−1 in the 0.5–2 keV band, typical for the hot gas in massive ellipticals in groups.
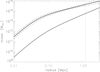 |
Fig. 8. Total (upper solid line) and gas mass profiles (lower solid line) for A3017, the main component of the cluster complex. The profile was determined from the relatively undisturbed sector, S3, in the western side of this cluster. The two dashed lines indicate the uncertainty of the total mass determination. |
The northern clump has an X-ray luminosity of about 2.2 × 1043 erg s−1 in a region of about 250 by 250 kpc2 after removing the contribution from a point source. This is consistent with a smaller infalling group of galaxies, but the centre of this region is not marked by a giant elliptical as we would expect for a group. Therefore, either the gas has been separated from the associated galaxy or the gas is not from a group but is a sub-structure feature of A3017.
4.2. Internal structure of A3017
A detailed analysis of the X-ray surface-brightness distribution and the ICM temperature inside A3017 reveals further interesting features. Parekh et al. (2017) described a spiral-arm structure in the surface brightness in the western outskirts of A3017 as a cold front with its gas temperature of 6 keV. Using our best fit β-model for A3017 described in Sect. 4, we obtained the X-ray residual map of A3017 in Fig. 9. We confirm the excess of the X-ray gas at a similar location in Fig. 9 to that in Fig. 1b or Fig. 3 of Parekh et al. (2017). A close inspection of our image shows that, rather than a spiral, this is an arc-like structure with an almost constant radius to the centre. Our estimation of the gas temperature is  keV. To determine if this structure corresponds to a sloshing front, we extracted temperatures on both sides of the arc region at radii R1 and R2 in Fig. 9. These radii were guided by two breaks in the surface-brightness profile of the sector S2 shown in Fig. 10. We find that the temperature of the region below the radius R1 is
  keV and that beyond R2 is
  keV. The temperature jump at R2 does not support the suggestion by Parekh et al. (2017) that the western structure is the result of tidal sloshing. The observations are more consistent with a shock front at R2. We rather have an indication of a cold front close to the core at R1, a radial region where most cold fronts have been observed (e.g. Ghizzardi et al. 2010). It is interesting that we find the signature of a shock front in the cluster region that is essentially opposite to the massive accretion of material from the filament in the northeast. We may therefore see the forward shock in response to the compression of the infalling material.
5. Properties of the filaments
To analyse the physical conditions in the bridge area, we selected two study regions, as marked in Fig. 11, with sizes of 4 by 1.9 arcmin for the northern region and 2.5 by 1.9 arcmin in the south. In both regions taken together, we find a significance of excess X-ray emission of about 18σ after subtracting the two cluster emission models from the data. Inside the two regions we have modest surface-brightness variations and the northern region is about a factor of 1.8 brighter than the southern one. We also note that the northern region is brighter than the cluster emission of A3017 outside about 3 arcmin (0.6 Mpc) and the southern region is brighter than A3016 outside about 2 arcmin (0.4 Mpc).
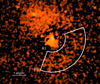 |
Fig. 9. X-ray residual map of A3017 after subtracting the best-fit β-model based on the sector S3 in Fig. 6. The region bounded by two radii, R1 and R2, corresponds to the spiral arm identified by Parekh et al. (2017). In our analysis R1 and R2 correspond to the radii identified as the cold front and the shock front in Fig. 10. |
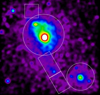 |
Fig. 11. X-ray image of RXCJ0225.9-4154 with the two study regions of the X-ray luminous bridge marked by the two connected white boxes and the connection to the filament marked by one white box. For the two sub-clusters a three arcmin radius is shown for A3017 and a two arcmin radius for A3016. |
For the northern region we find an average surface brightness of about SX ∼ 2 × 10⁻³ cts s−1 arcmin−2 and a total luminosity of about 1.9 × 1043 erg s−1 in the 0.5–2 keV band. The region has an extent of about 0.85 × 0.4 Mpc2. If we assume that it extends for about 0.5 Mpc in depth, we can determine the average electron density in this part of the bridge to be ne ∼ 8.2 × 10⁻⁴ cm−3 and the total gas mass Mgas ∼ 3.4 × 10¹² M⊙. For the southern region, with an area of 0.53 × 0.4 Mpc2 and a total luminosity of 0.74 × 1043 erg s−1 we find an electron density of ne ∼ 6.4 × 10⁻⁴ cm−3 and a total gas mass of Mgas ∼ 1.7 × 10¹² M⊙. Thus the total mass of gas contained in the selected region of the bridge amounts approximately to 5 × 10¹² M⊙ and there may well be at least a similar amount of gas outside this bright central area, meaning that the total gas mass in the bridge could well be 1013 M⊙. An inhomogeneous gas distribution in the analysed region will lead to an overestimate of the gas mass. This overestimate is certainly much less than a factor of two, since this factor would require the density fluctuations to have unexpectedly large amplitudes. A source of uncertainty in determining the gas mass is the unknown extent of the ICM in the bridge along the line-of-sight. A factor of two change in the line-of-sight length corresponds to a change in the the gas mass of only the square root of two.
For the northern extension of the X-ray surface brightness, as marked by a box with a size of 2.5 by 2.5 arcmin2 in Fig. 11, we find a significance of excess X-ray emission of 8.7σ after subtracting the cluster emission modelled by an azimuthally symmetric β-model from the data. The surface brightness in this region is about 1.36 × 10⁻³ cts s−1 arcmin−2.
The surface brightness has a clear radial gradient. If we take average properties we find a gas density of ne ∼ 6.8 × 10⁻⁴ cm−3 and a total mass of about Mgas ∼ 2.3 × 10¹² M⊙, which is 14% of the gas mass of A3017.
6. The cluster merger and the interaction with the filaments
The observed morphology of the cluster system suggests two different interpretations of the evolutionary state of the cluster merger. The system could be post-merger, where the sub-cluster A3016 has passed A3017 in a close fly-by and gas was ripped off from both systems, which now forms the bridge between them. Alternatively, the system is at the stage of the first collapse and the material of the bridge is another overdensity within the large-scale filament hosting a galaxy group near its centre.
The steep surface-brightness profile and the gas mass missing in sector S1 of A3017 is very suggestive of a scenario in which A3016 has passed A3017 on the eastern side and has ripped out gas where it is now missing. The gas bridge is then trailing A3016, forming an arc following the trajectory of A3016. A3016 may have nearly reached a turning point from which it falls back on A3017. There is a major caveat with this interpretation. As we have seen above, the gas mass that is missing in sector S1 with 3 – 4 × 10¹¹ M⊙ falls far short of the gas mass of the bridge, which is approximately 0.5 – 1 × 10¹³ M⊙. It is also plausible that more gas could have been stripped off from the outer parts of both clusters. An approximately 13% loss of the gas of A3017 would be sufficient, but most of this gas would be in the cluster outskirts and would originally have a low gas density. The gas in the bridge has a higher density and lower entropy than the gas from larger cluster radii, and it is difficult to imagine a process by which the gas is ripped off from the clusters and then compressed to lower entropy by the merger event. In addition we may conclude that a possible first merger could not have been very dramatic, since both clusters have still retained most of their gas inside at least about 0.7r500. In the case of a post-merger scenario this probably implies a sufficiently large impact parameter.
In the second scenario, the material of the bridge comes from a separate overdense region between the clusters. In this case we would expect the gas in the bridge to be colder than the gas in the thermalised clusters. However, the temperature measurement from the X-ray spectrum shows a relatively high temperature for the bridge gas. This implies that the gas in the bridge must also have been shock-heated. The bridge region is just about covered by the two r500 radii of A3107 and A3016. The accretion shocks of both clusters are expected to be located well outside these radii. Therefore, it is very plausible that the bridge material has been affected by the outgoing shocks from the clusters. The existence of the group within the bridge may be a further indication of a separate origin. It would otherwise be difficult to explain the formation of this group and its BCG in the stripping tail of A3017. The group itself may have contributed a significant fraction of the X-ray-emitting plasma in the bridge, and a previous interaction of the group with A3017 could be another reason for the high temperature in the filament.
With this evidence, that is, mostly the fact that it is difficult to account for the large gas mass in the bridge within a post-merger model, our second scenario seems to be more consistent. A final decision on which of the two pictures is most likely should await better X-ray observational data which would allow further diagnostics. If the filamentary gas was heated by outgoing shocks, we would expect a decreasing temperature profile with radius. Also, a comparison of the metallicity of the gas in the clusters with that of the bridge would help to resolve the origin of the bridge gas. A metallicity in the bridge very different from that of the clusters would point to a separate origin.
The structures seen in X-rays to the north of A3017 indicate further significant mass accretion. From the X-ray luminosity of the northern clump of A3017, we can infer that a total mass of at least 8 × 10¹³ M⊙ is associated in this accretion event. The X-ray extension into the northern filament at large radii involves a gas mass of at least 2 × 10¹² M⊙ which implies a total mass accretion at this cluster distance of at least ten times this mass. Therefore we are witnessing an extremely active region of gravitational collapse at a knot of the cosmic web. The six distinct structures of this cluster complex are expected to form one very massive cluster in about three to four gigayears.
7. Summary
We used Chandra observations to study the galaxy cluster system RXCJ0225.9-4154 in which two Abell clusters are connected by a bridge of X-ray emitting gas. This object is rich with interesting X-ray features, six of which we analysed in detail. Also supported by optical photometric data, this system is embedded in a large cosmic filamentary structure through which we are witnessing a process of mass accretion. We give a brief summary of four important points: A3017 and A3016 form one system being at the same redshift together with the X-ray bridge between them. The ICM structure of A3017 shows internal disturbances with an indication of a shock front in the west at a radius of about 430 kpc and a cold front at the edge of the cool core. The X-ray-emitting filament between these two clusters is likely to be shock-heated and harbours an X-ray galaxy group with a clear BCG. Our X-ray studies suggest two different interpretations of the evolutionary stage of the cluster merger. Based on the amount of gas present in the bridge region it is more likely that we are witnessing an event prior to the major merger of A3017 and A3016. We await deeper X-ray data to fully understand the details of the formation process of this system.
Acknowledgments
We thank the referee for constructive comments, which helped to improve the paper. HB and GC acknowledge support from the DFG Transregio Program TR33 and the Munich Excellence Cluster “Structure and Evolution of the Universe”. This research made use of the NASA/IPAC Extragalactic Database (NED), which is operated by the Jet Propulsion Laboratory under contract by NASA.
References
- Arnaud, M., Pointecouteau, E., & Pratt, G. W. 2005, A&A, 441, 893 [NASA ADS] [CrossRef] [EDP Sciences] [Google Scholar]
- Bertin, E. 2006, in Astronomical Data Analysis Software and Systems XV, eds. C. Gabriel, C. Arviset, D. Ponz, & S. Enrique, ASP Conf. Ser., 351, 112 [NASA ADS] [Google Scholar]
- Bertin, E., & Arnouts, S. 1996, A&AS, 117, 393 [NASA ADS] [CrossRef] [EDP Sciences] [Google Scholar]
- Bertin, E., Mellier, Y., & Radovich, M. 2002, in Astronomical Data Analysis Software and Systems XI, eds. D. A. Bohlender, D. Durand, & T. H. Handley, ASP Conf. Ser., 281, 228 [NASA ADS] [Google Scholar]
- Böhringer, H., Schuecker, P., Pratt, G. W., et al. 2007, A&A, 469, 363 [NASA ADS] [CrossRef] [EDP Sciences] [Google Scholar]
- Böhringer, H., Chon, G., Collins, C. A., et al. 2013, A&A, 555, A30 [NASA ADS] [CrossRef] [EDP Sciences] [Google Scholar]
- Buote, D. A., Zappacosta, L., Fang, T., et al. 2009, ApJ, 695, 1351 [NASA ADS] [CrossRef] [Google Scholar]
- Cavaliere, A., & Fusco-Femiano, R. 1976, A&A, 49, 137 [NASA ADS] [Google Scholar]
- Chon, G., & Böhringer, H. 2017, A&A, 606, L4 [NASA ADS] [CrossRef] [EDP Sciences] [Google Scholar]
- Chon, G., Böhringer, H., & Smith, G. P. 2012, A&A, 548, A59 [NASA ADS] [CrossRef] [EDP Sciences] [Google Scholar]
- Chon, G., Böhringer, H., & Nowak, N. 2013, MNRAS, 429, 3272 [NASA ADS] [CrossRef] [Google Scholar]
- Eckert, D., Jauzac, M., Shan, H., et al. 2015, Nature, 528, 105 [NASA ADS] [CrossRef] [Google Scholar]
- Foëx, G., Chon, G., & Böhringer, H. 2017, A&A, 601, A145 [NASA ADS] [CrossRef] [EDP Sciences] [Google Scholar]
- Ghizzardi, S., Rossetti, M., & Molendi, S. 2010, A&A, 516, A32 [NASA ADS] [CrossRef] [EDP Sciences] [Google Scholar]
- Kull, A., & Böhringer, H. 1999, A&A, 341, 23 [NASA ADS] [Google Scholar]
- Parekh, V., Durret, F., Padmanabh, P., & Pandge, M. B. 2017, MNRAS, 470, 3742 [NASA ADS] [CrossRef] [Google Scholar]
- Pratt, G. W., Croston, J. H., Arnaud, M., & Böhringer, H. 2009, A&A, 498, 361 [NASA ADS] [CrossRef] [EDP Sciences] [Google Scholar]
- Scharf, C., Donahue, M., Voit, G. M., Rosati, P., & Postman, M. 2000, Nature, 528, L73 [Google Scholar]
- Vikhlinin, A., Kravtsov, A., Forman, W., et al. 2006, ApJ, 640, 691 [NASA ADS] [CrossRef] [Google Scholar]
- Werner, N., Finoguenov, A., Kaastra, J. S., et al. 2008, A&A, 482, L29 [NASA ADS] [CrossRef] [EDP Sciences] [Google Scholar]
All Figures
|
Fig. 1. Chandra image of the cluster system A3016/A3017 in the 0.5–2.0 energy keV band. The brightest component in the northern region is A3017 and A3016 is identified with the component in the southwest. The two cluster components are connected by a bridge of diffuse X-ray emission. |
| In the text | |
|
Fig. 2. Surface-brightness contours of the Chandra superposed on an optical composite image based on the B, Rc, and I bands from the WFI data. |
| In the text | |
|
Fig. 3. Distribution of the red-sequence galaxies in the RXCJ0225.9-4154 cluster region shown in white contours superposed on the Chandra image. |
| In the text | |
|
Fig. 4. X-ray contours superposed on the optical image from the ESO/MPG Wide Field Imager. Shown are the central region of A3017 (top left panel), A3016 (top right panel), the intermediate group (bottom left panel), and the northern clump (bottom right panel). We note that the centre of the X-ray emission is also marked in all first three figures by a bright early-type galaxy. |
| In the text | |
|
Fig. 5. X-ray image of RXCJ0225.9-4154 with the three regions marked in white where the spectral temperatures were determined. |
| In the text | |
|
Fig. 6. X-ray image of RXCJ0225.9-4154 with the six sectors in A3017 from which surface brightness profiles were extracted. |
| In the text | |
|
Fig. 7. X-ray surface brightness profiles of the sectors S1 (blue) and S3 (black) of the A3017 sub-cluster. The profiles were fitted with β-models as shown by the solid lines. For the sector S1 the inner and outer profiles were fitted by two separate β-models. |
| In the text | |
|
Fig. 8. Total (upper solid line) and gas mass profiles (lower solid line) for A3017, the main component of the cluster complex. The profile was determined from the relatively undisturbed sector, S3, in the western side of this cluster. The two dashed lines indicate the uncertainty of the total mass determination. |
| In the text | |
|
Fig. 9. X-ray residual map of A3017 after subtracting the best-fit β-model based on the sector S3 in Fig. 6. The region bounded by two radii, R1 and R2, corresponds to the spiral arm identified by Parekh et al. (2017). In our analysis R1 and R2 correspond to the radii identified as the cold front and the shock front in Fig. 10. |
| In the text | |
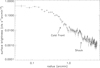 |
Fig. 10. Surface brightness profile of the sector S2 as defined in Fig. 6. |
| In the text | |
|
Fig. 11. X-ray image of RXCJ0225.9-4154 with the two study regions of the X-ray luminous bridge marked by the two connected white boxes and the connection to the filament marked by one white box. For the two sub-clusters a three arcmin radius is shown for A3017 and a two arcmin radius for A3016. |
| In the text | |
Current usage metrics show cumulative count of Article Views (full-text article views including HTML views, PDF and ePub downloads, according to the available data) and Abstracts Views on Vision4Press platform.
Data correspond to usage on the plateform after 2015. The current usage metrics is available 48-96 hours after online publication and is updated daily on week days.
Initial download of the metrics may take a while.