Fig. 4.
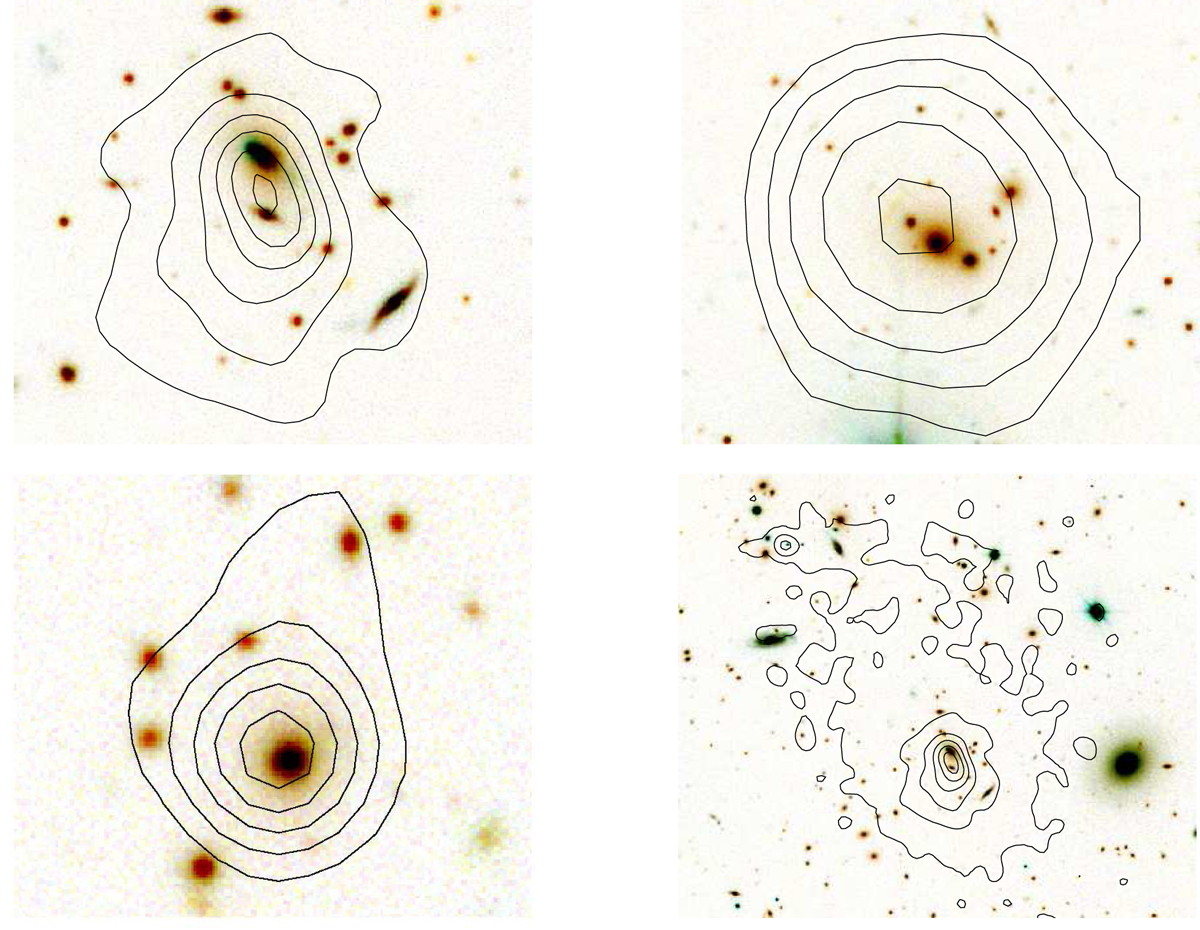
X-ray contours superposed on the optical image from the ESO/MPG Wide Field Imager. Shown are the central region of A3017 (top left panel), A3016 (top right panel), the intermediate group (bottom left panel), and the northern clump (bottom right panel). We note that the centre of the X-ray emission is also marked in all first three figures by a bright early-type galaxy.
Current usage metrics show cumulative count of Article Views (full-text article views including HTML views, PDF and ePub downloads, according to the available data) and Abstracts Views on Vision4Press platform.
Data correspond to usage on the plateform after 2015. The current usage metrics is available 48-96 hours after online publication and is updated daily on week days.
Initial download of the metrics may take a while.