Free Access
Fig. 7.
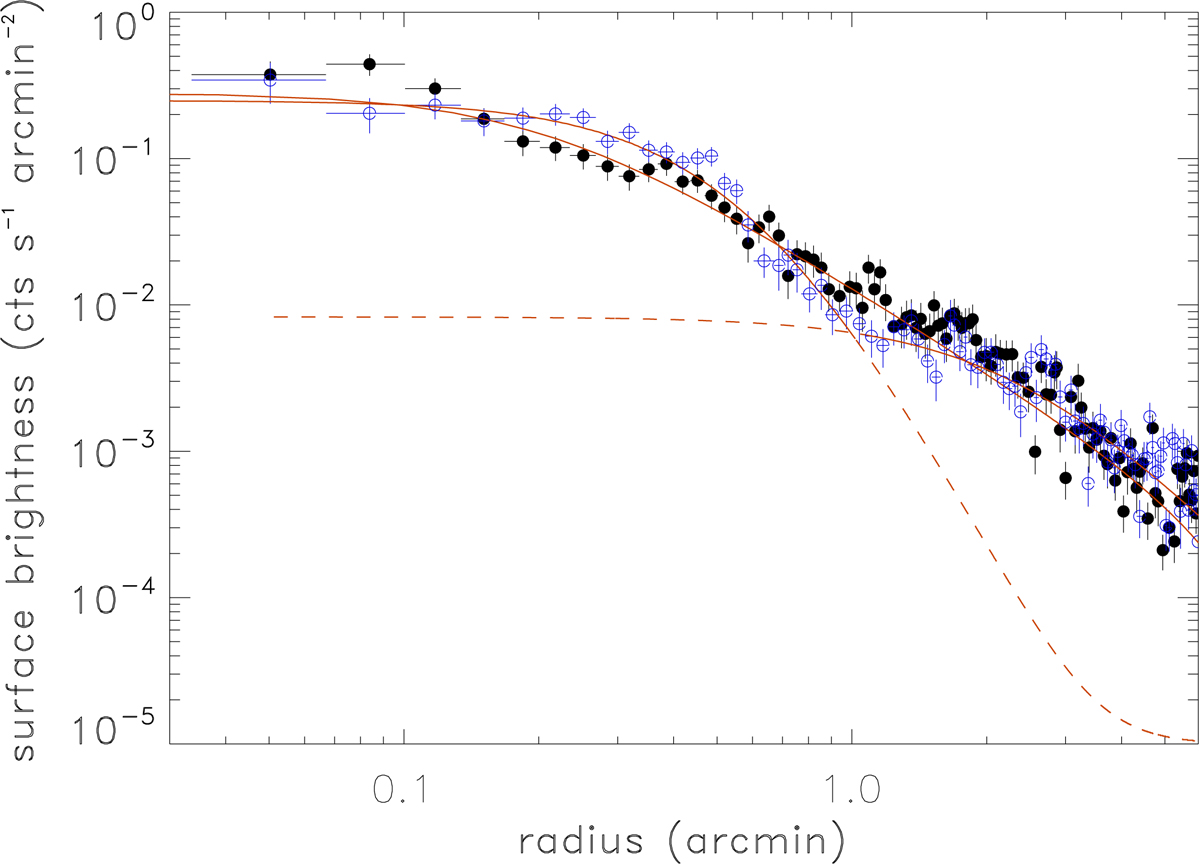
X-ray surface brightness profiles of the sectors S1 (blue) and S3 (black) of the A3017 sub-cluster. The profiles were fitted with β-models as shown by the solid lines. For the sector S1 the inner and outer profiles were fitted by two separate β-models.
Current usage metrics show cumulative count of Article Views (full-text article views including HTML views, PDF and ePub downloads, according to the available data) and Abstracts Views on Vision4Press platform.
Data correspond to usage on the plateform after 2015. The current usage metrics is available 48-96 hours after online publication and is updated daily on week days.
Initial download of the metrics may take a while.