Free Access
Fig. 9.
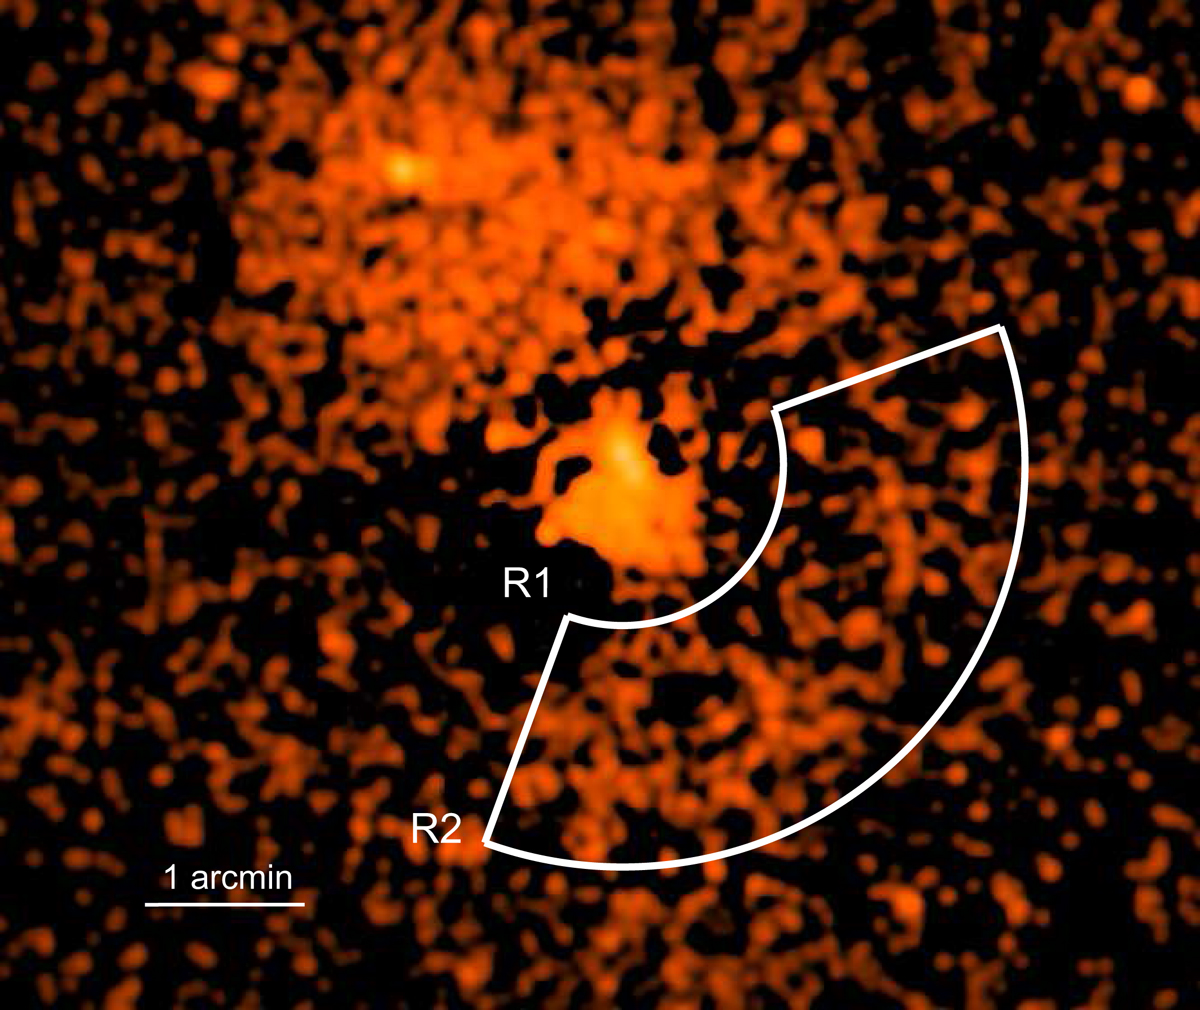
X-ray residual map of A3017 after subtracting the best-fit β-model based on the sector S3 in Fig. 6. The region bounded by two radii, R1 and R2, corresponds to the spiral arm identified by Parekh et al. (2017). In our analysis R1 and R2 correspond to the radii identified as the cold front and the shock front in Fig. 10.
Current usage metrics show cumulative count of Article Views (full-text article views including HTML views, PDF and ePub downloads, according to the available data) and Abstracts Views on Vision4Press platform.
Data correspond to usage on the plateform after 2015. The current usage metrics is available 48-96 hours after online publication and is updated daily on week days.
Initial download of the metrics may take a while.