| Issue |
A&A
Volume 621, January 2019
|
|
|---|---|---|
| Article Number | A82 | |
| Number of page(s) | 8 | |
| Section | Extragalactic astronomy | |
| DOI | https://doi.org/10.1051/0004-6361/201732532 | |
| Published online | 11 January 2019 | |
AGILE, Fermi, Swift, and GASP/WEBT multi-wavelength observations of the high-redshift blazar 4C +71.07 in outburst⋆
1
INAF, Osservatorio Astronomico di Brera, Via Emilio Bianchi 46, 23807 Merate, LC, Italy
e-mail: This email address is being protected from spambots. You need JavaScript enabled to view it.
2
INAF, Istituto di Astrofisica e Planetologia Spaziale, Via Fosso del Cavaliere 100, 00133 Roma, Italy
3
ASI, Via del Politecnico, 00133 Roma, Italy
4
UAB, Universitat Autonòma de Barcelona, Departament de Física Edifici C, 08193 Bellaterra, Cerdanyola del Vallès, Spain
5
INAF, Osservatorio Astronomico di Torino, Via Osservatorio 20, 10025 Pino Torinese, Italy
6
ASI Space Science Data Center, Via del Politecnico, 00133 Roma, Italy
7
INAF, Osservatorio Astronomico di Roma, Via Frascati 33, 00078 Monte Porzio Catone, Italy
8
INAF, Osservatorio di Astrofisica e Scienza dello Spazio, Via Piero Gobetti 93/3, 40129 Bologna, Italy
9
Dip. di Fisica, Univ. di Roma “Tor Vergata”, Via della Ricerca Scientifica 1, 00133 Roma, Italy
10
Gran Sasso Science Institute, Viale Francesco Crispi 7, 67100 L’Aquila, Italy
11
Instituto de Astrofísica de Canarias (IAC), 38205 La Laguna, Tenerife, Spain
12
Departamento de Astrofísica, Universidad de La Laguna, 38206 La Laguna, Tenerife, Spain
13
Instituto de Astrofísica de Andalucía (CSIC), Apartado 3004, 18080 Granada, Spain
14
Pulkovo Observatory, St.-Petersburg, Russia
15
Max-Planck-Insitut für Radioastronomie, Auf dem Hügel 69, 53121 Bonn, Germany
16
Institute of Astronomy and National Astronomical Observatory, Bulgarian Academy of Sciences, 72, Tsarigradsko Shose Blvd., 1784 Sofia, Bulgaria
17
Crimean Astrophysical Observatory RAS, P/O Nauchny 298409, Russia
18
Astronomical Observatory, Volgina 7, 11060 Belgrade, Serbia
19
INAF, Istituto di Radioastronomia, Via Piero Gobetti 93/2, 40129 Bologna, Italy
20
Dip. di Fisica e Astronomia, Università di Bologna, Viale Berti Pichat 6/2, 40127 Bologna, Italy
21
Sternberg Astronomical Institute, M.V. Lomonosov Moscow State University, Universitetskij prosp.13, Moscow 119991, Russia
22
Ulugh Beg Astronomical Institute, Maidanak Observatory, Uzbekistan
23
Astron. Inst., St.-Petersburg State Univ., Russia
24
Aalto University Metsähovi Radio Observatory, Metsähovintie 114, 02540 Kylmälä, Finland
25
Aalto University Department of Electronics and Nanoengineering, PO Box 13000, 00076 Aalto, Finland
26
Abastumani Observatory, Mt. Kanobili, 0301 Abastumani, Georgia
27
Engelhardt Astronomical Observatory, Kazan Federal University, Tatarstan, Russia
28
Center for Astrophysics, Guangzhou University, Guangzhou 510006, PR China
29
Key Laboratory of Optical Astronomy, National Astronomical Observatories, Chinese Academy of Sciences, Beijing 100012, PR China
30
INFN, Sezione di Pavia, Via Agostino Bassi, 6, 27100 Pavia, Italy
31
School of Physics, University of the Witwatersrand, 1 Jan Smuts Avenue, Braamfontein, 2000 Johannesburg, South Africa
32
INFN, Sezione di Trieste, Via Valerio 2, 34127 Trieste, Italy
33
Dipartimento di Fisica, Università degli Studi di Trieste, Via Valerio 2, 34127 Trieste, Italy
34
INFN, Sezione di Roma Tor Vergata, Via della Ricerca Scientifica 1, 00133 Roma, Italy
35
East Windsor RSD, 25a Leshin Lane, Hightstown, NJ 08520, USA
Received:
22
December
2017
Accepted:
9
November
2018
Abstract
Context. The flat-spectrum radio quasar 4C +71.07 is a high-redshift (z = 2.172), γ-loud blazar whose optical emission is dominated by thermal radiation from the accretion disc.
Aims. 4C +71.07 has been detected in outburst twice by the AGILE γ-ray satellite during the period from the end of October to mid-November 2015, when it reached a γ-ray flux of the order of F(E > 100 MeV)=(1.2 ± 0.3)×10−6 photons cm−2 s−1 and F(E > 100 MeV)=(3.1 ± 0.6)×10−6 photons cm−2 s−1, respectively, allowing us to investigate the properties of the jet and the emission region.
Methods. We investigated its spectral energy distribution by means of almost-simultaneous observations covering the cm, mm, near-infrared, optical, ultraviolet, X-ray, and γ-ray energy bands obtained by the GASP-WEBT Consortium and the Swift, AGILE, and Fermi satellites.
Results. The spectral energy distribution of the second γ-ray flare (whose energy coverage is more dense) can be modelled by means of a one-zone leptonic model, yielding a total jet power of about 4 × 1047 erg s−1.
Conclusions. During the most prominent γ-ray flaring period our model is consistent with a dissipation region within the broad-line region. Moreover, this class of high-redshift, flat-spectrum radio quasars with high-mass black holes might be good targets for future γ-ray satellites such as e-ASTROGAM.
Key words: acceleration of particles / radiation mechanisms: non-thermal / relativistic processes / quasars: supermassive black holes / quasars: individual: 4C +71.07 / gamma rays: galaxies
Partly based on data taken and assembled by the WEBT collaboration and stored in the WEBT archive at the Osservatorio Astrofisico di Torino – INAF (http://www.oato.inaf.it/blazars/webt).
Deceased.
© ESO 2019
1. Introduction
Among the active galactic nuclei (AGNs), blazars show the most extreme properties. Their variable emission spans several decades of energy, from the radio to the TeV energy band, with variability timescales ranging from a few minutes, such as PKS 2155–304 (Aharonian et al. 2007) and 3C 279 (Ackermann et al. 2016), to a few years (e.g. BL Lacertae Raiteri et al. 2013). Radio observations often reveal superluminal motion and brightness temperatures exceeding the Compton limit. These features can be explained by assuming that blazars emit mainly non-thermal radiation (synchrotron at low energies and inverse-Compton at high energies) coming from a relativistic plasma jet oriented close to the line of sight, with consequent Doppler beaming (e.g. Urry & Padovani 1995). Therefore, the study of blazar emission is mainly an investigation of the properties of plasma jets in AGNs. The blazar class includes flat-spectrum radio quasars (FSRQs) and BL Lac objects. FSRQs show evidence of additional unbeamed emission contributions from the nucleus, i.e. thermal radiation from the accretion disc in the rest-frame UV, and broad emission lines due to fast-rotating gas clouds surrounding the disc known as the broad-line region (BLR).
The flat-spectrum radio quasar 4C +71.07 (S5 0836+710; z = 2.172, Stickel & Kuehr 1993) is known as a γ-ray emitter since its detection by the Energetic Gamma Ray Experiment Telescope (EGRET) instrument on board the Compton Gamma Ray Observatory (CGRO; Hartman et al. 1999), and it is one of the γ-loud blazars monitored by the GLAST-AGILE Support Program (GASP) of the Whole Earth Blazar Telescope (WEBT) Collaboration (Villata et al. 2008)1. This allows us to study its multi-wavelength flux behaviour on a long timescale. In the last seven years the optical and millimetre light curves have shown several flares that do not seem to be correlated, at least not in a straightforward way. Moreover, the correlation between the optical flux variations and those observed in the γ-ray energy band by the Fermi satellite appears to be complex. Complex correlations between emission in various bands may reflect unusual processes and/or a jet structure in this source that make a detailed multi-frequency study worthwhile (see Akyuz et al. 2013, for a long-term, multi-wavelength monitoring study of this source). Another peculiarity of 4C +71.07 is its relatively high redshift (it is the most distant FSRQ in the GASP–WEBT sample) and an intervening system at z = 0.914 (Stickel & Kuehr 1993). Intervening systems producing Mg II λλ 2796,2803Å absorption lines in the AGN spectrum may be due to a chance alignment, for example of a galaxy with respect to the AGN light of sight.
The spectral energy distribution (SED) of 4C +71.07 presents a double-hump morphology typical of blazars, with a synchrotron peak in the far-infrared band and an inverse Compton peak at about 1020–1021 Hz (Sambruna et al. 2007; Akyuz et al. 2013). Moreover, it shows a strong blue bump peaking at about 1014.9 Hz, which is the signature of an accretion disc, whose luminosity is comparable to the highest values observed in type 1 QSO (Raiteri et al. 2014).
The flat-spectrum radio quasar 4C +71.07 was detected in a flaring state by AGILE at the end of October and at the beginning of November 2015, (Bulgarelli et al. 2015; Pittori et al. 2015) and was followed up by the Neil GehrelsSwift Observatory (Vercellone et al. 2015a,b) and the GASP–WEBT. These observations allow us to investigate its SED during both γ-ray flares by means of almost-simultaneous data, and to study their possible modulations and correlations.
This paper is organised as follows. In Sect. 2 we present the AGILE, Fermi/LAT, Swift, XMM-Newton, and GASP-WEBT data analysis and results. In Sect. 3 we present the simultaneous multi-wavelength light curves, the SEDs of the two γ-ray flares, and we discuss the results. In Sect. 4 we draw our conclusions. Throughout this paper the quoted uncertainties are given at the 1σ level, unless otherwise stated, and we adopt a Λ cold dark matter cosmology (Planck Collaboration XIII 2016).
2. Observations and data analysis
2.1. AGILE
The AGILE satellite (Tavani et al. 2009) is a mission of the Italian Space Agency (ASI) devoted to high-energy astrophysics. The AGILE scientific instrument combines four active detectors yielding broad-band coverage from hard X-ray to γ-ray energies: a Silicon Tracker (ST; Prest et al. 2003, 30 MeV–50 GeV), a co-aligned coded-mask hard X-ray imager, Super-AGILE (SA; Feroci et al. 2007, 18–60 keV), a non-imaging CsI Mini-Calorimeter (MCAL; Labanti et al. 2009, 0.3–100 MeV), and a segmented Anti-Coincidence System (ACS; Perotti et al. 2006). Gamma-ray detection is obtained by the combination of ST, MCAL, and ACS; these three detectors form the AGILE Gamma-Ray Imaging Detector (GRID). A ground segment alert system allows the AGILE team to perform the full AGILE-GRID data reduction and the preliminary quick-look scientific analysis (Pittori 2013; Bulgarelli et al. 2014).
AGILE-GRID data were analysed by means of the AGILE standard analysis pipeline (see Vercellone et al. 2008, for a description of the AGILE data reduction) and the standard FM3.119 AGILE filter. The γ-ray counts, exposure, and diffuse emission maps needed for the analysis were created with a bin size of 0.5 ° ×0.5°, energy E > 100 MeV, and off-axis angles lower than 50°. We rejected all the γ-ray events within a cone of 90° half-opening angle with respect to the satellite–Earth vector in order to reduce the γ-ray Earth albedo contamination. We used the latest version (BUILD-23) of the calibration matrices (I0025), with the updated version of the γ-ray diffuse emission model (Giuliani et al. 2004). A multi-source maximum likelihood analysis (ALIKE, Bulgarelli et al. 2012) based on the Test Statistic method as formulated by Mattox et al. (1996) was carried out with an analysis radius of 10° and GAL-ISO parameters (indicating the relative weights of the Galactic and isotropic diffuse components) fixed at the values calculated during the two weeks preceding the analysed AGILE dataset (2015 October 1–2015 October 14).
In order to produce the AGILE light curve (see Fig. 1), we divided the data collected in the period 2015 October 14–2015 November 15 (MJD 57309.0–57341.0) in 48 h bins. The ALIKE was carried out by fixing the position of the source to its nominal position (l, b)=(143.54 ° ,34.43 ° ) (Myers et al. 2003). We performed the spectral analysis of the activity at the two γ-ray peaks, corresponding to the periods between 2015 October 26 (MJD 57321.0) and 2015 November 1 (MJD 57327.0), and between 2015 November 7 (MJD 57333.0) and 2015 November 13 (MJD 57339.0), labelled flare-1 (F1) and flare-2 (F2), respectively, and marked as grey dashed areas. Moreover, we accumulated the average spectrum integrating between 2015 October 14 (MJD 57309.0) and 2015 November 15 (MJD 57341.0).
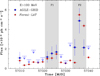 |
Fig. 1. AGILE-GRID (blue circles) and Fermi/LAT (red squares) light curves (48 h-bins) covering the period 2015 October 15–2015 November 15. Downward arrows represents 2σ upper limits. The grey dashed areas mark the time interval used to accumulate the almost-simultaneous SEDs. |
Table 1 shows the γ-ray fluxes obtained by integrating in the whole AGILE energy band (100 MeV–50 GeV) and the photon indices obtained by a fit with a power law. We restricted the γ-ray spectral analysis to three energy bins: 100–200, 200–400, and 400–1000 MeV. The γ-ray photon indices are consistent within the errors.
AGILE-GRID and Fermi/LAT γ-ray fluxes and spectral indices.
2.2. Fermi/ LAT
4C +71.07 data were retrieved using the Fermi data access service2. We selected PASS8 data centred at the position of the source with a radius of 25° covering the same time interval as the AGILE data. We analysed the data using the Fermi Science Tools version v11r5p3 and with the P8R2_SOURCE_V6 instrument response function (IRF)3. In order to analyse the data we also made use of the user contributed package Enrico4.
In our work we adopted the current Galactic diffuse emission model (gll_iem_v06.fits) and the current isotropic emission model (iso_P8R2_SOURCE_V6_v06.txt) within the likelihood analysis. We took into account nearby sources that are present in the Fermi Large Area Telescope Third Source Catalog (gll_psc_v16.fit, Acero et al. 2015). We selected an energy range between 100 MeV and 300 GeV, and filtered the events for the source class. We limited the reconstructed zenith angle to be less than 90° to greatly reduce the gamma rays coming from the limb of the Earth’s atmosphere. We selected the good time intervals of the observations by excluding events that were taken while the instrument rocking angle was larger than 52°.
Our analysis was done in two steps. In the first step, all sources within 10° angular distance to our source of interest had their spectral parameters free, while the sources at greater distance and up to 25°, had their parameters fixed. A likelihood analysis was performed to fit the parameters using a Minuit optimizer. In the second step, we fixed the nearby source parameters to those fitted in the previous step and ran again the likelihood analysis with the NewMinuit optimizer. In both steps our source of interest had its parameters free, and both Galactic diffuse and isotropic emission parameters were fixed.
These steps were performed as explained in three different analyses: one for the whole period, one for the first gamma-ray flare, and one for the second gamma-ray flare.
2.3. XMM-Newton
In order to best constrain the uncertainty in the absorption as derived from the relatively short Swift observations, we reanalysed archival XMM-Newton observations with the Science Analysis Software5 (SAS) version 14.0.0 following standard prescriptions and corresponding calibration. XMM-Newton pointed at the source on 2001 April 12–2001 April 13 (rev. 246). The total exposure time was 36 714 s.
The European Photon Imaging Camera (EPIC) on board XMM-Newton carries three detectors: MOS1, MOS2 (Turner et al. 2001), and pn (Strüder et al. 2001). The MOS and pn observations were performed in Large Window and Full Frame Mode, respectively, all with a Medium filter. We processed the data with the emproc and epproc tasks; high-background periods were removed by asking that the count rate of high-energy events (E > 10 keV) be less than 0.35 and 0.40 cts s−1 on the MOS and pn detectors, respectively. The final exposure time was about 27–28 ks for the MOS detectors, and about 12 ks for the pn. We extracted source counts from a circular region with 35 arcsec radius and background counts from a source-free circle with 70 arcsec radius. We selected the best-calibrated single and double events only (PATTERN< =4), and rejected events next to the edges of the CCDs or next to bad pixels (FLAG==0). The absence of pile-up was verified with the epatplot task.
We grouped each spectrum with the corresponding background, redistribution matrix (RMF), and ancillary (ARF) files with the task grppha, setting a binning of at least 25 counts for each spectral channel in order to use the chi-squared statistics. The three spectra were analysed with XSPEC version 12.9.0, fitting them all together in the 0.3–10 keV energy range. We adopted a Galactic absorption column of NH = 2.76 × 1020 cm−2 from the LAB survey (Kalberla et al. 2005) and the Wilms et al. (2000) elemental abundances.
The results of power-law fits with both free NH and absorption fixed to the Galactic value, are given in the first row of Table 2. The three spectra are shown in Fig. 2. In contrast with previous findings (Foschini et al. 2006), we did not find any evidence of substantial absorption beside the Galactic value. This discrepancy may be due to a combination of several factors. In particular, we adopted 1) more recent calibration files and Science Analysis System (SAS) software; 2) a different selection of the lower energy bound for the spectral analysis; and 3) a more conservative event selection to avoid periods when high-background flares could contaminate the data. We also tried curved models (log-parabola and broken power law) to check for possible spectral curvature, but found none.
XMM-Newton-EPIC and Swift/XRT observation log and results of fitting the spectra with power-law models.
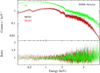 |
Fig. 2. X-ray spectra of 4C +71.07 acquired by the EPIC instrument on board XMM-Newton on 2001 April 12–13. Black, red, and green symbols represent MOS1, MOS2, and pn data, respectively. The folded model, an absorbed power law with NH = 3.30 × 1020 cm−2, is indicated by solid lines of the same colour. The ratio of the data to the folded model is plotted in the bottom panel. |
2.4. Swift
Data from the Neil GehrelsSwift Observatory (Gehrels et al. 2004; Target ID 36376) were collected by activating two dedicated target-of-opportunity (ToO) observations triggered as follow-up of AGILE detections (Bulgarelli et al. 2015; Pittori et al. 2015). The Swift data were processed and analysed by using standard procedures within the FTOOLS software (v6.17) and responses in the calibration database CALDB (20150731).
2.4.1. Swift/XRT
A log of all X-ray Telescope (XRT, Burrows et al. 2005) observations triggered by our ToOs is given in Table 2. The XRT data were collected for the most part in photon-counting (PC) mode and were processed with the XRTPIPELINE (v.0.13.2). A moderate pile-up affected the data, and it was corrected by adopting standard procedures (Vaughan et al. 2006), i.e. by determining the size of the core of the point spread function (PSF) affected by pile-up by comparing the observed and nominal PSF, and excluding from the analysis all the events that fell within that region. The source events were thus extracted from an annulus with outer radius of 20 pixels (1 pixel ∼2.36″) and inner radius of 3 pixels. Background events were extracted from a circular source-free region nearby. Average spectra were extracted from each XRT observation, and from the combined observations for the first ToO (046–053), and were binned to ensure at least 20 counts per energy bin, and fit in the 0.3–10 keV energy range.
We adopted the same spectral models as those used for the XMM-Newton data. The results of power-law fits with both free NH and absorption fixed to the Galactic value, are given in Table 2 and in Fig. 3, panel m, where we show the Swift/XRT (observed 0.3–10 keV) light curve derived with the free NH model in Table 2.
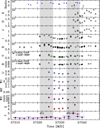 |
Fig. 3. Multi-wavelength light curves for the observing campaign on 4C +71.07. Panel a: GASP-WEBT 5 GHz (black cross), 37 GHz (blue triangles), 86 GHz (red diamonds), and 228 GHz (green squares) data [Jy]. Panels b–h: K, H, J, I, R, V, B bands (open circles, [mJy]). Panels g–l: Swift/UVOT v, b, u, w1, m2, w2 bands (coloured discs, [mJy]). Panel m: Swift/XRT observed 0.3–10 keV flux [10−11 erg cm−2 s−1]. Panel n: AGILE/GRID (blue circles) and Fermi/LAT (red squares) data (E > 100 MeV, [10−6 photons cm−2 s−1]). The grey dashed areas mark the time-interval (F1, MJD 57321.0–57327.0; F2, MJD 57333.0–57339.0) used to accumulate the almost-simultaneous SEDs (orange (AGILE)/green (Fermi) and black(AGILE)/purple (Fermi) symbols, respectively) shown in Fig. 4. |
2.4.2. Swift/UVOT
The UV/Optical Telescope (UVOT, Roming et al. 2005) observed 4C +71.07 simultaneously with the XRT in all optical and UV filters. The data analysis was performed using the UVOTIMSUM and UVOTSOURCE tasks included in the FTOOLS. The latter task calculates the magnitude through aperture photometry within a circular region and applies specific corrections due to the detector characteristics. We adopted circular regions for source (5″ radius) and background (10″ radius). Figure 3 shows the light curves of Swift/UVOT (v, b, u, w1, m2, w2 bands, panels g–l).
2.5. GASP-WEBT
Optical observations for the GASP-WEBT were performed at the following observatories: Abastumani, Belogradchik, Calar Alto6, Crimean, Mt. Maidanak, St. Petersburg, Roque de los Muchachos (LT), Rozhen, Southern Station of SAI, Teide (IAC80), and Astronomical Station Vidojevica. We calibrated the source magnitude with respect to the photometric sequences of Villata et al. (1997) and Doroshenko et al. (2014). Light curves in the Johnson-Cousins bands were carefully assembled. Data scatter was reduced by binning data taken with the same telescope in the same night and by deleting clear outliers; in a few cases an offset with respect to the main trend was detected and corrected by shifting the whole dataset. Near-infrared data in the J band were acquired at the Campo Imperatore Observatory. Millimetric radio data at 86 and 228 GHz were obtained at the IRAM 30 m Telescope on Pico Veleta7 (data calibrated as discussed in Agudo et al. 2018). Other radio data were taken at the Metsähovi and Medicina8 (5 GHz) Observatories.
The R-band light curve shows a well-defined maximum peaking at MJD 57322.5–57324.5 (see Fig. 3), while another peak may have occurred at MJD 57335.5–57336.5, as confirmed by the J-band light curve.
3. Discussion
Our observing campaign allowed us to collect multi-wavelength data covering the two main γ-ray flares detected by AGILE. In particular, the second and most prominent γ-ray flare (F2) has a much richer multi-wavelength coverage, as shown in Fig. 3, including the mm and the near infrared wavelength.
In order to build the spectral energy distribution, we corrected the near-infrared, optical, and UV data for Galactic reddening by adopting a value of 0.083 mag in the Johnson V band (from NED) and the Cardelli et al. (1989) mean extinction laws, with the parameter RV = 3.1, the standard value for the diffuse interstellar medium. Since these laws present a bump at 2175 Å, they were convolved with the filters’ effective areas to derive the reddening correction for the Swift/UVOT bands (see Raiteri et al. 2010, for further details).
Figure 4 shows the spectral energy distribution for the two flares of 4C +71.07 (time intervals as reported in the caption of Fig. 3). The orange and black symbols refer to the AGILE first and second flares, respectively, while green and purple symbols refer to the Fermi first and second flare, respectively. Small grey points are archival data provided by the ASI/ASDC SED Builder Tool (Stratta et al. 2011).
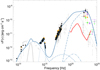 |
Fig. 4. Spectral energy distribution for the two flares (time intervals from Fig. 3). Orange symbols refer to the AGILE data first flare and black symbols to the second, while green and purple symbols refer to the Fermi first and second flare, respectively. Small grey points are archival data. The blue lines represent the overall F2 SED fit (solid line) and each component, namely the synchrotron emission (dashed line), the black-body approximation to the disc emission (dotted line), the synchrotron self-Compton emission (SSC, dash-dotted line), the external Compton emission off the disc (dash-triple-dot line), and the external Compton emission off the broad-line region (long-dashed line). The light grey solid and dotted lines represent the torus and the external Compton emission off the torus photons, respectively. The red curve represents the e-ASTROGAM sensitivity for an integration time of 6 days (comparable to the AGILE and Fermi integration time for the spectral analysis). |
The data show not only the typical double-humped shape of the blazar SED, but also a prominent disc bump peaking in the UV energy band. Moreover, while the rising branch of the inverse Compton, the disc, and the poorly constrained synchrotron emission (but only marginally) are almost consistent with the non-simultaneous data (grey points), the high-energy peak (E > 100 MeV) is about one order of magnitude more intense with respect to the archival ones.
In order to model the SED, we took into account a one-zone leptonic model. The emission along the jet is assumed to be produced in a spherical blob with co-moving radius Rblob by accelerated electrons characterised by a broken power-law particle density distribution,
 (1)
(1)
where γ is the electron Lorentz factor varying between 20 < γ < 5 × 10³, αl and αh are the pre- and post-break electron distribution spectral indices, respectively, and γb is the break energy Lorentz factor. We assume that the blob contains a homogeneous magnetic field B and that it moves with a bulk Lorentz factor Γ at an angle Θ0 with respect to the line of sight. The relativistic Doppler factor is δ = [Γ (1 − β cos Θ0)]−1, where β is the blob bulk speed in units of the speed of light. Our assumed and best fit parameters are listed in Table 3.
Parameters for the second flare (F2) SED model.
Our modelling of the 4C +71.07 high-energy emission is based on an inverse Compton (IC) model with three main sources of external seed photons. The first source is the accretion disc characterised by a black-body spectrum peaking in the UV with a bolometric luminosity Ld for an IC-scattering blob at a distance zjet from the central part of the disc. The value of the black hole mass is based on the value computed by Tagliaferri et al. (2015), MBH = 5 × 10⁹M⊙. From Raiteri et al. (2014) we can approximate the disc luminosity to Ld ≈ 2.2 × 1047 erg s−1 and Td ≈ 3 × 10⁴°K, computed by means of a black-body approximation of the disc model. Moreover, we assume the bulk Lorentz factor Γ = 20 similar to the value reported in Paliya (2015). Our almost-simultaneous data marginally sample the synchrotron component of the SED, preventing us from deriving additional constraints from this portion of the SED.
Almost-simultaneous SEDs were previously modelled by Ghisellini et al. (2010) and Tagliaferri et al. (2015) in different emission states. We base our assumed parameters on those derived by these authors. In particular, we fix zjet = 1 × 1018 cm (distance from the central black hole at which the emission takes place, intermediate between the values reported in the cited references); this is to be compared with rs = 2GM/c2 ≈ 1.5 × 1015 cm.
The second source of external seed photons is the broad-line region, placed at a distance from the central black hole of RBLR ≈ 1.6 × 1018 cm, and assumed to reprocess fBLR = 3% of the irradiating continuum (obtained by considering a BLR cloud-coverage factor of 30% and a 10% reflectivity factor for each single cloud). Given the relative locations of the disc, the emitting blob, and the BLR, we consider disc photons entering the blob from behind (therefore de-boosted), while the BLR photons can be considered isotropic within RBLR in the source frame (head-on, hence boosted, see Dermer & Schlickeiser 1994).
The third source of external seed photons is the dusty torus, assumed to be located at a distance of RTorus ≈ 1019 cm, emitting in the infrared energy range with TTorus ≈ 100 °K and assumed to reprocess a fraction fTorus = 50% of the irradiating continuum.
Figure 4 shows the overall SED fit (solid line) and each component, namely the synchrotron emission (dashed line), the thermal disc emission (dotted line), the synchrotron self-Compton emission (SSC, dash-dotted line), the external Compton emission off the disc (dash-triple-dot line), the external Compton emission off the broad-line region (long-dashed line), the infrared torus (light grey solid line), and the external Compton emission off the torus photons (light grey dotted lines). Figure 4 clearly shows how the Compton part of the spectrum dominates over the synchrotron and the thermal parts.
The energetics of 4C +71.07 can be computed by estimating the isotropic luminosity in the γ-ray energy band,  . For a given source with redshift z, the isotropic emitted luminosity in an energy band can be computed following Vercellone et al. (2010). Using the observed γ-ray flux and photon index for the second flare labelled F2 (see Table 1), for E > 100 MeV we obtain
  , while the Eddington luminosity is LEdd ≈ 6 × 1047 erg s−1 (implying Ld/LEdd ∼ 0.3). We can define the total power carried in the jet, Pjet, following Ghisellini & Celotti (2001) as
 (2)
(2)
where PB, Pp, Pe, and  are the power carried by the magnetic field, the cold protons, the relativistic electrons, and the produced radiation, respectively. In order to compute the different components, we use the formalism presented in Celotti & Ghisellini (2008). Including the counter-jet contribution, we obtain PB ≈ 3 × 1045 erg s−1, Pe ≈ 6.2 × 1045 erg s−1, Pp ≈ 2.1 × 1047 erg s−1,
  , which yields Pjet ≈ 4 × 1047 erg s−1.
Alternatively, we can estimate the jet power following Zdziarski et al. (2015), Pjet ≈ 1.3 (η/0.2)Ṁc2 ≈ 1.43 × 1048 erg s−1, assuming Ṁ ≈ Ld/(ηc2), η = 0.3, and Ld = 2.2 × 1047 erg s−1. Combining this result with the previous one, we obtain that the jet power is in the range (0.4–1.4) × 1048 erg s−1.
The study of high-redshift blazars has a strong impact on cosmology providing crucial information about i) the formation and growth of super-massive black holes, ii) the connection between the jet and the central engine, and iii) the role of the jet in the feedback occurring in the host galaxies (Volonteri et al. 2011).
Recent hard X-ray surveys (Ajello et al. 2009, 2012; Ghisellini et al. 2010) have been demonstrated to be more effective in detecting high-redshift blazars compared to γ-ray surveys. The main reason is that the SEDs of these sources peak in the MeV region and detection becomes a difficult task for γ-ray instruments.
In this context, the e-ASTROGAM mission (proposed as a medium-sized mission in the ESA M5 call, De Angelis et al. 2017) will have a great potential in detecting these blazars taking advantage of its soft γ-ray band (0.3–3000 MeV) as compared with AGILE and Fermi, with a sensitivity in the energy range 1–10 MeV more than one order of magnitude better with respect to COMPTEL. In Fig. 4 is reported the e-ASTROGAM extra-galactic sensitivity for an integration time of 6 days, comparable to the AGILE integration time during the γ-ray flares. We can appreciate the e-ASTROGAM excellent performance in detecting this kind of object, providing crucial information both in the rising of the inverse Compton energy range and at its peak. High-redshift sources should have high accretion rates, close to the Eddington limit, yielding high Compton dominance (≈100 in 4C +71.07). The e-ASTROGAM satellite will substantially advance our knowledge of MeV blazars up to redshift z = 4.5, with implications for blazar physics, cosmology, and the study of both the extra-galactic background light and the inter-galactic magnetic field. These observations will be invaluable and complementary to the data from ATHENA (Barcons et al. 2017) for the study of super-massive black holes with the possibility to investigate how the two populations of AGNs (radio-quiet and radio-loud) evolve with redshift.
4. Conclusions
In this paper we presented the almost-simultaneous data collected on the high-redshift flat-spectrum radio quasar 4C +71.07. The AGILE, Fermi/LAT, Swift, and GASP-WEBT data allowed us to investigate both the non-thermal emission originating from the jet emerging from the central black hole and the properties of the γ-ray emitting region. We find that the data collected in our observing campaign can be modelled by means of a simple one-zone leptonic model with the emission zone within the broad-line region. Moreover, we discussed how this class of sources might be suitable candidates for the proposed e-ASTROGAM γ-ray mission.
For more information and details about IRFs, see the Fermi instrumental publications.
Calar Alto data were acquired as part of the MAPCAT project: https://www.iaa.csic.es/~iagudo/_iagudo/MAPCAT.html
IRAM 30 m telescope data were acquired as part of the POLAMI programme: http://polami.iaa.es
Operated by INAF–Istituto di Radioastronomia.
Acknowledgments
We thank the referee for the very constructive comments, which helped substantially improve the manuscript. AGILE is an ASI space mission developed with programmatic support by INAF and INFN. We acknowledge partial support through the ASI grant no. I/028/12/0. SV and PR acknowledge contract ASI-INAF I/004/11/0 and INAF/IASF Palermo where most of the work was carried out. SV acknowledges financial contribution from the agreement ASI-INAF no. 2017-14-H.0. Part of this work is based on archival data, software, or online services provided by the ASI SPACE SCIENCE DATA CENTER (ASI-SSDC). SV and PR thank Leonardo Barzaghi and Sara Baitieri for useful discussions. The Osservatorio di Torino team acknowledges the financial contribution from the agreement ASI-INAF No. 2017-14-H.0 and from the contract PRIN-SKA-CTA-INAF 2016. OMK acknowledges financial support from the Shota Rustaveli National Science Foundation under contract FR/217950/16 and grants NSFC11733001, NSFCU1531245. IA acknowledges support from a Ramón y Cajal grant of the Ministerio de Economía y Competitividad (MINECO) of Spain. The research at the IAA–CSIC was supported in part by the MINECO through grants AYA2016–80889–P, AYA2013–40825–P, and AYA2010–14844, and by the regional government of Andalucía through grant P09–FQM–4784. IRAM is supported by INSU/CNRS (France), MPG (Germany), and IGN (Spain). Calar Alto Observatory is jointly operated by the MPIA and the IAA-CSIC. This research was partially supported by the Bulgarian National Science Fund of the Ministry of Education and Science under grant DN 08-1/2016. The St. Petersburg University team acknowledges support from Russian Science Foundation grant 17-12-01029. AZT-24 observations are made within an agreement among the Pulkovo, Rome, and Teramo observatories. GD and OV gratefully acknowledge the observing grant support from the Institute of Astronomy and Rozhen National Astronomical Observatory, Bulgaria Academy of Sciences, via bilateral joint research project “Observations of ICRF radio-sources visible in optical domain” (PI G. Damljanovic). This work is a part of Project No. 176011 (“Dynamics and kinematics of celestial bodies and systems”), No. 176004 (“Stellar physics”) and No. 176021 (“Visible and invisible matter in nearby galaxies: theory and observations”) supported by the Ministry of Education, Science, and Technological Development of the Republic of Serbia. The Maidanak Observatory team acknowledges support from Uzbekistan Academy of Sciences grants No. F2-FA-F027 and F.4-16.
References
- Acero, F., Ackermann, M., Ajello, M., et al. 2015, ApJS, 218, 23 [Google Scholar]
- Ackermann, M., Anantua, R., Asano, K., et al. 2016, ApJ, 824, L20 [NASA ADS] [CrossRef] [Google Scholar]
- Agudo, I., Thum, C., Molina, S. N., et al. 2018, MNRAS, 474, 1427 [NASA ADS] [CrossRef] [Google Scholar]
- Aharonian, F., Akhperjanian, A. G., Bazer-Bachi, A. R., et al. 2007, ApJ, 664, L71 [Google Scholar]
- Ajello, M., Costamante, L., Sambruna, R. M., et al. 2009, ApJ, 699, 603 [NASA ADS] [CrossRef] [Google Scholar]
- Ajello, M., Shaw, M. S., Romani, R. W., et al. 2012, ApJ, 751, 108 [NASA ADS] [CrossRef] [Google Scholar]
- Akyuz, A., Thompson, D. J., Donato, D., et al. 2013, A&A, 556, A71 [NASA ADS] [CrossRef] [EDP Sciences] [Google Scholar]
- Barcons, X., Barret, D., Decourchelle, A., et al. 2017, Astron. Nachr., 338, 153 [NASA ADS] [CrossRef] [Google Scholar]
- Bulgarelli, A., Chen, A. W., Tavani, M., et al. 2012, A&A, 540, A79 [NASA ADS] [CrossRef] [EDP Sciences] [Google Scholar]
- Bulgarelli, A., Trifoglio, M., Gianotti, F., et al. 2014, ApJ, 781, 19 [NASA ADS] [CrossRef] [Google Scholar]
- Bulgarelli, A., Lucarelli, F., Verrecchia, F., et al. 2015, ATel, 8223, 1 [NASA ADS] [Google Scholar]
- Burrows, D. N., Hill, J. E., Nousek, J. A., et al. 2005, Space Sci. Rev., 120, 165 [NASA ADS] [CrossRef] [Google Scholar]
- Cardelli, J. A., Clayton, G. C., & Mathis, J. S. 1989, ApJ, 345, 245 [NASA ADS] [CrossRef] [Google Scholar]
- Celotti, A., & Ghisellini, G. 2008, MNRAS, 385, 283 [NASA ADS] [CrossRef] [Google Scholar]
- De Angelis, A., Tatischeff, V., Tavani, M., et al. 2017, Exp. Astron., 44, 25 [NASA ADS] [CrossRef] [Google Scholar]
- Dermer, C. D., & Schlickeiser, R. 1994, ApJS, 90, 945 [NASA ADS] [CrossRef] [Google Scholar]
- Doroshenko, V. T., Efimov, Y. S., Borman, G. A., & Pulatova, N. G. 2014, Astrophysics, 57, 30 [NASA ADS] [CrossRef] [Google Scholar]
- Feroci, M., Costa, E., Soffitta, P., et al. 2007, Nucl. Instrum. Methods Phys. Res. A, 581, 728 [Google Scholar]
- Foschini, L., Ghisellini, G., Raiteri, C. M., et al. 2006, A&A, 453, 829 [NASA ADS] [CrossRef] [EDP Sciences] [Google Scholar]
- Gehrels, N., Chincarini, G., Giommi, P., et al. 2004, ApJ, 611, 1005 [NASA ADS] [CrossRef] [Google Scholar]
- Ghisellini, G., & Celotti, A. 2001, MNRAS, 327, 739 [NASA ADS] [CrossRef] [Google Scholar]
- Ghisellini, G., Della Ceca, R., Volonteri, M., et al. 2010, MNRAS, 405, 387 [NASA ADS] [Google Scholar]
- Giuliani, A., Chen, A., Mereghetti, S., et al. 2004, Mem. Soc. Astron. It. Suppl., 5, 135 [Google Scholar]
- Hartman, R. C., Bertsch, D. L., Bloom, S. D., et al. 1999, ApJS, 123, 79 [NASA ADS] [CrossRef] [Google Scholar]
- Kalberla, P. M. W., Burton, W. B., Hartmann, D., et al. 2005, A&A, 440, 775 [NASA ADS] [CrossRef] [EDP Sciences] [Google Scholar]
- Labanti, C., Marisaldi, M., Fuschino, F., et al. 2009, Nucl. Instrum. Methods Phys. Res. A, 598, 470 [Google Scholar]
- Mattox, J. R., Bertsch, D. L., Chiang, J., et al. 1996, ApJ, 461, 396 [NASA ADS] [CrossRef] [Google Scholar]
- Myers, S. T., Jackson, N. J., Browne, I. W. A., et al. 2003, MNRAS, 341, 1 [NASA ADS] [CrossRef] [Google Scholar]
- Paliya, V. S. 2015, ApJ, 804, 74 [NASA ADS] [CrossRef] [Google Scholar]
- Perotti, F., Fiorini, M., Incorvaia, S., Mattaini, E., & Sant’Ambrogio, E. 2006, Nucl. Instrum. Methods Phys. Res. A, 556, 228 [Google Scholar]
- Pittori, C. 2013, Nucl. Phys. B Proc. Suppl., 239, 104 [Google Scholar]
- Pittori, C., Verrecchia, F., Lucarelli, F., et al. 2015, ATel, 8266, 1 [NASA ADS] [Google Scholar]
- Planck Collaboration XIII. 2016, A&A, 594, A13 [NASA ADS] [CrossRef] [EDP Sciences] [Google Scholar]
- Prest, M., Barbiellini, G., Bordignon, G., et al. 2003, Nucl. Instrum. Methods Phys. Res. A, 501, 280 [Google Scholar]
- Raiteri, C. M., Villata, M., Bruschini, L., et al. 2010, A&A, 524, A43 [NASA ADS] [CrossRef] [EDP Sciences] [Google Scholar]
- Raiteri, C. M., Villata, M., D’Ammando, F., et al. 2013, MNRAS, 436, 1530 [NASA ADS] [CrossRef] [Google Scholar]
- Raiteri, C. M., Villata, M., Carnerero, M. I., et al. 2014, MNRAS, 442, 629 [NASA ADS] [CrossRef] [Google Scholar]
- Roming, P. W. A., Kennedy, T. E., Mason, K. O., et al. 2005, Space Sci. Rev., 120, 95 [NASA ADS] [CrossRef] [Google Scholar]
- Sambruna, R. M., Tavecchio, F., Ghisellini, G., et al. 2007, ApJ, 669, 884 [NASA ADS] [CrossRef] [Google Scholar]
- Stickel, M., & Kuehr, H. 1993, A&AS, 100, 395 [NASA ADS] [Google Scholar]
- Stratta, G., Capalbi, M., Giommi, P., et al. 2011, ArXiv e-prints [arXiv:1103.0749] [Google Scholar]
- Strüder, L., Briel, U., Dennerl, K., et al. 2001, A&A, 365, L18 [NASA ADS] [CrossRef] [EDP Sciences] [Google Scholar]
- Tagliaferri, G., Ghisellini, G., Perri, M., et al. 2015, ApJ, 807, 167 [NASA ADS] [CrossRef] [Google Scholar]
- Tavani, M., Barbiellini, G., Argan, A., et al. 2009, A&A, 502, 995 [NASA ADS] [CrossRef] [EDP Sciences] [Google Scholar]
- Turner, M. J. L., Abbey, A., Arnaud, M., et al. 2001, A&A, 365, L27 [NASA ADS] [CrossRef] [EDP Sciences] [Google Scholar]
- Urry, C. M., & Padovani, P. 1995, PASP, 107, 803 [NASA ADS] [CrossRef] [Google Scholar]
- Vaughan, S., Goad, M. R., Beardmore, A. P., et al. 2006, ApJ, 638, 920 [NASA ADS] [CrossRef] [Google Scholar]
- Vercellone, S., Chen, A. W., Giuliani, A., et al. 2008, ApJ, 676, L13 [NASA ADS] [CrossRef] [Google Scholar]
- Vercellone, S., D’Ammando, F., Vittorini, V., et al. 2010, ApJ, 712, 405 [NASA ADS] [CrossRef] [Google Scholar]
- Vercellone, S., Romano, P., Raiteri, C. M., et al. 2015a, ATel, 8229, 1 [NASA ADS] [Google Scholar]
- Vercellone, S., Romano, P., Raiteri, C. M., et al. 2015b, ATel, 8271, 1 [NASA ADS] [Google Scholar]
- Villata, M., Raiteri, C. M., Ghisellini, G., et al. 1997, A&AS, 121, 119 [NASA ADS] [CrossRef] [EDP Sciences] [Google Scholar]
- Villata, M., Raiteri, C. M., Larionov, V. M., et al. 2008, A&A, 481, L79 [NASA ADS] [CrossRef] [EDP Sciences] [Google Scholar]
- Volonteri, M., Haardt, F., Ghisellini, G., & Della Ceca, R. 2011, MNRAS, 416, 216 [NASA ADS] [Google Scholar]
- Wilms, J., Allen, A., & McCray, R. 2000, ApJ, 542, 914 [NASA ADS] [CrossRef] [Google Scholar]
- Zdziarski, A. A., Sikora, M., Pjanka, P., & Tchekhovskoy, A. 2015, MNRAS, 451, 927 [NASA ADS] [CrossRef] [Google Scholar]
All Tables
XMM-Newton-EPIC and Swift/XRT observation log and results of fitting the spectra with power-law models.
All Figures
|
Fig. 1. AGILE-GRID (blue circles) and Fermi/LAT (red squares) light curves (48 h-bins) covering the period 2015 October 15–2015 November 15. Downward arrows represents 2σ upper limits. The grey dashed areas mark the time interval used to accumulate the almost-simultaneous SEDs. |
| In the text | |
|
Fig. 2. X-ray spectra of 4C +71.07 acquired by the EPIC instrument on board XMM-Newton on 2001 April 12–13. Black, red, and green symbols represent MOS1, MOS2, and pn data, respectively. The folded model, an absorbed power law with NH = 3.30 × 1020 cm−2, is indicated by solid lines of the same colour. The ratio of the data to the folded model is plotted in the bottom panel. |
| In the text | |
|
Fig. 3. Multi-wavelength light curves for the observing campaign on 4C +71.07. Panel a: GASP-WEBT 5 GHz (black cross), 37 GHz (blue triangles), 86 GHz (red diamonds), and 228 GHz (green squares) data [Jy]. Panels b–h: K, H, J, I, R, V, B bands (open circles, [mJy]). Panels g–l: Swift/UVOT v, b, u, w1, m2, w2 bands (coloured discs, [mJy]). Panel m: Swift/XRT observed 0.3–10 keV flux [10−11 erg cm−2 s−1]. Panel n: AGILE/GRID (blue circles) and Fermi/LAT (red squares) data (E > 100 MeV, [10−6 photons cm−2 s−1]). The grey dashed areas mark the time-interval (F1, MJD 57321.0–57327.0; F2, MJD 57333.0–57339.0) used to accumulate the almost-simultaneous SEDs (orange (AGILE)/green (Fermi) and black(AGILE)/purple (Fermi) symbols, respectively) shown in Fig. 4. |
| In the text | |
|
Fig. 4. Spectral energy distribution for the two flares (time intervals from Fig. 3). Orange symbols refer to the AGILE data first flare and black symbols to the second, while green and purple symbols refer to the Fermi first and second flare, respectively. Small grey points are archival data. The blue lines represent the overall F2 SED fit (solid line) and each component, namely the synchrotron emission (dashed line), the black-body approximation to the disc emission (dotted line), the synchrotron self-Compton emission (SSC, dash-dotted line), the external Compton emission off the disc (dash-triple-dot line), and the external Compton emission off the broad-line region (long-dashed line). The light grey solid and dotted lines represent the torus and the external Compton emission off the torus photons, respectively. The red curve represents the e-ASTROGAM sensitivity for an integration time of 6 days (comparable to the AGILE and Fermi integration time for the spectral analysis). |
| In the text | |
Current usage metrics show cumulative count of Article Views (full-text article views including HTML views, PDF and ePub downloads, according to the available data) and Abstracts Views on Vision4Press platform.
Data correspond to usage on the plateform after 2015. The current usage metrics is available 48-96 hours after online publication and is updated daily on week days.
Initial download of the metrics may take a while.