Free Access
Fig. 1.
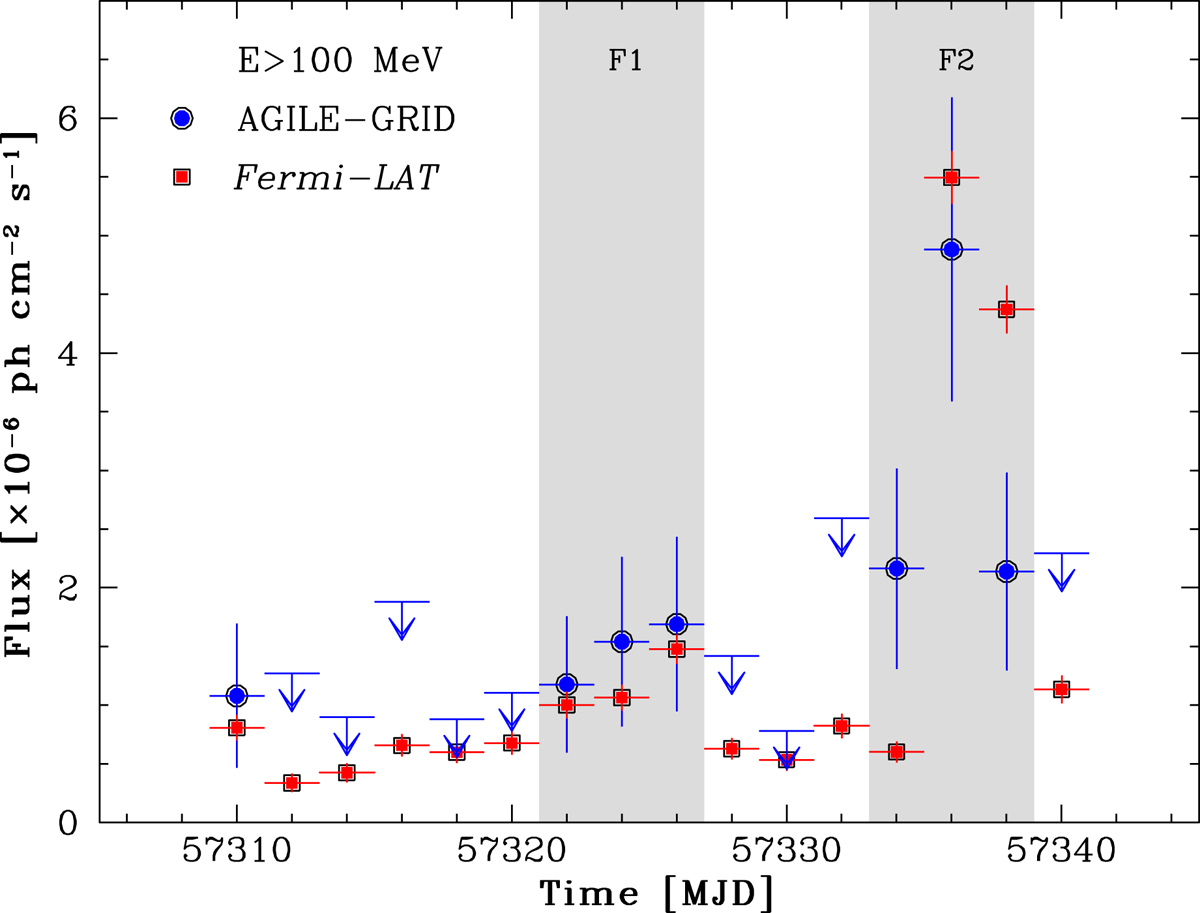
AGILE-GRID (blue circles) and Fermi/LAT (red squares) light curves (48 h-bins) covering the period 2015 October 15–2015 November 15. Downward arrows represents 2σ upper limits. The grey dashed areas mark the time interval used to accumulate the almost-simultaneous SEDs.
Current usage metrics show cumulative count of Article Views (full-text article views including HTML views, PDF and ePub downloads, according to the available data) and Abstracts Views on Vision4Press platform.
Data correspond to usage on the plateform after 2015. The current usage metrics is available 48-96 hours after online publication and is updated daily on week days.
Initial download of the metrics may take a while.