Fig. 3.
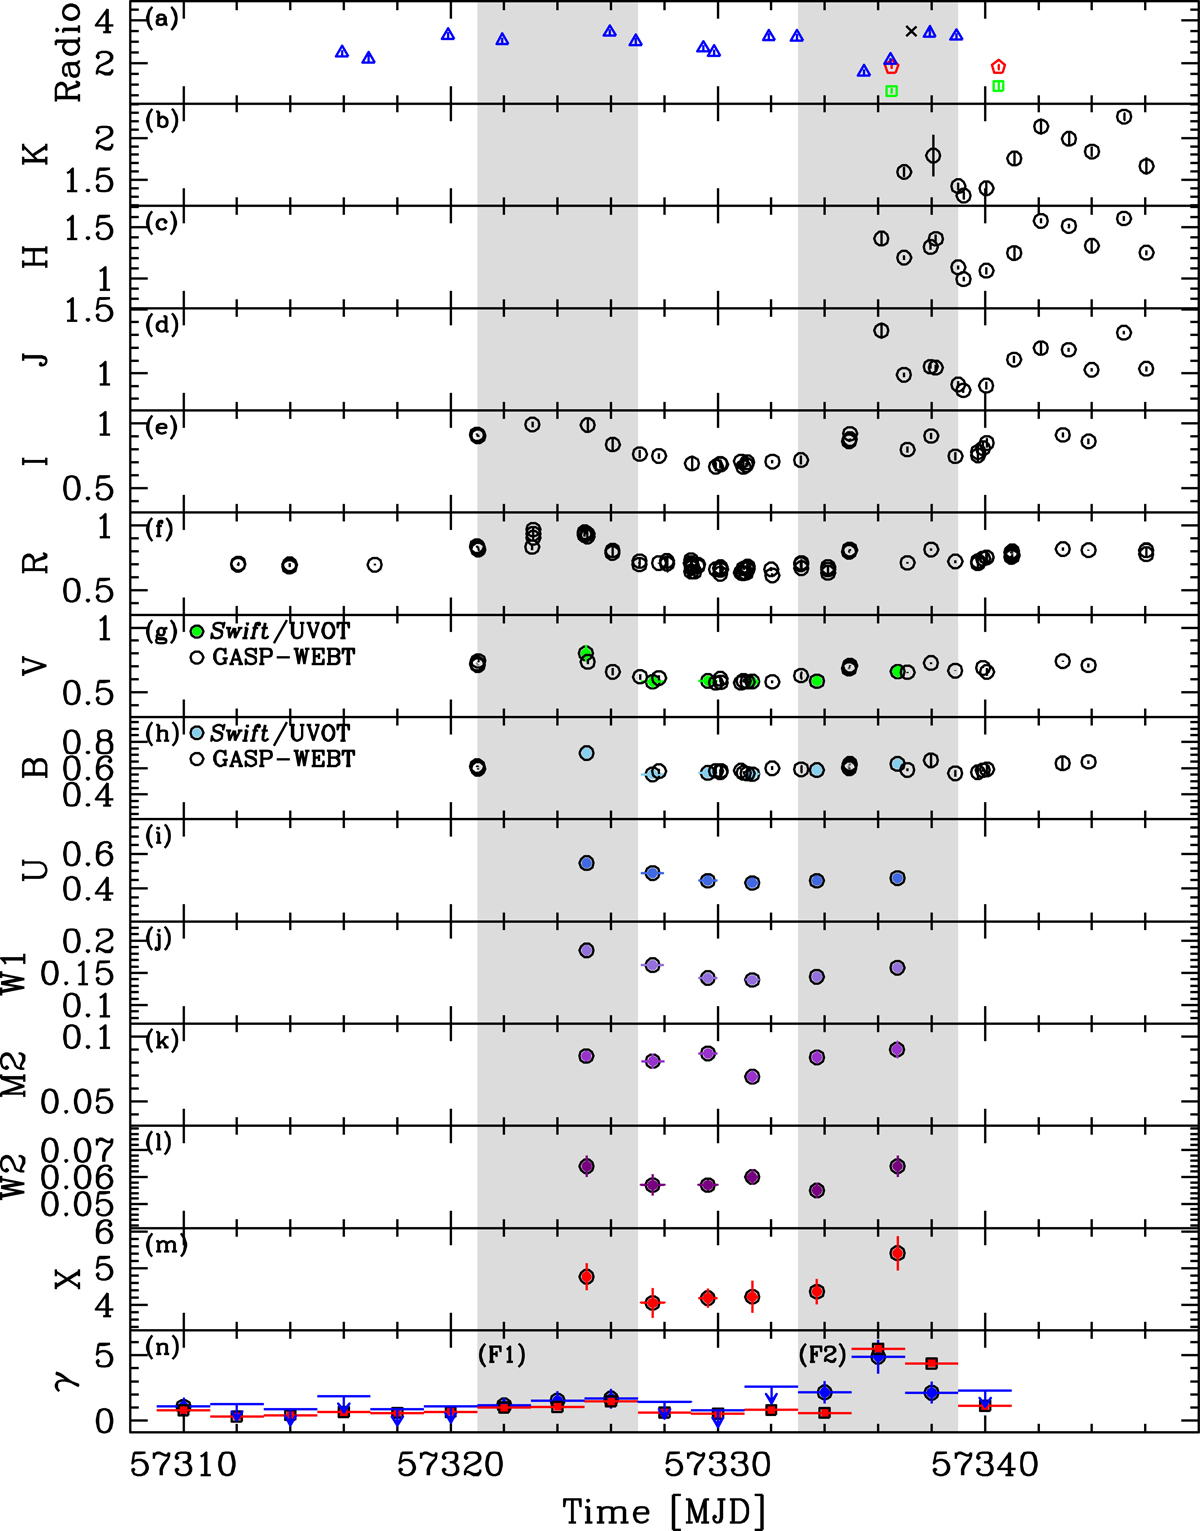
Multi-wavelength light curves for the observing campaign on 4C +71.07. Panel a: GASP-WEBT 5 GHz (black cross), 37 GHz (blue triangles), 86 GHz (red diamonds), and 228 GHz (green squares) data [Jy]. Panels b–h: K, H, J, I, R, V, B bands (open circles, [mJy]). Panels g–l: Swift/UVOT v, b, u, w1, m2, w2 bands (coloured discs, [mJy]). Panel m: Swift/XRT observed 0.3–10 keV flux [10−11 erg cm−2 s−1]. Panel n: AGILE/GRID (blue circles) and Fermi/LAT (red squares) data (E > 100 MeV, [10−6 photons cm−2 s−1]). The grey dashed areas mark the time-interval (F1, MJD 57321.0–57327.0; F2, MJD 57333.0–57339.0) used to accumulate the almost-simultaneous SEDs (orange (AGILE)/green (Fermi) and black(AGILE)/purple (Fermi) symbols, respectively) shown in Fig. 4.
Current usage metrics show cumulative count of Article Views (full-text article views including HTML views, PDF and ePub downloads, according to the available data) and Abstracts Views on Vision4Press platform.
Data correspond to usage on the plateform after 2015. The current usage metrics is available 48-96 hours after online publication and is updated daily on week days.
Initial download of the metrics may take a while.