| Issue |
A&A
Volume 620, December 2018
|
|
|---|---|---|
| Article Number | A188 | |
| Number of page(s) | 6 | |
| Section | Atomic, molecular, and nuclear data | |
| DOI | https://doi.org/10.1051/0004-6361/201834303 | |
| Published online | 14 December 2018 | |
Electron-impact double ionization of the carbon atom⋆
Institute of Theoretical Physics and Astronomy Vilnius University, Saulėtekio Av. 3, 10257
Vilnius, Lithuania
e-mail: This email address is being protected from spambots. You need JavaScript enabled to view it.
Received:
22
September
2018
Accepted:
28
October
2018
Abstract
Electron-impact single- and double-ionization cross sections and Maxwellian rate coefficients are presented for the carbon atom. Scaling factors are introduced for the electron-impact excitation and ionization cross sections obtained in the distorted wave (DW) approximation. It is shown that the scaled DW cross sections provide good agreement with measurements for the single ionization of the C atom and C1+ ion. The direct double-ionization (DDI) process is studied using a multi-step approach. Ionization–ionization, excitation–ionization–ionization, and ionization–excitation–ionization branches are analyzed. It is demonstrated that the three-step processes contribute ≼40% of the total DDI cross sections for the case where one of the electrons takes all of the excess energy after the first ionization process.
Key words: atomic data / atomic processes
Tables 1–12 are only available at the CDS via anonymous ftp to cdsarc.u-strasbg.fr (130.79.128.5) or via http://cdsarc.u-strasbg.fr/viz-bin/qcat?J/A+A/620/A188
© ESO 2018
1. Introduction
The structure of the emission spectra from astrophysical sources depends on charge-state distribution. The charge-state distribution is important in predicting electron temperature, electron density, and elemental abundance (Brickhouse 1996; Bryans et al. 2009). The electron-impact ionization and recombination define the ion fraction in the collisionally ionized plasmas. The electron collisions affect emission from stellar coronae, supernova remnants, galaxies, and galaxy clusters. The single ionization (SI) is the strongest process among the ionization processes. On the other hand, multiple ionization can be important in the dynamic environments where high-energy electrons can suddenly appear on the scene (Müller 1986; Hahn & Savin 2015).
Carbon is the fourth most abundant element in the universe after hydrogen, helium, and oxygen. Studies of carbon emission spectra provide crucial information for many fields of astrophysics. However, these studies require accurate atomic data. The first experimental data for electron-impact ionization of neutral carbon were presented by Brook et al. (1978). Other measurements for C are available from Barnett et al. (1977) where results obtained by Wang & Crawford (1971) are presented.
There are no studies of the double ionization (DI) by electron impact for the carbon atom. Therefore, the aim of the current work is to provide the electron-impact DI cross sections and Maxwellian rate coefficients for neutral carbon. A multi-step approach is applied for the direct double-ionization (DDI) studies. In addition, SI by electron impact is investigated for the C atom and C1+ ion in this work since the ionization and excitation processes are used to obtain the DDI cross sections.
A multi-step approach was previously applied to study DDI in various elements (Jonauskas et al. 2014; Koncevičiūtė & Jonauskas 2016; Koncevičiūtė et al. 2018). It was proposed to consider ionization–ionization (II), excitation–ionization–ionization (EII), and ionization–excitation–ionization (IEI) branches, which lead to DI of an atomic system. The electron-impact ionization and excitation were investigated using the distorted wave (DW) approximation. Unfortunately, it is well known that the DW approximation often overestimates cross sections for neutral atoms or near neutral ions. Therefore, scaled plane-wave Born (PWB) cross sections for electron-impact excitation were introduced to reach a better agreement with measurements (Kim 2001). It was suggested that proposed scaling mimics the effects related to polarizability of a target. In addition, it is a simple way to account for the electron exchange, distortion and polarization effects that are missing in the first-order PWB approximation (Kim 2001). A combination of binary-encounter-dipole (BED) or binary-encounter Bethe (BEB) models (Kim & Rudd 1994) with the scaled PWB cross sections (Kim 2001) provided a good agreement with experimental data for the studied atoms and ions (Kim 2001; Kim & Desclaux 2002; Kwon et al. 2005, 2006). In this work, the scaling factors are used to diminish the DW cross sections for the electron-impact ionization and excitation processes. The different factors are applied for these processes. In addition, different scaling is used for the ionization in the C atom and C1+ ion.
The paper is organized as follows. In Sect. 2, the theoretical methods used to calculate cross sections are outlined. In Sect. 3, the results are presented and discussed, and in Sect. 4 some final conclusions are provided.
2. Theoretical methods
We investigated energy levels, radiative and Auger transition probabilities, and electron-impact excitation and ionization cross sections using Fexible Atomic Code (FAC; Gu 2008) which implements the Dirac–Fock–Slater approach. We also used the DW approximation to study the electron-impact excitation and ionization processes. The study was performed in the potentials of the ionizing and ionized ion. The single configuration approximation was used in this work. This means that the configuration interaction among the configuration state functions of the same configuration was included.
Direct and indirect processes determine the DI cross sections. The cross sections for transition from the level i of the carbon atom to the level f of the C2+ ion are expressed by the equation
 (1)
(1)
where ε is the energy of the incident electron, and  is the cross section for the direct part of DI. Also, the second term corresponds to the electron-impact ionization with subsequent autoionization and
  is the cross section of the direct single collisional ionization (CI). Autoionization branching ratio defines radiative damping of the CI cross sections:
 (2)
(2)
where Aa and Ar are the Auger and radiative transition probabilities, respectively. Therefore, only contributions from the levels above the DI threshold were taken into account.
The DDI process was studied using a multi-step approach which involves II, EII, and IEI branches. The cross sections for the II branch corresponding to transition from the level i to the level f are given by equation
 (3)
(3)
where ε1 is the energy of the scattered or ejected electron. One of these electrons participates in the further ionization of the nl shell with the  probability.
  is the mean distance of the nl shell electron from the nucleus. The summation in Eq. (3) was performed over all energy levels of the C1+ ion. These energy levels correspond to configurations produced by removal of the bound electron from the ground configuration of neutral carbon.
The DDI EII branch includes three sequential transitions - excitation with the subsequent DI:
 (4)
(4)
Here ε1 = ε − ΔEik
, ΔEik is a transition energy, ε2 is the energy of the scattered or ejected electron and  is the electron-impact excitation cross section.
The DDI IEI branch is determined by ionization with subsequent excitation by the ejected or scattered electrons followed by the electron-impact ionization
 (5)
(5)
The term  defines the excitation probability from the level k to the level j at the electron energy ε1.
It should be noted that two different situations for energy distribution between the scattered and ejected electrons after the first ionization process (the first step in II and IEI, the second step in EII) are considered in this work. In one case, the electrons share the excess energy equally. In the other case, one of the electrons takes all the excess energy and participates in the further excitation or ionization process. It was demonstrated that one of the electrons tends to take all the excess energy at the lower energies of the incident electron while the electrons share this energy for the higher energies (Jonauskas et al. 2014).
Our study of the DDI cross sections in a multi-step model includes electron-impact excitation and ionization. Reliable data for these processes are needed for the DDI studies. Therefore, the SI cross sections for the neutral carbon and C1+ ion are investigated.
Single ionization from the level i to the level f is determined by summing the direct and indirect processes:
 (6)
(6)
The second term describes electron-impact excitation with subsequent autoionization.
The scaled cross sections for electron-impact excitation are obtained using the following equation (Kim 2001)
 (7)
(7)
where εb is the bounding energy of the electron. The scaling for the direct ionization cross sections of carbon is expressed by the equation
 (8)
(8)
where I is the ionization energy, and εk is the kinetic energy of the bound electron. The other scaling factor is used for the C1+ ion:
 (9)
(9)
In this case, the kinetic energy is omitted in the denominator.
3. Results
The ground 1s22s22p2 configuration of the carbon atom consists of five levels. The theoretical splitting of the levels is equal to 3.80 eV while NIST provides a value of 2.68 eV (Kramida et al. 2018). The difference can be explained by an importance of correlation effects that are not considered in the current work. What is more, the SI threshold of 10.56 eV is slightly below the NIST value of 11.26 eV. For the C1+ ion, the theoretical SI threshold of 23.84 eV is also lower than the NIST recommended value of 24.38 eV. Other ions were seen to show a similar tendency for the FAC ionization thresholds to those of the NIST data; that is, Li+ (Koncevičiūtė & Jonauskas 2016), Se2+ (Koncevičiūtė et al. 2018), Se3+ (Pakalka et al. 2018), W27+ (Jonauskas et al. 2015), W26+ (Kynienė et al. 2015), and W25+ (Kynienė et al. 2016). Finally, the theoretical DI threshold of 34.40 eV is lower than the NIST value of 35.64 eV.
The SI cross sections for the C atom were calculated using the DW approximation. This study was performed in the potentials of the ionizing and ionized ions. The obtained cross sections are compared to experimental data in Fig. A.1. Two measurements for the C atom are currently available (Wang & Crawford 1971; Brook et al. 1978). The experiment from Wang & Crawford (1971) is not published but has been presented by Barnett et al. (1977). An accuracy of ±30% was considered for these data (Brook et al. 1978). The theoretical values obtained in the potential of the ionizing ion are within the error bars of the first experiment (Wang & Crawford 1971) at the peak of the cross sections and higher energies of the incident electron. Unfortunately, a large difference is observed between the theoretical values and both measurements on the low-energy side. Even the direct ionization cross sections of the SI process are above the ionization threshold in this energy region.
Both theoretical cross sections are well above the latest experimental data (Brook et al. 1978). The only exception is the high-energy side where theoretical values obtained in the potential of the ionizing ion are in good agreement with measurements. On the other hand, it is a well-known fact that the DW approximation provides overestimated values for atoms and near-neutral ions. Kim & Rudd (1994) proposed the BED and BEB models for direct ionization. Later, the scaled PWB approximation was suggested for the excitation cross sections (Kim 2001). These approaches resulted in very good agreement for the electron-impact ionization cross sections for various elements (Kim 2001; Kim & Desclaux 2002; Kwon et al. 2005, 2006).
The DW cross sections obtained using the scaling factors (Eqs. (7) and (8)) are presented in Fig. A.2. Surprisingly, the theoretical values obtained for the potential of an ionizing ion show fairly good agreement with measurements (Brook et al. 1978). It should be noted that the scaling factors are applied to the DW cross sections. On the other hand, the BED and BEB cross sections for direct ionization are calculated using an analytic formula where orbital binding energy, orbital kinetic energy, and electron occupation number are used as input parameters (Kim & Desclaux 2002). The scaled PWB approximation uses the excitation energy, orbital binding energy, and incident energy to decrease the PWB cross sections for the excitation (Kim 2001).
The CI cross sections studied in the potential of an ionized ion are approximately 50% lower compared to the ones obtained in the potential of the ionizing ion (Fig. A.2). The contribution of the EA process amounts to ≼35% at the peak of the total ionization cross sections for the potential of the ionized ion and ≼20% for the potential of the ionizing ion.
The direct ionization from the 2p shell produces the largest contribution to the total cross sections (Fig. A.3). The contribution from the CI 2s channel is even lower than what is obtained for the indirect process. Previous calculations using the BEB model for the direct process and the scaled PWB cross sections for the indirect process demonstrated good agreement with measurements for the carbon atom (Kim & Desclaux 2002). However, only the 2s → 2p excitations were analyzed with subsequent autoionization in their study. The excitations to the higher shells (n ≼ 5) add ≼5% to the total cross sections (Fig. A.3). It should be noted that the contribution of the excitations to the shells with 6 ≼ n ≼ 10 is lower than that to the shells with n ≼ 5 by two orders of magnitude.
Cross sections obtained for the first three levels of the ground configuration agree within 1% (Fig. A.4). These levels originate from the 3P term. The situation changes for the highest levels of the ground configuration. The CI cross sections are increased by ≼7% and ≼27% for the 1D2 and 1S0 levels, respectively. Furthermore, the total cross sections are increased by ≼47% and ≼62% for these two levels, respectively (Fig. A.4). This means that the experimental cross sections (Brook et al. 1978) correspond to any of the three lowest levels (3P0,1,2) of the ground configuration since theoretical values for the highest two levels overestimate the measurements.
The DW cross sections for the C1+ ion are presented in Fig. A.5. The potentials of the ionized and ionizing ions are used in the CI study. It can be seen that the theoretical cross sections relative to the experimental ones (Yamada et al. 1989) are in a very similar situation to that for the C atom (Fig. A.1). Both potentials provide total cross sections that are above measured values at the lower energies of the incident electron. For the high-energy side, values obtained in the potential of the ionizing ion are in close agreement with experiments. However, the cross sections investigated in the potential of the ionized ion are ≼40% below the measurements. The theoretical cross sections studied in the potential of the ionizing ion are above the measurements at the peak of the experimental data while the values examined in the potential of the ionized ion are below experimental values. Taken together, this suggests that scaling of the DW cross sections obtained in the potential of the ionizing ion can lead to better agreement with the measurements.
The scaled DW cross sections for the C1+ ion are shown in Fig. A.6. In this case, scaling of the CI cross sections is obtained from Eq. (9). It can be seen that theoretical values are in relatively good agreement with measurements (Yamada et al. 1989). It should be noted that the EA cross sections are slightly more affected by the scaling procedure compared to the CI data. The contribution of the indirect process to the total cross sections diminishes from ≼18% for the DW cross sections to ≼14% for the scaled DW values.
The CI 2s channel for the C1+ ion contributes ≼40% to the total cross sections while it produces ≼15% for the C atom. This is related to the fact that there is only one electron in the outermost 2p shell of the C1+ ion. Therefore, the relative contribution of the 2s shell is increased. It should be noted that the 2s → 2p excitation leads to configuration with energy levels below the ionization threshold.
The DDI cross sections for the C atom are shown in Fig. A.7. The DW cross sections scaled by the corresponding factors for electron-impact ionization and excitation are used in the DDI study since these values lead to a good agreement with measurements for the carbon atom (Fig. A.3) and the C1+ ion (Fig. A.6). The DDI values are lower than the SI ones by an order of magnitude. The DDI II branch provides the largest contribution to the total cross sections. This can be explained by the fact that every additional step diminishes the output of the process. The total contribution from three-step processes reaches approximately 40% at the peak of data.
Cross sections are higher by a factor of two for the case where electrons share the excess energy compared to the situation when one of the electrons takes all of the available energy after the first CI process (Fig. A.8). Interestingly, the IEI cross sections are higher by a factor of two compared to the EII cross sections.
The DDI cross sections calculated for the different levels of the ground configuration agree within 10% (Fig. A.9). The highest values are obtained for the highest levels (1D2, 1S0) of the ground configuration. The SI cross sections for these levels are also higher compared to the levels corresponding to the 3P term (Fig. A.4).
Electron-impact ionization from the 1s shell with subsequent autoionization leads to DI. The ionization threshold for this shell is equal to 295.37 eV. However, the cross sections for the shell are lower by an order of magnitude compared to DDI and, therefore, are not presented in the current work.
Finally, the SI cross sections are presented in Tables 1–3 for the carbon atom and Table 4 for the C1+ ion. The DI cross sections are shown in Tables 5 and 6 for the ground level of the C atom. The SI and DI Maxwellian rate coefficients (MRC) are presented in Tables 7–12.
4. Conclusions
Electron-impact DDI for the C atom is investigated using a multi-step approach. Cross sections and Maxwellian rate coefficients for DI of the C atom are presented. Study includes II, EII, and IEI branches of the DDI process. Single ionization for the C atom and C1+ ion is investigated since a multi-step approach considers the sequential ionization and excitation by electron impact to describe the DDI process.
Scaling applied to the DW cross sections of the EA and CI processes leads to fairly good agreement with measurements for SI of the C atom and C1+ ion. The CI cross sections are scaled by using ionization and kinetic energies of the orbital with electron-impact energy for the C atom. The ionization and electron-impact energies determine the scaling factor for the C1+ ion. Excitation, electron binding, and electron-impact energies are used to diminish the EA DW cross sections.
This study demonstrates that three-step processes provide approximately 40% of the total DDI cross sections for the case where one of the electrons takes all of the excess energy after the first ionization process. Contributions from the EII and IEI processes are approximately equal. On the other hand, the IEI process dominates over the EII one for the case where the electrons share the excess energy equally. Finally, the DDI cross sections agree within 10% for the levels of the ground configuration.
References
- Barnett, C. F., Ray, J. A., Ricci, E., et al. 1977, Atomic Data for Controlled Fusion Research Oak Ridge National Laboratory Report ORNL-5207 [Google Scholar]
- Brickhouse, N. S. 1996, AIP Conf. Proc., 381, 31 [NASA ADS] [CrossRef] [Google Scholar]
- Brook, E., Harrison, M. F. A., & Smith, A. C. H. 1978, J. Phys. B Atom. Mol. Phys., 11, 3115 [Google Scholar]
- Bryans, P., Landi, E., & Savin, D. W. 2009, ApJ, 691, 1540 [NASA ADS] [CrossRef] [Google Scholar]
- Gu, M. F. 2008, Can. J. Phys., 86, 675 [NASA ADS] [CrossRef] [Google Scholar]
- Hahn, M., & Savin, D. W. 2015, ApJ, 800, 68 [NASA ADS] [CrossRef] [Google Scholar]
- Jonauskas, V., Prancikevičius, A., Masys, Š., & Kyniené, A. 2014, Phys. Rev. A, 89, 052714 [NASA ADS] [CrossRef] [Google Scholar]
- Jonauskas, V., Kyniené, A., Merkelis, G., et al. 2015, Phys. Rev. A, 91, 012715 [NASA ADS] [CrossRef] [Google Scholar]
- Kim, Y.-K. 2001, Phys. Rev. A, 64, 032713 [NASA ADS] [CrossRef] [Google Scholar]
- Kim, Y.-K., & Desclaux, J.-P. 2002, Phys. Rev. A, 66, 012708 [NASA ADS] [CrossRef] [Google Scholar]
- Kim, Y. K., & Rudd, M. E. 1994, Phys. Rev. A, 50, 3954 [NASA ADS] [CrossRef] [PubMed] [Google Scholar]
- Koncevičiūtė, J., & Jonauskas, V. 2016, Phys. Rev. A, 93, 022711 [NASA ADS] [CrossRef] [Google Scholar]
- Koncevičiūtė, J., Kučas, S., Masys, Š., Kyniené, A., & Jonauskas, V. 2018, Phys. Rev. A, 97, 012705 [NASA ADS] [CrossRef] [Google Scholar]
- Kramida, A., Ralchenko, Yu., & Reader, J., & NIST ASD Team 2018, NIST Atomic Spectra Database (ver. 5.5.6), National Institute of Standards and Technology, Gaithersburg, MD, Available: https://physics.nist.gov/asd [Google Scholar]
- Kwon, D.-H., Rhee, Y.-J., & Kim, Y.-K. 2005, Int. J. Mass Spectr., 245, 26 [Google Scholar]
- Kwon, D.-H., Rhee, Y.-J., & Kim, Y.-K. 2006, Int. J. Mass Spectr., 252, 213 [Google Scholar]
- Kyniené, A., Masys, Š., & Jonauskas, V. 2015, Phys. Rev. A, 91, 062707 [NASA ADS] [CrossRef] [Google Scholar]
- KynienŠ, A., Pakalka, S., Masys, Š., & Jonauskas, V. 2016, J. Phys. B Atom. Mol. Phys., 49, 185001 [Google Scholar]
- Müller, A. 1986, Phys. Lett. A, 113, 415 [NASA ADS] [CrossRef] [Google Scholar]
- Pakalka, S., Kučas, S., Masys, Š., et al. 2018, Phys. Rev. A, 97, 012708 [NASA ADS] [CrossRef] [Google Scholar]
- Wang, K. I., & Crawford, C. K. 1971, EIectron Impact Ionization Cross Sections Particle Optics Lab, MIT, Technical Report No 6, AFML-TR-70-289 [Google Scholar]
- Yamada, I., Danjo, A., Hirayama, T., et al. 1989, J. Phys. Soc. Jpn., 58, 1585 [NASA ADS] [CrossRef] [Google Scholar]
Appendix A: Figures
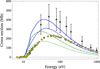 |
Fig. A.1. Single-ionization cross sections for the C atom. Theoretical values correspond to the DW calculations. Solid line (blue): total SI cross sections with the CI values obtained in the potential of the ionizing ion; dashed line (blue): CI data obtained in the potential of the ionizing ion; dash-dotted line (green): total SI cross sections with the CI values obtained in the potential of the ionized ion; dotted line (green): CI values obtained in the potential of the ionized ion; circles: experiment (Brook et al. 1978); triangles: experiment (Wang & Crawford 1971). |
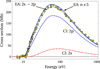 |
Fig. A.3. Comparison of the scaled DW cross sections with experimental values (Brook et al. 1978). |
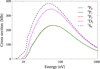 |
Fig. A.4. Scaled SI cross sections for the levels of the ground configuration. |
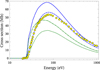 |
Fig. A.5. SI cross sections for the C1+ ion. Theoretical values correspond to the DW calculations. Solid line (blue): total SI cross sections with the CI values obtained in the potential of the ionizing ion; dashed line (blue): CI data obtained in the potential of the ionizing ion; dash-dotted line (green): total SI cross sections with the CI values obtained in the potential of the ionized ion; dotted line (green): CI values obtained in the potential of the ionized ion; circles: experiment (Yamada et al. 1989). |
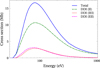 |
Fig. A.7. Direct double-ionization cross sections for the ground level of the C atom. DDI corresponds to the case where one of the electrons takes all the excess energy after the first ionization process. |
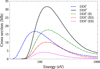 |
Fig. A.8. Direct double-ionization cross sections for the ground level of the C atom. Superscript 1: one of the electrons takes all the excess energy after the first ionization process; superscript 2: scattered and ejected electrons share the excess energy equally. |
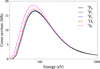 |
Fig. A.9. Direct double-ionization cross sections for the levels of the ground configuration of the C atom. |
All Figures
|
Fig. A.1. Single-ionization cross sections for the C atom. Theoretical values correspond to the DW calculations. Solid line (blue): total SI cross sections with the CI values obtained in the potential of the ionizing ion; dashed line (blue): CI data obtained in the potential of the ionizing ion; dash-dotted line (green): total SI cross sections with the CI values obtained in the potential of the ionized ion; dotted line (green): CI values obtained in the potential of the ionized ion; circles: experiment (Brook et al. 1978); triangles: experiment (Wang & Crawford 1971). |
| In the text | |
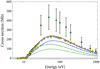 |
Fig. A.2. As in Fig. A.1, but for the scaled DW cross sections (Eq. (7) for EA and Eq. (8) for CI). |
| In the text | |
|
Fig. A.3. Comparison of the scaled DW cross sections with experimental values (Brook et al. 1978). |
| In the text | |
|
Fig. A.4. Scaled SI cross sections for the levels of the ground configuration. |
| In the text | |
|
Fig. A.5. SI cross sections for the C1+ ion. Theoretical values correspond to the DW calculations. Solid line (blue): total SI cross sections with the CI values obtained in the potential of the ionizing ion; dashed line (blue): CI data obtained in the potential of the ionizing ion; dash-dotted line (green): total SI cross sections with the CI values obtained in the potential of the ionized ion; dotted line (green): CI values obtained in the potential of the ionized ion; circles: experiment (Yamada et al. 1989). |
| In the text | |
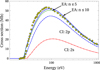 |
Fig. A.6. As in Fig. A.5, but for the scaled DW cross sections (Eq. (7) for EA and Eq. (9) for CI). |
| In the text | |
|
Fig. A.7. Direct double-ionization cross sections for the ground level of the C atom. DDI corresponds to the case where one of the electrons takes all the excess energy after the first ionization process. |
| In the text | |
|
Fig. A.8. Direct double-ionization cross sections for the ground level of the C atom. Superscript 1: one of the electrons takes all the excess energy after the first ionization process; superscript 2: scattered and ejected electrons share the excess energy equally. |
| In the text | |
|
Fig. A.9. Direct double-ionization cross sections for the levels of the ground configuration of the C atom. |
| In the text | |
Current usage metrics show cumulative count of Article Views (full-text article views including HTML views, PDF and ePub downloads, according to the available data) and Abstracts Views on Vision4Press platform.
Data correspond to usage on the plateform after 2015. The current usage metrics is available 48-96 hours after online publication and is updated daily on week days.
Initial download of the metrics may take a while.