| Issue |
A&A
Volume 677, September 2023
|
|
|---|---|---|
| Article Number | A170 | |
| Number of page(s) | 7 | |
| Section | Atomic, molecular, and nuclear data | |
| DOI | https://doi.org/10.1051/0004-6361/202245690 | |
| Published online | 22 September 2023 | |
Electron-impact single ionization for the Fe2+ ion
Institute of Theoretical Physics and Astronomy, Vilnius University,
Saulėtekio av. 3,
10257
Vilnius,
Lithuania
e-mail: ausra.Kynienė@tfai.vu.lt
Received:
14
December
2022
Accepted:
15
July
2023
Abstract
Electron-impact ionization was analyzed for all 34 levels of the ground configuration of the Fe2+ ion. Both direct and indirect ionization processes are included in the study. For the direct process, the potential of the ionized ion was used to explain experimental data. For the indirect process, electron-impact excitation with subsequent autoionization was considered. The convergence of the cross sections of the indirect process was determined by considering the excitations up to shells with the principal quantum number n ⩽ 20. The main contribution to the indirect process was determined by the 3p → 3d excitations. The scaled distorted-wave approximation was applied to explain measurements for the Fe2+ ion. Scaling of the cross sections lowers values by ~35% at the peak for the ground level and ~50% for the highest level of the ground configuration of the Fe2+ ion. The experimental value for the single ionization threshold was used to provide better agreement with the measurements for the cross sections. This led to the cross sections for the levels of the ground configuration diminishing in size by 15–25%. The direct process contributes ~70% and ~50% to the total ionization from the lowest and highest levels of the ion, respectively.
Key words: atomic data / atomic processes
© The Authors 2023
 Open Access article, published by EDP Sciences, under the terms of the Creative Commons Attribution License (https://creativecommons.org/licenses/by/4.0), which permits unrestricted use, distribution, and reproduction in any medium, provided the original work is properly cited.
This article is published in open access under the Subscribe to Open model. This email address is being protected from spambots. You need JavaScript enabled to view it. to support open access publication.
1 Introduction
An abundance of iron ions in the Universe and plenty of emission lines over a wide range of wavelengths make spectra from iron ions ideal tools for the analysis of remote cosmic objects. The Fe2+ ion is of particular interest because of its high cosmic abundance, relatively low ionization potential, and complex, open d-shell atomic structure. The spectral lines of Fe2+ ions have been observed in various astrophysical objects, including H II regions (Rodriguez 1996; Lebouteiller et al. 2008), planetary nebulae (Zhang et al. 2012; Laha et al. 2017), Herbig–Haro objects (Mesa-Delgado et al. 2009), the cores of active galactic nuclei, and quasars (Laor et al. 1997; Vestergaard & Wilkes 2001; Mediavilla et al. 2019; Temple et al. 2020).
Electron-impact ionization is one of the elementary processes playing an important role in fundamental and applied physics (Märk & Dunn 1985). Ionization and recombination processes determine the formation of charge state distribution in collisional plasma. Low-density, high-temperature astrophysical and laboratory plasmas typically do not exhibit local thermodynamic equilibrium. In order to accurately assess the ionization state in these systems, a detailed examination of the individual collisional and radiative ionization and recombination processes is crucial. Reliable data for the charge state distribution are vital to modeling intensities of spectral lines observed in the plasma (Smith & Brickhouse 2014). The emission measure, which provides valuable insights into temperature, density, and energy distribution within the plasma, relies heavily on the determination of charge state distribution (Brickhouse 1996; Warren et al. 2017; Leahy et al. 2019). Rate coefficients for different ionization stages observed in plasma are incorporated into astrophysical codes and databases (Ferland et al. 2017; Del Zanna et al. 2021). The Cloudy code uses the rate coefficients from the compilations by Voronov (1997) and Dere (2007). Dere (2007) provided rate coefficients calculated from ionization cross sections obtained from experimental data or the flexible atomic code (FAC; Gu 2008). The rate coefficients presented by Voronov (1997) were obtained from cross sections, which were based on a rigorous assessment of the best experimental and theoretical data available at the time (Bell et al. 1983; Lennon et al. 1988).
Electron-impact single ionization (SI) cross sections for the Fe2+ ion were observed using the crossed-beams technique (Mueller et al. 1985; Stenke et al. 1999). The onsets of the cross sections in the measurements below the ionization threshold showed the presence of the metastable fraction in the ion beam. The obtained values were compared to theoretical predictions using the Lotz formula (Lotz 1968) and the configuration-average distorted-wave (CADW) approximation (Pindzola et al. 1987). The theoretical results agreed quite well with the measurements at higher electron energies; however, they also underestimated the experimental values at lower energies and overestimated the measurements at each peak. Only the 3p → 3d excitations were included in the CADW calculations. A subsequent CADW study analyzed the 3p → nl and 3s → nl excitations (n ⩽ 12, l < n, and l ⩽ 5) (Pindzola & Loch 2018). The increased number of excitations (Pindzola & Loch 2018) compared to the previous calculations (Pindzola et al. 1987) led to theoretical values that are higher than the measured ones over a wide energy range; however, the more recent CADW results are also lower than the experimental data at the lower energies close to the ionization threshold. It should be noted that a good agreement with the measurements was obtained for the direct ionization from the 3d subshell starting at ~ 100 eV (Pindzola & Loch 2018).
In this study, we present a detailed analysis of electron-impact ionization cross sections for the Fe2+ ion by considering direct and indirect processes. The study encompasses all 34 energy levels of the ground Fe2+ 3s23p63d6 configuration. The scaled distorted-wave (DW) approximation is used to obtain cross sections for collisional ionization (CI) and excitation processes.
The rest of the paper is organized as follows. Section 2 presents a brief outline of the theoretical approach. In Sect. 3, the obtained results are discussed. We end with our conclusions.
2 Theoretical approach
The total electron-impact SI cross sections were determined as the sum of direct and indirect processes at energy ε of the impacting electron:
 (1)
(1)
The CI led directly to level f of the Fe3+ ion from level i of the Fe2+ ion. It should be noted that this study does not take into account interference between direct and indirect processes. Previous investigations have demonstrated that treating these processes independently is highly reasonable and provides accurate ionization cross sections and rate coefficients for plasma modeling. The direct process is studied in the potentials of the ionizing and ionized ions. Kwon et al. (2013) thoroughly analyzed the influence of the potentials that are used to calculate CI cross-sections by using the FAC (Gu 2008). The indirect ionization was initiated by electron-impact excitation, which led to the autoionization of level j of the Fe2+ ion. The  is an autoionization branching ratio that evaluates population transfer from the excited autoionizing state of Fe2+ to the states of Fe3+:
 (2)
(2)
Here, Ar and Aa are radiative and Auger transition probabilities, respectively. The autoionization branching ratio diminishes the contribution of the excitation cross sections to the total ionization cross sections, and its value is zero for the energy level of the Fe2+ ion below the SI threshold. It is important to analyze configurations with the energy levels that straddle the SI threshold. The excitations to these configurations often have higher cross sections than excitations of the same type to other, higher-lying configurations. The slight variation in the position of the energy levels of the configurations can lead to energies below or above the SI threshold. This can have a crucial effect on the excitation– autoionization (EA) cross sections. Therefore, the level-to-level study of the ionization process is important for the configurations with energy levels that straddle the SI threshold.
We studied electron-impact SI cross sections from all 34 energy levels of the 3s2 3p6 3d6 ground configuration of the Fe2+ ion. The direct ionization included only the 3d subshell. The ionization from the 3p subshell leads to double ionization, except for the ground level. However, the contribution from the ground level for the 3p subshell is an order of magnitude smaller than the total ionization cross sections. For the indirect process, the excitations from the 3p and 3d subshells up to the subshells with the principal quantum numbers n ⩽ 20 and orbital quantum numbers l ⩽ 6 were analyzed. The excitations from the 3s subshell were not included in the study of the indirect process since the decay of the autoionizing states that are produced leads to the states of the Fe4+ ion through double Auger transitions. All possible electric dipole and Auger transitions from the autoionizing configurations that were generated were taken into account.
Excitations from the outermost subshell were included in the study as the many excited states are autoionizing ones. Previous studies of the ionization process have demonstrated the importance of excitations from the outermost subshell in explaining experimental data (Kwon & Savin 2012). The excitations mainly contribute at the lower energies of the impacting electron. All energy levels, radiative and Auger transition probabilities, and electron-impact excitation and ionization cross sections for the Fe2+ ion were investigated using the FAC (Gu 2008), which implements the Dirac-Fock-Slater (DFS) approximation.
It is well known that the DW approximation often produces higher values than the experimental data for neutral atoms and near-neutral ions. Previously, it was proposed that the binary encounter dipole approach be used for direct ionization (Kim & Rudd 1994) and scaled plane-wave Born cross sections be used for indirect ionization (Kim 2001). The scaling of the plane-wave Born cross sections was only applied to the electric dipole transitions (Kim 2001). Later, it was proposed that the scaled DW cross sections be used in the analysis of the C atom, C+ ion (Jonauskas 2018), Si atom (Jonauskas 2020a), Fe3+ ion (Kynienė et al. 2019), and N atom (Jonauskas 2022). Scaling factors were applied to the direct ionization cross sections and excitation cross sections. The scaled DW cross sections for the direct process were expressed by the following relation through the unscaled cross sections:
 (3)
(3)
where I is the ionization energy. The scaled DW cross sections for the electron-impact excitation were described by the following equation (Jonauskas 2018):
 (4)
(4)
where εb is the binding energy of the electron, and ΔEik is the transition energy from level i to level k of the Fe2+ ion.
The resonant excitation double autoionization (REDA) process is not considered in this study. The contribution from the REDA process is much smaller than that from CI and EA.
The theoretical SI cross sections were used to derive the Maxwellian rate coefficients. For this purpose, the cross sections were averaged over the Maxwell-Boltzmann distribution for the energies of the electrons.
3 Results
The energy levels of configurations for the Fe2+ and Fe3+ ions are plotted in Fig. 1. It is evident that there are many configurations with energy levels that straddle the SI threshold. This means that the configuration average calculations cannot guarantee reliable data for the indirect process of ionization for these configurations. A slight variation in the SI threshold can lead to a change in the EA cross sections that corresponds to the excitations to these configurations.
The energy levels of the ground configuration of the Fe2+ ion determined using the FAC are compared to data provided by the National Institute of Standards and Technology (NIST) (Kramida et al. 2022) in Table 1. The leading percentages for the energy levels from the NIST database are also presented. It can be seen that configuration mixing occurs between the levels of the ground configuration. The highest energy level of the configuration is 13.414 eV above the ground level for the FAC values. The relative difference in the energy levels from the energy of the ground level is smaller for many levels in the NIST data than in the FAC data. Furthermore, the theoretical energy levels are more energetically split than the NIST ones for all terms, except for the a3P and b3P ones, which show the largest mixing (Table 1). The difference from the NIST values can be explained by the fact that the interactions between the energy levels of the excited configurations and those of the ground configuration are missing in our calculations. The influence of correlation effects on the energy levels and SI cross sections requires a separate study that involves large-scale calculations. It should be noted that correlation effects often have a diminishing effect on the calculated SI cross sections (Jonauskas et al. 2019; Jonauskas 2020b).
The theoretical SI threshold for the Fe2+ ion is 27.818 eV, which is ~9% lower than the NIST-recommended value of 30.651 eV. It should be noted that the SI thresholds obtained for other elements and ions using the DFS approach have previously been reported to be lower than the NIST values (Kynienė et al. 2015; Kynienė et al. 2019; Koncevičiūtė et al. 2018; Jonauskas 2018; Jonauskas et al. 2019; Kučas et al. 2022). The difference is more pronounced at lower ionization stages than higher ones. This is in line with the idea that correlation effects are responsible for the differences in energy levels between the DFS and NIST data in this work.
The SI cross sections studied in the potential of the ionizing ion are presented in Fig. 2. The cross sections are plotted for ionization from all levels of the ground configuration of the Fe2+ ion. The level i = 5 (Table 1) corresponds to the lowest cross sections, while the highest level of the ground configuration, i = 33, produces the highest peak. A difference of ~50% between the lowest and highest peaks of the theoretical cross sections was obtained. What is more, the peak of the cross section for the highest level of the ground configuration shifts to the lower-energy side, whereas the cross sections for lower levels of the ground configuration peak at around 100 eV. A comparison with measurements from Mueller et al. (1985) and Stenke et al. (1999) demonstrates that the theoretical values overestimate the experimental data for the entire energy range. The lowest peak of the theoretical cross sections is ~60% higher than the peaks of the experimental ones. Furthermore, the theoretical cross sections are slightly higher than the experimental data at higher energies of the impacting electron, too (Fig. 2).
Theoretical cross sections calculated in the potential of the ionized ion show much better agreement with the measurements on the high-energy side (Fig. 3); however, they overestimate the measurements for the lowest peaks by at least ~30%. The lowest peak is ~15% smaller than the one obtained in the potential of the ionizing ion (Fig. 2). It should be noted that the values at the peaks of the cross sections that correspond to the ionization from the two highest levels of the ground configuration are the same in both calculations. This is explained by the fact that these peaks are formed by the EA channels produced by excitations from the 3d subshell. This subshell is the outermost one of the ground configuration, and the corresponding EA cross sections are built at lower energies of the impacting electron, where the contribution from the direct process is smaller.
For the scaled DW cross sections, the situation is totally different. Scaling Eqs. (3), (4) leads the cross sections to diminish in size. This effect is more pronounced at lower energies closer to the ionization threshold. The scaled cross sections obtained in the potential of the ionizing ion are ~30% smaller, in the case of the lowest peak (Fig. 4), than the unscaled values (Fig. 2). Scaling causes the highest levels of the ground configuration to shrink by ~45%. Nevertheless, the scaled DW cross sections on the high-energy side are still higher than those for the experimental data (Mueller et al. 1985; Stenke et al. 1999).
The lowest peaks of the scaled DW cross sections obtained in the potential of the ionized ion (Fig. 5) are ~20% lower than those for the data calculated in the potential of the ionizing ion (Fig. 4). The difference reaches ~15% for the highest peaks that correspond to the highest level of the ground configuration. There are many cross sections below both measurements at energies starting from ~200 eV. At ~100 eV, the theoretical cross sections are slightly above the experimental data observed by Mueller et al. (1985). The measurements by Stenke et al. (1999) are above the lowest theoretical cross sections across the entire energy range. These measurements are higher than the lowest theoretical cross sections as they descend to lower energies from the peak (Fig. 5). It should be noted that the measurements from Stenke et al. (1999) are higher than the data observed by Mueller et al. (1985). Furthermore, the latter cross sections appear on the scene at slightly higher energies than the former ones. All of this indicates that a larger number of metastable levels is populated in the ion beam produced in the experiment of Stenke et al. (1999) than in that of Mueller et al. (1985).
As mentioned above, the theoretical SI threshold is ~2.833 eV lower than the NIST-recommended value (Kramida et al. 2022). Previously, it was demonstrated that correcting the SI threshold in calculations can lead to a better agreement with the measurements (Jonauskas 2020a; Kynienė & Jonauskas 2021). The correction of the SI threshold affects the CI and EA cross sections. The increase in the SI threshold in the calculations leads to some initially autoionizing energy levels of the Fe2+ ion that are below the ground level of the next ionization stage. Therefore, the EA cross sections diminish in size when the SI threshold is increased in the theoretical studies.
The scaled DW cross sections obtained using the experimental SI threshold are compared with the measurements in Fig. 6. It can be seen that the theoretical cross sections from different levels of the ground configuration extend over all the experimental values. The correction of the SI threshold affects only excitations from the 3d subshell for the EA process. There are many configurations produced by the excitations from the 3d subshell of the ground configuration that have energy levels that straddle the SI threshold (Fig. 1). The cross sections are reduced by a factor of six for this subshell. The energy levels of the configurations produced by the excitations from the 3p subshell are well above the SI threshold. The increase in the SI threshold by 2.833 eV does not reach these energy levels. Therefore, this correction of the SI threshold does not influence the EA cross sections that correspond to the excitations from the 3p subshell. It should be noted that the current study does not permit an evaluation of the population of the levels in the ion beam in comparison to the experimental data since there are many levels that can contribute to the formation of the experimental cross sections. Other methods must be utilized to determine the population of the levels.
The contribution from direct and indirect ionization processes to the total ionization cross sections is shown in Fig. 7 for the levels with indices i = 17 and i = 33. The SI cross sections from these levels correspond to the lowest and highest peaks among the levels of the ground configuration of the Fe3+ ion. At peak values, the contribution from the EA process amounts to ~25% for level i = 17 and ~50% for i = 33. In addition, the previous calculations made using the CADW method (Pindzola & Loch 2018) are compared to the experimental data and the FAC calculations. As mentioned above, the CADW cross sections are more than 20% higher than the measurements at the peak.
It is important to estimate the contribution of the EA channels that correspond to excitations to the higher shells (Kynienė et al. 2015, 2016). The convergence of the cross sections for the indirect process of ionization has to be investigated so that all important EA channels are included in the study. The contribution of the EA channels produced by the excitations to the shells with the principal quantum numbers 9 ⩽ n ⩽ 20 provides ~2% of the total cross sections of the ionization from level i = 17 (Fig. 8). The EA channels corresponding to the excitations to the shells with 9 ⩽ n ⩽ 20 from the highest level of the ground configuration contribute slightly more (~6%). This therefore demonstrates that the excitations to the higher shells (n > 20) would provide only a negligible contribution to the SI cross sections.
The strongest excitations contributing to the indirect process of ionization from the highest level of the ground configuration correspond to the 3p → 3d transitions (Fig. 9). The next strongest contribution to the indirect process comes from the 3p → 4p transitions. However, the latter transitions constitute only ~ 10% of the total EA cross sections from this level. It is a similar situation for other levels of the ground configuration.
The scaled cross sections obtained for the lowest and highest levels of the ground configuration using the experimental SI threshold (Kramida et al. 2022) are compared in Fig. 10 to the data obtained using the theoretical SI threshold. In addition, the level with index i = 17, which corresponds to the lowest theoretical cross sections, is presented. The cross sections are diminished by ~15% for levels i = 0 and i = 17 and by ~25% for the highest level of the ground configuration of the Fe2+ ion.
The Maxwellian rate coefficients presented by Voronov (1997) and Dere (2007) for the ground state are compared in Fig. 11 to our results for the lowest and highest levels of the ground configuration. Dere (2007) used the FAC to calculate the cross sections while Voronov (1997) obtained cross sections from the fit to the data of Mueller et al. (1985). Our data for the ground level are ~10% below the rate coefficients of Voronov (1997) at peak values. What is more, the rate coefficients presented by Dere (2007) are ~50% higher than our peak value. A difference of ~25% between the lowest and highest levels of the ground configuration of the Fe2+ ion was obtained.
Comparison of theoretical (DFS) and NIST (Kramida et al. 2022) energy levels (in eV) for the ground configuration of the Fe2+ ion.
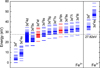 |
Fig. 1 Energy levels of the Fe2+ and Fe3+ ions. The configurations of the energy levels that straddle the SI threshold are presented in addition to the ground and first excited configurations of the Fe2+ and Fe3+ ions. |
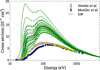 |
Fig. 2 SI cross sections for all levels of the ground configuration of the Fe2+ ion (DW). The CI cross sections are determined by the potential of the ionizing ion. Experimental data are from Stenke et al. (1999) and Mueller et al. (1985). |
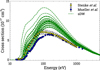 |
Fig. 4 Scaled DW (sDW) cross sections for all levels of the ground configuration of the Fe2+ ion. The CI cross sections are determined by the potential of the ionizing ion. Experimental data are from Stenke et al. (1999) and Mueller et al. (1985). |
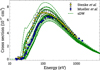 |
Fig. 6 Scaled DW (sDW) cross sections for the ground configuration levels of the Fe2+ ion. The CI cross sections were determined in the potential of the ionized ion. The experimental SI threshold (Kramida et al. 2022) was used in the calculations. Experimental data are from Stenke et al. (1999) and Mueller et al. (1985). |
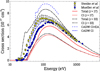 |
Fig. 7 Scaled DW cross sections calculated using the corrected SI threshold (Kramida et al. 2022) for the levels that have the lowest and highest cross sections at the peak. The contributions from direct and indirect processes are presented. Plotted data are from Stenke et al. (Stenke et al. 1999), Mueller et al. (Mueller et al. 1985), and CADW (Pindzola & Loch 2018). |
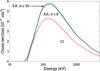 |
Fig. 8 Scaled DW cross sections calculated using the corrected SI threshold (Kramida et al. 2022) for the level that features the lowest cross section at the peak, i = 17. The contributions from direct and indirect processes are presented. |
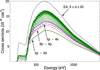 |
Fig. 9 Contribution of the EA channels corresponding to ionization from the ground level. The scaled DW cross sections are calculated using the corrected SI threshold (Kramida et al. 2022). |
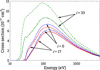 |
Fig. 10 Comparison of the scaled DW cross sections determined using theoretical and experimental (Kramida et al. 2022) SI thresholds. The values obtained using the experimental threshold correspond to the lower values of the presented cross sections. |
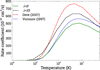 |
Fig. 11 Maxwellian rate coefficients for the lowest (i = 0) and highest (i = 33) levels of the ground configuration of the Fe2+ ion compared to the results from Dere (2007) and Voronov (1997). |
4 Summary and conclusions
We investigated the electron-impact SI cross sections for all levels of the ground configuration of the Fe2+ ion. This included studying the contribution of direct and indirect ionization processes. The direct process investigated in the potential of the ionized ion produces a lower cross section than that from data calculated in the ionizing potential. We studied the convergence of the cross sections for the EA channels. The scaled DW approximation with the corrected value of the SI threshold produces cross sections that are lower than the experimental data across the whole electron energy range for many lower-lying energy levels. The correction of the SI threshold leads to values ~15% and ~25% smaller for the lowest and highest levels of the ground configuration of the Fe2+ ion, respectively. The EA channels corresponding to the 3p → 3d excitations provide the main contribution to the indirect ionization. The excitations to the higher nl shells (9 ⩽ n ⩽ 20) contribute less than ~ 10% to the ionization from the levels of the ground configuration.
Finally, cross sections for the direct, indirect, and total ion-ization by electron impact are presented as supplementary data. The Maxwellian rate coefficients are also tabulated for all levels of the ground configuration of the Fe2+ ion. The contribution from different subshells is presented so that the data can be used not only for equilibrium plasmas but also for nonequilibrium modeling.
Acknowledgements
Part of the computations was performed on the High Performance Computing (HPC) cluster at the Institute of Theoretical Physics and Astronomy, Faculty of Physics, Vilnius University.
References
- Bell, K. L., Gilbody, H. B., Hughes, J. G., et al. 1983, J. Phys. Chem. Ref. Data, 12, 891 [NASA ADS] [CrossRef] [Google Scholar]
- Brickhouse, N. S. 1996, Atomic Processes in Plasmas, eds. A. L. Osterheld, & W. H. Goldstein [Google Scholar]
- Del Zanna, G., Dere, K. P., Young, P. R., & Landi, E. 2021, ApJ, 909, 38 [NASA ADS] [CrossRef] [Google Scholar]
- Dere, K. P. 2007, A&A, 466, 771 [NASA ADS] [CrossRef] [EDP Sciences] [Google Scholar]
- Ferland, G. J., Chatzikos, M., Guzmán, et al. 2017, Rev. Mex. Astron. Astrofís., 53, 385 [Google Scholar]
- Gu, M. F. 2008, Can. J. Phys., 86, 675 [NASA ADS] [CrossRef] [Google Scholar]
- Jonauskas, V. 2018, A&A, 620, A188 [NASA ADS] [CrossRef] [EDP Sciences] [Google Scholar]
- Jonauskas, V. 2020a, At. Data Nucl. Data Tables, 135, 101363 [Google Scholar]
- Jonauskas, V. 2020b, A&A, 642, A185 [NASA ADS] [CrossRef] [EDP Sciences] [Google Scholar]
- Jonauskas, V. 2022, A&A, 659, A11 [NASA ADS] [CrossRef] [EDP Sciences] [Google Scholar]
- Jonauskas, V., Kynienė, A., Kučas, S., et al. 2019, Phys. Rev. A, 100, 062701 [NASA ADS] [CrossRef] [Google Scholar]
- Kim, Y.-K. 2001, Phys. Rev. A, 64, 032713 [NASA ADS] [CrossRef] [Google Scholar]
- Kim, Y. K., & Rudd, M. E. 1994, Phys. Rev. A, 50, 3954 [NASA ADS] [CrossRef] [Google Scholar]
- Koncevičiūtė, J., KuCas, S., Masys, Š., Kynienė, A., & Jonauskas, V. 2018, Phys. Rev. A, 97, 012705 [CrossRef] [Google Scholar]
- Kramida, A., Ralchenko, Yu., Reader, J., & NIST ASD Team (2022). NIST AtomiC Spectra Database (ver. 5.10), [Online]. Available: https://physics.nist.gov/asd (Gaithersburg, MD: National Institute of Standards and TeChnology) [Google Scholar]
- Kučas, S., Momkauskaitė, A., Kynienė, A., Masys, Š., & Jonauskas, V. 2022, JQSRT, 288, 108249 [CrossRef] [Google Scholar]
- Kwon, D.-H., & Savin, D. W. 2012, Phys. Rev. A, 86, 022701 [NASA ADS] [CrossRef] [Google Scholar]
- Kwon, D.-H., Cho, Y.-S., & Lee, Y.-O. 2013, Int. J. Mass SpeCtrom., 356, 7 [NASA ADS] [CrossRef] [Google Scholar]
- Kynienė, A., & Jonauskas, V. 2021, A&A, 656, A79 [NASA ADS] [CrossRef] [EDP Sciences] [Google Scholar]
- Kynienė, A., Masys, Š., & Jonauskas, V. 2015, Phys. Rev. A, 91, 062707 [CrossRef] [Google Scholar]
- Kynienė, A., Pakalka, S., Masys, Š., & Jonauskas, V. 2016, J. Phys. B: At. Mol. Opt. Phys., 49, 185001 [CrossRef] [Google Scholar]
- Kynienė, A., Kučas, S., Pakalka, S., Masys, Š., & Jonauskas, V. 2019, Phys. Rev. A, 100, 052705 [CrossRef] [Google Scholar]
- Laha, S., Tyndall, N. B., Keenan, F. P., et al. 2017, ApJ, 841, 3 [NASA ADS] [CrossRef] [Google Scholar]
- Laor, A., Jannuzi, B. T., Green, R. F., & Boroson, T. A. 1997, ApJ, 489, 656 [Google Scholar]
- Leahy, D., Wang, Y., Lawton, B., Ranasinghe, S., & Filipović, M. 2019, AJ, 158, 149 [NASA ADS] [CrossRef] [Google Scholar]
- Lebouteiller, V., Bernard-Salas, J., Brandl, B., et al. 2008, ApJ, 680, 398 [NASA ADS] [CrossRef] [Google Scholar]
- Lennon, M. A., Bell, K. L., Gilbody, H. B., et al. 1988, J. Phys. Chem. Ref. Data, 17, 1285 [NASA ADS] [CrossRef] [Google Scholar]
- Lotz, W. 1968, Z. Phys., 216, 241 [NASA ADS] [CrossRef] [Google Scholar]
- Märk, T. D., & Dunn, G. H. 1985, Electron Impact Ionization (Springer-Verlag Wien) [CrossRef] [Google Scholar]
- Mediavilla, E., Jiménez-Vicente, J., Mejí-Restrepo, J., et al. 2019, ApJ, 880, 96 [NASA ADS] [CrossRef] [Google Scholar]
- Mesa-Delgado, A., Esteban, C., García-Rojas, J., et al. 2009, MNRAS, 395, 855 [NASA ADS] [CrossRef] [Google Scholar]
- Mueller, D. W., Morgan, T. J., Dunn, G. H., Gregory, D. C., & Crandall, D. H. 1985, Phys. Rev. A, 31, 2905 [NASA ADS] [CrossRef] [Google Scholar]
- Pindzola, M. S., & LoCh, S. D. 2018, J. Phys. B: At. Mol. Opt. Phys., 51, 015202 [NASA ADS] [CrossRef] [Google Scholar]
- Pindzola, M. S., Griffin, D. C., BottCher, C., Younger, S. M., & Hunter, H. T. 1987, NuCl. Fusion, 27, 21 [CrossRef] [Google Scholar]
- Rodriguez, M. 1996, A&A, 313, L5 [NASA ADS] [Google Scholar]
- Smith, R. K., & BriCkhouse, N. S. 2014, Adv. At. Mol. Opt. Phys., 63, 271 [NASA ADS] [CrossRef] [Google Scholar]
- Stenke, M., Aichele, K., Hartenfeller, U., et al. 1999, J. Phys. B: At. Mol. Opt. Phys., 32, 3627 [NASA ADS] [CrossRef] [Google Scholar]
- Temple, M. J., Ferland, G. J., Rankine, A. L., et al. 2020, MNRAS, 496, 2565 [NASA ADS] [CrossRef] [Google Scholar]
- Vestergaard, M., & Wilkes, B. J. 2001, ApJS, 134, 1 [Google Scholar]
- Voronov, G. S. 1997, At. Data NuCl. Data Tables, 65, 1 [CrossRef] [Google Scholar]
- Warren, H. P., Byers, J. M., & Crump, N. A. 2017, ApJ, 836, 215 [NASA ADS] [CrossRef] [Google Scholar]
- Zhang, Y., Fang, X., Chau, W., et al. 2012, ApJ, 754, 28 [NASA ADS] [CrossRef] [Google Scholar]
All Tables
Comparison of theoretical (DFS) and NIST (Kramida et al. 2022) energy levels (in eV) for the ground configuration of the Fe2+ ion.
All Figures
|
Fig. 1 Energy levels of the Fe2+ and Fe3+ ions. The configurations of the energy levels that straddle the SI threshold are presented in addition to the ground and first excited configurations of the Fe2+ and Fe3+ ions. |
| In the text | |
|
Fig. 2 SI cross sections for all levels of the ground configuration of the Fe2+ ion (DW). The CI cross sections are determined by the potential of the ionizing ion. Experimental data are from Stenke et al. (1999) and Mueller et al. (1985). |
| In the text | |
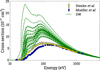 |
Fig. 3 Same as Fig. 2 except the potential of the ionized ion is used. |
| In the text | |
|
Fig. 4 Scaled DW (sDW) cross sections for all levels of the ground configuration of the Fe2+ ion. The CI cross sections are determined by the potential of the ionizing ion. Experimental data are from Stenke et al. (1999) and Mueller et al. (1985). |
| In the text | |
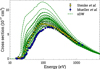 |
Fig. 5 Same as Fig. 4 except the potential of the ionized ion is used. |
| In the text | |
|
Fig. 6 Scaled DW (sDW) cross sections for the ground configuration levels of the Fe2+ ion. The CI cross sections were determined in the potential of the ionized ion. The experimental SI threshold (Kramida et al. 2022) was used in the calculations. Experimental data are from Stenke et al. (1999) and Mueller et al. (1985). |
| In the text | |
|
Fig. 7 Scaled DW cross sections calculated using the corrected SI threshold (Kramida et al. 2022) for the levels that have the lowest and highest cross sections at the peak. The contributions from direct and indirect processes are presented. Plotted data are from Stenke et al. (Stenke et al. 1999), Mueller et al. (Mueller et al. 1985), and CADW (Pindzola & Loch 2018). |
| In the text | |
|
Fig. 8 Scaled DW cross sections calculated using the corrected SI threshold (Kramida et al. 2022) for the level that features the lowest cross section at the peak, i = 17. The contributions from direct and indirect processes are presented. |
| In the text | |
|
Fig. 9 Contribution of the EA channels corresponding to ionization from the ground level. The scaled DW cross sections are calculated using the corrected SI threshold (Kramida et al. 2022). |
| In the text | |
|
Fig. 10 Comparison of the scaled DW cross sections determined using theoretical and experimental (Kramida et al. 2022) SI thresholds. The values obtained using the experimental threshold correspond to the lower values of the presented cross sections. |
| In the text | |
|
Fig. 11 Maxwellian rate coefficients for the lowest (i = 0) and highest (i = 33) levels of the ground configuration of the Fe2+ ion compared to the results from Dere (2007) and Voronov (1997). |
| In the text | |
Current usage metrics show cumulative count of Article Views (full-text article views including HTML views, PDF and ePub downloads, according to the available data) and Abstracts Views on Vision4Press platform.
Data correspond to usage on the plateform after 2015. The current usage metrics is available 48-96 hours after online publication and is updated daily on week days.
Initial download of the metrics may take a while.