Fig. A.5.
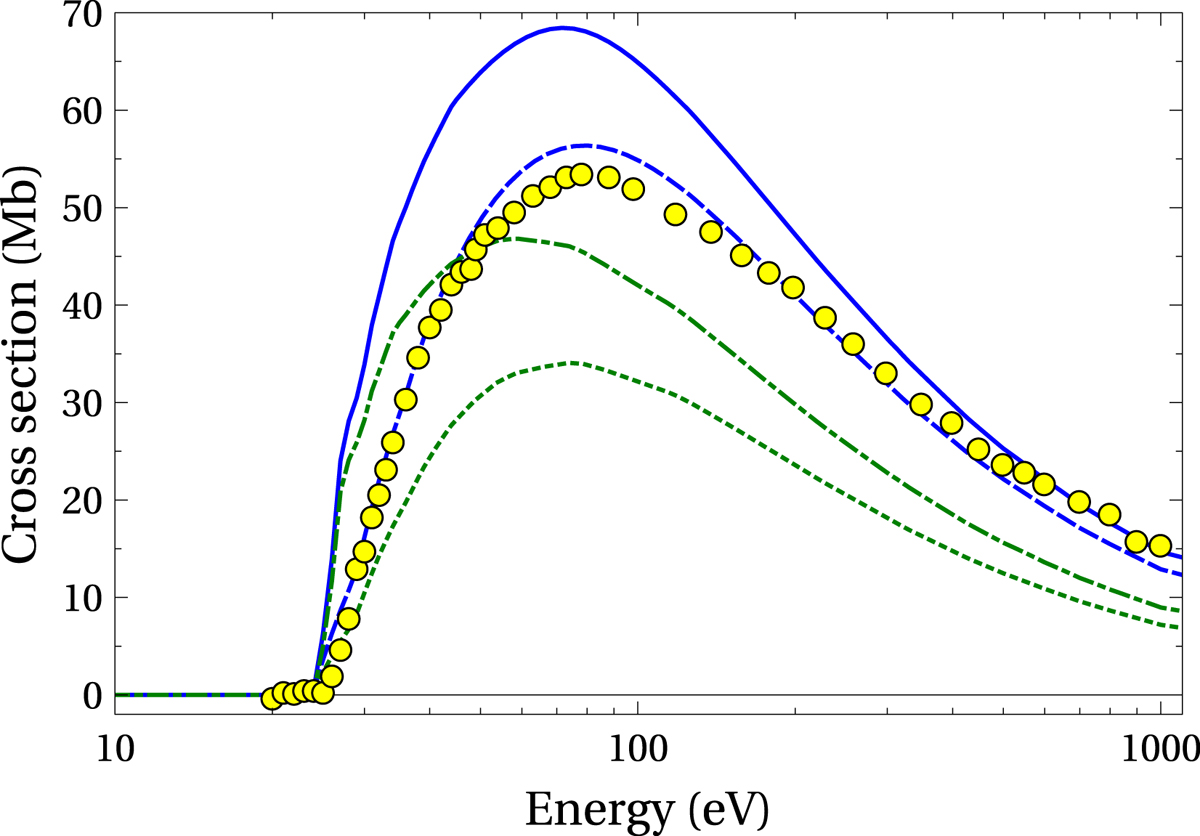
SI cross sections for the C1+ ion. Theoretical values correspond to the DW calculations. Solid line (blue): total SI cross sections with the CI values obtained in the potential of the ionizing ion; dashed line (blue): CI data obtained in the potential of the ionizing ion; dash-dotted line (green): total SI cross sections with the CI values obtained in the potential of the ionized ion; dotted line (green): CI values obtained in the potential of the ionized ion; circles: experiment (Yamada et al. 1989).
Current usage metrics show cumulative count of Article Views (full-text article views including HTML views, PDF and ePub downloads, according to the available data) and Abstracts Views on Vision4Press platform.
Data correspond to usage on the plateform after 2015. The current usage metrics is available 48-96 hours after online publication and is updated daily on week days.
Initial download of the metrics may take a while.