| Issue |
A&A
Volume 689, September 2024
|
|
|---|---|---|
| Article Number | A322 | |
| Number of page(s) | 9 | |
| Section | Atomic, molecular, and nuclear data | |
| DOI | https://doi.org/10.1051/0004-6361/202450367 | |
| Published online | 23 September 2024 | |
Electron-impact double ionization cross sections and rate coefficients for Be-like ions: B+ to Ne6+★
School of Nuclear Science and Technology, Lanzhou University,
Lanzhou
730000,
China
Received:
14
April
2024
Accepted:
7
August
2024
Abstract
We report a detailed analysis of the electron-impact double ionization process for Be-like ions, spanning charge states from B+ to Ne6+. We considered both direct and indirect double ionization processes. For direct double ionization, we calculated the cross sections by considering three different processes: ionization-ionization (II), excitation-ionization-ionization (EII), and ionization-excitation-ionization (IEI). Our results show excellent agreement between the measured cross sections for Be-like-B and Be-like-O ions. The agreement is slightly weaker for Be-like-Ne ions when we take the potential of ionized ions in the distorted-wave method. For other ions for which experimental data are not available, our calculations should provide the missing data. We have summarized the trends of electron-impact double ionization cross sections with atomic number for isoelectronic sequences. Finally, we have provided the Maxwellian and non-Maxwellian rate coefficients for these Be-like ions. The data obtained should be useful for both equilibrium and non-equilibrium charge-state distributions in astrophysical research.
Key words: atomic data / atomic processes / plasmas
We acknowledge support from the National Natural Science Foundation of China Grant No. 12374231.
Corresponding authors; This email address is being protected from spambots. You need JavaScript enabled to view it. , This email address is being protected from spambots. You need JavaScript enabled to view it.
© The Authors 2024
 Open Access article, published by EDP Sciences, under the terms of the Creative Commons Attribution License (https://creativecommons.org/licenses/by/4.0), which permits unrestricted use, distribution, and reproduction in any medium, provided the original work is properly cited.
This article is published in open access under the Subscribe to Open model. This email address is being protected from spambots. You need JavaScript enabled to view it. to support open access publication.
1 Introduction
Electron-impact ionization cross sections are essential for the analysis of astrophysics and laboratory plasmas (Burgess & Chidichimo 1983; Schippers et al. 2019). Knowledge of the charge state distribution (CSD) of the plasma, which is determined by ionization and recombination, is needed to interpret observations and model plasma processes (Jonauskas 2018; Müller 1986). Additionally, accurate cross section data for electron-impact ionization are also needed to interpret the spectra of collisionally ionized plasmas (Hahn et al. 2012) and construct synthetic spectra to compare with the nebular spectra (Liu & Jeffery 1998). Although electron-impact single ionization is the most intense of all ionization processes, multiple ionization can be important (Müller 1986), especially for non-equilibrium plasmas (Hahn & Savin 2015). Take Xe as an example. Müller (1986) pointed out that when multiple ionization is neglected, Xeq+ ion abundances (q = 0, 1, ..., 6) for an electron energy of 700 eV are off by a factor of up to 2, both in peak value and in time necessary to reach the peak value. Multiple ionization becomes significant in dynamic systems where the ions are suddenly exposed to higher electron temperatures. Accurate multiple electron-impact ionization data are needed to calculate the CSD for astrophysics (Hahn & Savin 2015; Heuer & Foster 2021).
In recent years, many researchers have investigated the electron-impact double ionization (EIDI) cross sections of Cq+, Nq+, Oq+, and so on by experimental (Lecointre et al. 2013; Zambra et al. 1994; Westermann et al. 1999) and theoretical (Talukder et al. 2009; Shevelko et al. 2005; Jonauskas et al. 2014; Koncevičiūtė & Jonauskas 2016; Jonauskas 2018; Liu & Yuan 2018; Ma et al. 2020, 2023) methods. However, for Be-like B+ to Ne6+, only experimental observations have been reported for B+ (Shevelko et al. 2005), O4+ (Westermann et al. 1999) and Ne6+ (Duponchelle et al. 1997). In terms of C2+, N3+ and F5+, there are neither experimental measurements nor theoretical investigations available in the published works.
In this work, we investigate the EIDI process for Be-like-B+ to Ne6+ ions by considering both the direct double ionization (DDI) process and the indirect double ionization (IDI) process. IDI refers to ionization with subsequent autoionization (IA). In terms of DDI, we used a multi-step approach (Koncevičiūtė & Jonauskas 2021) that involves three processes: ionization-ionization (II), excitation-ionization-ionization (EII), and ionization-excitation-ionization (IEI). Our calculations supplement the relevant EIDI data and fill a gap in the ionization data of Be-like ions. The subsequent sections of this paper are arranged as follows: Sec. 2 provides the calculation details about EIDI cross sections and rate coefficients. In Sec. 3, taking oxygen as an example, we discuss the cross sections of each EIDI process in detail. We also present our investigation results of rate coefficients in this section. Finally, in Sec. 4, we summarize the paper and provide a preview of future work.
2 Calculations
We employed two- and three-step approaches (Koncevičiūtė & Jonauskas 2021) to study the EIDI of Be-like ions. Both the direct and indirect processes of electron-impact ionization contribute to the total cross sections of double ionization. Thus, the total EIDI cross sections can be calculated as
![Mathematical equation: $\[\sigma_{i f}^{D I}(\epsilon)=\sigma_{i f}^{D D I}(\epsilon)+\sum_j \sigma_{i j}^{C I}(\epsilon) B_{j f}^a,\]$](/articles/aa/full_html/2024/09/aa50367-24/aa50367-24-eq1.png) (1)
(1)
where ![Mathematical equation: $\[\sigma_{i f}^{D D I}(\epsilon)\]$](/articles/aa/full_html/2024/09/aa50367-24/aa50367-24-eq2.png) is the DDI cross section and
is the DDI cross section and ![Mathematical equation: $\[{\sum}_j \sigma_{i j}^{C I}(\epsilon) B_{j f}^a\]$](/articles/aa/full_html/2024/09/aa50367-24/aa50367-24-eq3.png) describes the IDI processes: collision-ionization (CI) followed by autoionization through the intermediate level j of the ionized ions. Here
describes the IDI processes: collision-ionization (CI) followed by autoionization through the intermediate level j of the ionized ions. Here ![Mathematical equation: $\[\sigma_{i j}^{C I}(\epsilon)\]$](/articles/aa/full_html/2024/09/aa50367-24/aa50367-24-eq4.png) represents the CI cross section from level i of j Aq+ to level j of A(q+1)+ and ϵ is the energy of the incident electron. Furthermore,
represents the CI cross section from level i of j Aq+ to level j of A(q+1)+ and ϵ is the energy of the incident electron. Furthermore, ![Mathematical equation: $\[B_{j f}^a\]$](/articles/aa/full_html/2024/09/aa50367-24/aa50367-24-eq5.png) is a branching ratio for the autoionization process from level j of A(q+1)+ to level f of A(q+2)+, which can be expressed as
is a branching ratio for the autoionization process from level j of A(q+1)+ to level f of A(q+2)+, which can be expressed as
![Mathematical equation: $\[B_{j f}^a=\frac{A_{j f}^a}{\sum_m A_{j m}^a+\sum_n A_{j n}^r}.\]$](/articles/aa/full_html/2024/09/aa50367-24/aa50367-24-eq6.png) (2)
(2)
where Aa and Ar denote the Auger rates and radiative transition probabilities, respectively.
The DDI cross section consists of three parts, namely II, EII, and IEI paths. The equation for the II process from level i of Aq+ to level j of A(q+2)+, which involves two sequential CI processes, can be expressed as
![Mathematical equation: $\[\sigma_{i f}^{D D I(I I)}(\epsilon)=\sum_j \sigma_{i j}^{C I}(\epsilon) \int_{E_{j f}}^{\epsilon-E_{i j}} \rho_{i j}\left(\epsilon, \epsilon_1\right) \frac{\sigma_{j f}^{C I}\left(\epsilon_1\right)}{4 \pi \bar{R}_{n l}^2} d \epsilon_1.\]$](/articles/aa/full_html/2024/09/aa50367-24/aa50367-24-eq7.png) (3)
(3)
Here Eij is the transition energy and ϵ1 the energy of the scattered or ejected electron, which can collide with one of the remaining bound electrons from the nl subshell and eject it. The term ![Mathematical equation: $\[\bar{R}_{n l}\]$](/articles/aa/full_html/2024/09/aa50367-24/aa50367-24-eq8.png) describes the mean orbital radius between the electron in the nl subshell and the nucleus. The term ρij(ϵ, ϵ1) represents an energy distribution function (Koncevičiūtė & Jonauskas 2021), which should be normalized to unity on the energy scale
describes the mean orbital radius between the electron in the nl subshell and the nucleus. The term ρij(ϵ, ϵ1) represents an energy distribution function (Koncevičiūtė & Jonauskas 2021), which should be normalized to unity on the energy scale ![Mathematical equation: $\[\int_0^{\epsilon-E_{i j}} \rho_{i j}\left(\epsilon, \epsilon_1\right) d \epsilon_1=1\]$](/articles/aa/full_html/2024/09/aa50367-24/aa50367-24-eq9.png) . The term
. The term ![Mathematical equation: $\[\int_{E_{j f}}^{\epsilon-E_{i j}} \rho_{i j}\left(\epsilon, \epsilon_1\right) \frac{\sigma_{j f}^{C l}\left(\epsilon_1\right)}{4 \pi \bar{R}_{n l}^2} d \epsilon_1\]$](/articles/aa/full_html/2024/09/aa50367-24/aa50367-24-eq10.png) represents the probability of the second electron-impact ionization and the factor
represents the probability of the second electron-impact ionization and the factor ![Mathematical equation: $\[\frac{\sigma_{j f}^{C I}\left(\epsilon_1\right)}{4 \pi \bar{R}_{n l}^2}\]$](/articles/aa/full_html/2024/09/aa50367-24/aa50367-24-eq11.png) the probability of ionization caused by the electron with energy ϵ1.
the probability of ionization caused by the electron with energy ϵ1.
Similarly, the equation for two other DDI processes from level i of Aq+ to level j of A(q+2)+ can be written as
![Mathematical equation: $\[\begin{array}{r}\sigma_{i f}^{D D I(E I I)}(\epsilon)=\sum_{j k} \sigma_{i j}^{C E}(\epsilon) \frac{\sigma_{j k}^{C I}\left(\epsilon-E_{i j}\right)}{4 \pi \bar{R}_{n l}^2} \int_{E_{k f}}^{\epsilon-E_{i j}-E_{j k}} \\\rho_{j k}\left(\epsilon-E_{i j}, \epsilon_1\right) \frac{\sigma_{k f}^{C I}\left(\epsilon_1\right)}{4 \pi \bar{R}_{n^{\prime} l^{\prime}}^2} d \epsilon_1.\end{array}\]$](/articles/aa/full_html/2024/09/aa50367-24/aa50367-24-eq12.png) (4)
(4)
where ![Mathematical equation: $\[\sigma_{i j}^{C E}(\epsilon)\]$](/articles/aa/full_html/2024/09/aa50367-24/aa50367-24-eq13.png) represents the collision-excitation (CE) cross section from level to level j of Aq+ caused by an electron with energy ϵ. Furthermore, Ejk and Ekf are the threshold energies from level j of Aq+ to level k of A(q+1)+ and from level k of A(q+1)+ to level f of A(q+2)+, respectively.
represents the collision-excitation (CE) cross section from level to level j of Aq+ caused by an electron with energy ϵ. Furthermore, Ejk and Ekf are the threshold energies from level j of Aq+ to level k of A(q+1)+ and from level k of A(q+1)+ to level f of A(q+2)+, respectively.
![Mathematical equation: $\[\begin{aligned}\sigma_{i f}^{D D I(I E I)}(\epsilon)= & \sum_{j k} \sigma_{i j}^{C I}(\epsilon) \int_{E_{j k}}^{\epsilon-E_{i j}} \rho_{i j}\left(\epsilon, \epsilon_1\right) \\& \frac{\sigma_{j k}^{C E}\left(\epsilon_1\right)}{4 \pi \bar{R}_{n l}^2} \frac{\sigma_{k f}^{C I}\left(\epsilon_1-E_{j k}\right)}{4 \pi \bar{R}_{n^{\prime} l^{\prime}}^2} d \epsilon_1.\end{aligned}\]$](/articles/aa/full_html/2024/09/aa50367-24/aa50367-24-eq14.png) (5)
(5)
Here ![Mathematical equation: $\[\frac{\sigma_{j k}^{C E}\left(\epsilon_1\right)}{4 \pi R_{n l}^2}\]$](/articles/aa/full_html/2024/09/aa50367-24/aa50367-24-eq15.png) is the excitation probability of an electron from the nl subshell of level j to level k.
is the excitation probability of an electron from the nl subshell of level j to level k.
The rate coefficients can be expressed as:
![Mathematical equation: $\[R=\int_{I_0}^{\infty} v \sigma(\epsilon) f_e(\epsilon) d \epsilon,\]$](/articles/aa/full_html/2024/09/aa50367-24/aa50367-24-eq16.png) (6)
(6)
where ϵ is the incident electron energy, I0 the ionization threshold, σ(ϵ) the electron-impact ionization cross section, fe(ϵ) the electron energy distribution function (EEDF) of the incident electron, and v the electron velocity, which can be expressed as
![Mathematical equation: $\[v=c \frac{\sqrt{\left(\epsilon+2 m_e c^2\right) \epsilon}}{\epsilon+m_e c^2}.\]$](/articles/aa/full_html/2024/09/aa50367-24/aa50367-24-eq17.png) (7)
(7)
In this work, three different EEDFs are taken into account: Maxwellian:
![Mathematical equation: $\[F_M\left(\epsilon, T_e\right)=\frac{2 \sqrt{\epsilon}}{\sqrt{\pi} T_e^{1.5}} e^{-\epsilon / T_e}.\]$](/articles/aa/full_html/2024/09/aa50367-24/aa50367-24-eq18.png) (8)
(8)
Gaussian:
![Mathematical equation: $\[F_G\left(\epsilon, T_e\right)=\frac{1}{w \sqrt{\pi}}\left[1-\frac{2}{1-{erf}\left(-T_e / w\right)}\right] e^{-\left(\frac{\epsilon-T_e}{w}\right)^2}.\]$](/articles/aa/full_html/2024/09/aa50367-24/aa50367-24-eq19.png) (9)
(9)
and power-law:
![Mathematical equation: $\[F_P\left(\epsilon, T_e\right)=\frac{\gamma-1}{T_e^{1-\gamma}} \epsilon^{-\gamma}, \epsilon \geq T_e.\]$](/articles/aa/full_html/2024/09/aa50367-24/aa50367-24-eq20.png) (10)
(10)
where Te is the given temperature, w can be defined by the full-width-half-maximum, erf is the error function, and γ is the decay constant.
The calculated EIDI cross section can be fitted by the following formula:
![Mathematical equation: $\[\sigma_{\text {total}}^{\epsilon I_0}(\epsilon)=\frac{10^{-13}}{\epsilon I_0}\left[A_0 \ln \frac{\epsilon}{I_0}+\sum_{i=1}^8 A_i\left(1-\frac{I_0}{\epsilon}\right)^i\right].\]$](/articles/aa/full_html/2024/09/aa50367-24/aa50367-24-eq21.png) (11)
(11)
where I0 is the ionization threshold and A0 and Ai are the nine fitting coefficients.
We calculated the atomic energy levels and radiative transition probabilities using the fully relativistic flexible atomic code (FAC) (Gu 2008). For the autoionization rates and electron-impact single ionization and excitation cross sections, we used the level-to-level distorted-wave (LLDW) method implemented in the FAC. These cross sections, along with the subroutine to determine the energy distribution function of scattered or ejected electrons, had to be integrated using Eqs. (3)–(5). We performed the numerical calculations for hundreds of ionization channels to obtain the EIDI cross sections using a homemade program written in Python. In addition, we utilized the different EEDFs determined in Eqs. (8)–(10) to calculate the rate coefficients. To determine the mean orbital radius, we used GRASP2018 (Fischer et al. 2019) with a single configuration. Table A.1 in the appendix presents the mean orbital radii used in the calculations.
3 Results and discussion
The EIDI cross sections of Be-like ions are discussed in this section. We first examine the energy distribution function of scattered or ejected electrons.
The energy distribution function of scattered or ejected electrons can be approximated by the differential scattering cross section, which is represented by the analytic formula (44) in Kim & Rudd (1994). We plotted the corresponding energy distribution diagram for incident electron energies of 300 eV, 500 eV, and 5000 eV, respectively. The results are depicted in Fig. 1, in which the energy distribution was scaled down to a maximum of one. In the calculation, the energy distribution was normalized so that the integral would be one. Both the horizontal and vertical axes were reduced to one. As observed in Fig. 1, the energy of the scattered or ejected electron exhibits a symmetrical distribution after the incident electron collides with the target ion at a certain energy T. This phenomenon is easy to comprehend: as an incident electron interacts with the target ion, a portion of the incident energy is utilized to overcome the binding force between the bound electron and the nucleus, and the remaining energy is shared between the scattered and the ejected electrons. Since electrons are identical particles, the scattered and ejected electrons are indistinguishable after the initial collision. When the energy of one electron increases, the energy of the other electron must decrease, and the sum of their energies remains a certain value,
![Mathematical equation: $\[E=T-I,\]$](/articles/aa/full_html/2024/09/aa50367-24/aa50367-24-eq22.png) (12)
(12)
where E is the energy of the scattered or ejected electron, T the energy of the incident electron, and I the ionization threshold of the first CI.
We compared the currently calculated EIDI threshold for Be-like ions using the FAC code with the values provided by the National Institute of Standards and Technology (NIST) database in Table 1. The EIDI threshold for B+ calculated by FAC shows the largest deviation from the value provided by the NIST database, with a relative error of 3.0%. As the charge state increases, the relative error decreases. For Ne6+, the relative error is only 0.83%.
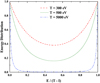 |
Fig. 1 Energy distribution of the intermediate electron (with kinetic energy E) in the primary electron-impact single ionization (with ionization potential I) e− + O4+ → 05+ + 2e− for the incident energies T = 300 eV, 500 eV, and 5000 eV. The energy distribution depicted in Fig. 1 was reduced to a maximum of one. |
Theoretical double ionization thresholds (in eV) for the Be-like ions.
Ionization channels of Be-like ions for the II process.
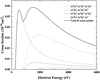 |
Fig. 2 Cross section of II process for O4+. 3.1. O4+ |
3.1 O4+
In this section, we discuss the EIDI results of O4+ in detail and compare the calculated data with available experimental results.
3.1.1 Ionization-ionization (II)
The process named ionization-ionization can be understood as two successive collision ionizations. The Be-like ion with the ground configuration of 1s22s2, one of the electrons in the inner or outer shell, is ionized after interacting with an incident electron. The ejected electron produced during the first ionization process continues to interact with the ions, leading to the second-step ionization process. Table 2 shows the specific ionization channels. There are four channels corresponding to the II process. Fig. 2 shows the DI cross section of these channels.
From Fig. 2, we know that the contribution of channel 1s22s2 → 1s12s2 → 1s12s1 is the largest, accounting for 54.5% of the total II cross section. The contribution from 1s22s2 → 1s12s2 → 2s2 is minimal. The cross section for the channel 1s22s2 → 1s22s1 → 1s2 is smaller than those of the channels 1s22s2 → 1s22s1 → 1s12s1 and 1s22s2 → 1s12s2 → 1s12s1. This is because the average orbital radius of the electrons in the outer shell is much larger than in the inner shell, as determined by Eq. (3). Figure 2 also presents the total II cross section. It is noteworthy that in the low-energy regions (i.e. when the energy of the incident electron is less than 893 eV), the cross section of the II process is predominantly from the channel 1s22s2 → 1s22s1 → 1s2, resulting in the two curves overlapping.
3.1.2 Excitation–ionization–ionization (EII)
In the first step of the EII process, one of the electrons becomes excited when the incident electron collides with the ion. Subsequently, two successive CI processes, which are similar to the II process, take place. Table 3 shows the specific ionization channels. There are 112 channels in the EII process. The cross sections of these channels are illustrated in Fig. 3. It is important to note that we have only highlighted the channels that make a significant contribution to the total EII cross section.
As seen in Fig. 3, we found that the cross section of channel 1s22s12p1 → 1s12s12p1 → 2s12p1 contributes the most to the EII process. The primary contribution of the EII process comes from this channel. Additionally, there are two channels with comparable contributions: 1s12s24s1 → 2s24s1 → 2s2 and 1s12s24s1 → 1s12s2 → 2s2. The former mainly contributes when the energy is low, while the latter mainly contributes in the high-energy region. Moreover, at high energy levels, another channel with a non-negligible contribution is 1s12s24s1 → 1s12s14s1 → 2s14s1. The contribution of other channels to the EII process is several orders of magnitude smaller than these and is considered negligible. Comparing the total cross section of the EII process with the II process, it is evident that the contribution of the EII process is smaller than that of the II process, but remains within the same order of magnitude.
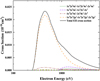 |
Fig. 3 Cross section of the EII process for O4+. We note that only a few channels with the largest contributions are indicated. |
3.1.3 Ionization–excitation–ionization (IEI)
During the IEI process, an ionization process occurs first, when an incident electron collides with the ion. Then the ejected or scattered electron causes excitation with subsequent CI. Table 4 shows the specific ionization channels. There are 82 channels in the IEI process, and their cross sections are shown in Fig. 4. As with the EII process, we have only indicated the channels where the contribution is relatively larger.
As seen in Fig. 4, we know that the channel 1s22s1 → 1s12s2 → 1s12s1 has an extremely large cross section that dominates the entire IEI process. At its peak, this channel’s contribution is as high as 89.18%. This result is easy to understand. For the channel 1s22s1 → 1s12s2 → 1s12s1, the first ionization process occurs in the outer shell of the configuration 1s22s2. Then the electron of the 1s shell is excited to the nearest 2s shell. The last ionization process is similar to the first one, in which the electron of the outer shell is ionized. Since both ionizations occur in the outer shell, the ionization process is more likely to take place, resulting in a larger cross section. In addition to this channel, there are two other channels worth mentioning: 1s22s1 → 1s22p1 → 1s12p1 and 1s22s1 → 1s12s14s1 → 2s14s1, respectively. Although the cross sections of these channels are much smaller than the first one, they have a noticeable effect on the total cross section. The difference is that the former contributes more when the energy is lower, while the latter only contributes when the energy of the incident electron is greater than 900 eV.
3.1.4 Indirect double ionization (IDI)
The IDI process refers to CI that occurs in the inner shell with subsequent autoionization. We considered two conditions: theoretical cross sections calculated in the potential of ionizing and ionized ions, respectively, in our calculations. The results are shown in Fig. 5. The blue arrow indicates the ionization threshold (600 eV) of the 1s subshell for O4+. In Fig. 5, we can see that the cross section obtained from the potential of ionizing ions is larger than the ionized one when the incident electron energy is higher (up to 7%) than 1000 eV.
3.1.5 Comparison with experiment
Last, we compared the calculated EIDI cross sections with experimental data by Westermann et al. (1999) in Fig. 6. When the energy of the incident electron is below 600 eV, the IDI process channel is closed, and the total cross section is solely contributed by DDI. However, when the energy exceeds 600 eV, the IDI process dominates the total cross sections. Our theoretical results align excellently with the experiment across the entire energy range if we adopted the potential of the ionized ions in the calculation of the IDI cross section. At 3462 eV, the largest discrepancy between our calculations and experimental values is only 6.24%. This suggests that if we incorporate all significant ionization channels into the calculation, the calculated EIDI cross section is highly reliable.
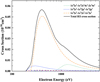 |
Fig. 4 Same as Fig. 2 but for the IEI process. The first configuration in these channels represents the configuration after 1s22s2 ionized. |
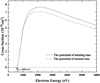 |
Fig. 5 cross section of the IDI process for O4+. The arrow indicates the ionization threshold of the 1s subshell for O4+. |
3.2 Ne6+
Because the DDI and IDI processes are similar to O4+, we have only provided the total EIDI cross section of Ne6+ in Fig. 7. We compared our calculation results with those of the Lotz formula (Lotz 1968), the R-matrix method, and the experimental findings of Duponchelle et al. (1997). The Lotz formula is only applicable for calculating the cross section of single ionization. To use it to calculate EIDI cross sections, one can calculate the single ionization cross sections of the first-step ionization and then multiply it by the branching ratio of autoionization (IDI process), which is assumed to be 100%. For Be-like ions, assuming a 100% branching ratio of autoionization in the IDI process is reasonable, as we have also conducted relevant calculations with the FAC, yielding a 100% result. However, this implies that in terms of double ionization, the Lotz formula can only calculate the cross section of the IDI process and does not provide additional information about DDI. Our theoretical result is 5.65% higher than the R-matrix at the peak and 3.68% lower than the Lotz formula. The experimental results of Duponchelle et al. are lower than the three theoretical cross sections. In the intermediate energy region, the theoretical and experimental values align well.
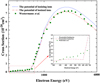 |
Fig. 6 Total EIDI cross section for O4+. |
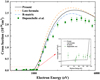 |
Fig. 7 Total EIDI cross section for Ne6+. |
3.3 B+
Figure 8. compares our calculation results for B+ with those of Koncevičiūtė & Jonauskas (2021) and the experimental findings of Shevelko et al. (2005). As with O4+, the theoretical and experimental values are in good agreement. Additional benchmark measurements for Ne6+ will help validate the accuracy of the calculations.
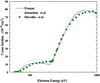 |
Fig. 8 Total EIDI cross section for B+. |
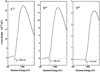 |
Fig. 9 Total EIDI cross section for B+, C2+, N3+, and F5+. The arrows indicate the ionization threshold of the 1s shell for configuration 1s22s2. |
3.4 C2+, N3+, and F5+
Figure 9 displays our calculations. It is evident that for the iso-electronic sequence, the EIDI cross sections gradually decrease with the increase in atomic number. This trend is consistent for both the DDI and the IDI processes. Consequently, as the atomic number increases, the contribution of the DDI to the total EIDI cross sections diminishes. Specifically, when the atomic number reaches ten, corresponding to Be-like-Ne ions, the contribution of DDI is 0.7%, which can be disregarded. For heavier elements, it is sufficient to calculate the cross sections of the IDI process.
3.5 Fitting coefficients
Finally, we used Eq. (11) to fit the EIDI cross section we calculated. The fitting coefficients are shown in Table A.2.
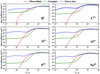 |
Fig. 10 Be-like ions EIDI rate coefficients for different distributions. The red square is the Maxwellian distribution, the green circle the Gaussian distribution with w = I0, and the blue triangle the power-law distribution. |
3.6 EIDI rate coefficients
We present the EIDI rate coefficients for different electron energy distributions in Fig. 10 for Be-like ions, respectively. The rate coefficients were plotted for the different EEDFs and the characteristic distribution energy Te, which was scaled by the ionization threshold I0.
The rate coefficients are intricately linked to the type of EEDF when Te is less than I0. When Te surpasses I0, all the distributions exhibit the same trend. This is due to a significant presence of high-energy electrons in a high-temperature environment, rendering the impact of the energy distribution function on the rate coefficients negligible. Furthermore, the results indicate that the rate coefficients decrease with an increase in atomic number for Be-like ions.
It is noted that the commonly used EEDF in the EIDI rate coefficient calculations is the Maxwellian energy distribution. In fact, different EEDFs have a wide range of applications in large scientific installations and physical fields. For example, a Gaussian energy distribution has been employed in the electron beam ion trap (EBIT) installation, and a power-law energy distribution has been widely applied in astrophysics.
4 Summary and conclusions
We calculated the EIDI cross sections for Be-like B+ to Ne6+ ions with contributions from all the DDI and IDI channels. The EIDI cross sections of B+ and O4+ obtained are in good agreement with measurements, while the cross sections of Ne6+ are slightly higher than the experimental data. We reported the Maxwellian and non-Maxwellian rate coefficients of Be-like ions. Moving forward, there are several tasks to accomplish in the future. First, the EIDI process is crucial, so it is necessary to investigate its contribution for adjacent ions. Second, more EIDI cross sections could be integrated into the CHIANTI database (Dere et al. 2023) and the simulation code (Hahn & Savin 2015; Heuer & Foster 2021).
Appendix A Additional tables
Mean orbital radius (10−10 m) of Be-like ions.
Fitting coefficients of the EIDI cross section (in cm2) for Be-like ions B+ to Ne6+.
References
- Burgess, A., & Chidichimo, C. 1983, MNRAS, 203, 1269 [NASA ADS] [CrossRef] [Google Scholar]
- Dere, P. D., Del Zanna, G., Young, P. R., & Landi, E. 2023, ApJS, 268, 52 [NASA ADS] [CrossRef] [Google Scholar]
- Duponchelle, M., Khouilid, M., Oualim, E. M., Zhang, H., & Defrance, P. 1997, J. Phys. B: At. Mol. Opt. Phys., 30, 729 [NASA ADS] [CrossRef] [Google Scholar]
- Fischer, C. F., Gaigalas, G., J’onsson, P., & Bieroń, J. 2019, Comput. Phys. Commun., 237, 184 [NASA ADS] [CrossRef] [Google Scholar]
- Gu, M. F. 2008, Can. J. Phys., 86, 675 [NASA ADS] [CrossRef] [Google Scholar]
- Hahn, A., Becker, M., Grieser, C., et al. 2012, ApJ, 760, 80 [CrossRef] [Google Scholar]
- Hahn, M., & Savin, D. W. 2015, ApJ, 800, 68 [Google Scholar]
- Heuer, A. R., & Foster, R. 2021, ApJ, 908, 3 [NASA ADS] [CrossRef] [Google Scholar]
- Jonauskas, V. 2018, A&A, 620, A188 [NASA ADS] [CrossRef] [EDP Sciences] [Google Scholar]
- Jonauskas, V., Prancikevičius, A., Masys, v., & Kynienė, A. 2014, Phys. Rev. A, 89, 052714 [NASA ADS] [CrossRef] [Google Scholar]
- Kim, Y. K., & Rudd, M. E. 1994, Phys. Rev. A, 50, 3954 [NASA ADS] [CrossRef] [Google Scholar]
- Koncevičiūtė, J., & Jonauskas, V. 2016, Phys. Rev. A, 93, 022711 [CrossRef] [Google Scholar]
- Koncevičiūtė, J., & Jonauskas, V. 2021, Phys. Rev. A, 104, 042804 [CrossRef] [Google Scholar]
- Lecointre, J., Kouzakov, K. A., Belic, D. S., et al. 2013, J. Phys. B: At. Mol. Opt. Phys., 46, 205201 [NASA ADS] [CrossRef] [Google Scholar]
- Liu, D. J., & Jeffery, D. R. 1998, ApJ, 494, 812 [NASA ADS] [CrossRef] [Google Scholar]
- Liu, P. and Zeng, J., & Yuan, J. 2018, J. Phys. B: At. Mol. Opt. Phys., 51, 075202 [NASA ADS] [CrossRef] [Google Scholar]
- Lotz, W. 1968, Z. Angew. Phys., 216, 241 [Google Scholar]
- Ma, Y., Liu, L., Wu, Y., & Wang, J. 2020, Phys. Rev. A, 101, 052703 [NASA ADS] [CrossRef] [Google Scholar]
- Ma, Y., Liu, L., Wu, Y., et al. 2023, Phys. Rev. A, 107, 032813 [CrossRef] [Google Scholar]
- Müller 1986, Phys. Lett. A, 113, 415 [CrossRef] [Google Scholar]
- Schippers, S., Sokell, E., Aumayr, F., et al. 2019, J. Phys. B, 52, 171001 [Google Scholar]
- Shevelko, V. P., Tawara, H., Fcheuermann, F., et al. 2005, J. Phys. B: At. Mol. Opt. Phys., 38, 525 [NASA ADS] [CrossRef] [Google Scholar]
- Talukder, M. R., Haque, A. K. F., & Uddin, M. A. 2009, Eur. Phys. J. D, 53, 133 [NASA ADS] [CrossRef] [Google Scholar]
- Westermann, M., Scheuermann, F., Aichele, K., et al. 1999, Phys. Scr., 1999, 285 [NASA ADS] [CrossRef] [Google Scholar]
- Zambra, M., Belic, D., Defrance, P., & Yu, D. J. 1994, J. Phys. B: At. Mol. Opt. Phys., 27, 2383 [NASA ADS] [CrossRef] [Google Scholar]
All Tables
Fitting coefficients of the EIDI cross section (in cm2) for Be-like ions B+ to Ne6+.
All Figures
|
Fig. 1 Energy distribution of the intermediate electron (with kinetic energy E) in the primary electron-impact single ionization (with ionization potential I) e− + O4+ → 05+ + 2e− for the incident energies T = 300 eV, 500 eV, and 5000 eV. The energy distribution depicted in Fig. 1 was reduced to a maximum of one. |
| In the text | |
|
Fig. 2 Cross section of II process for O4+. 3.1. O4+ |
| In the text | |
|
Fig. 3 Cross section of the EII process for O4+. We note that only a few channels with the largest contributions are indicated. |
| In the text | |
|
Fig. 4 Same as Fig. 2 but for the IEI process. The first configuration in these channels represents the configuration after 1s22s2 ionized. |
| In the text | |
|
Fig. 5 cross section of the IDI process for O4+. The arrow indicates the ionization threshold of the 1s subshell for O4+. |
| In the text | |
|
Fig. 6 Total EIDI cross section for O4+. |
| In the text | |
|
Fig. 7 Total EIDI cross section for Ne6+. |
| In the text | |
|
Fig. 8 Total EIDI cross section for B+. |
| In the text | |
|
Fig. 9 Total EIDI cross section for B+, C2+, N3+, and F5+. The arrows indicate the ionization threshold of the 1s shell for configuration 1s22s2. |
| In the text | |
|
Fig. 10 Be-like ions EIDI rate coefficients for different distributions. The red square is the Maxwellian distribution, the green circle the Gaussian distribution with w = I0, and the blue triangle the power-law distribution. |
| In the text | |
Current usage metrics show cumulative count of Article Views (full-text article views including HTML views, PDF and ePub downloads, according to the available data) and Abstracts Views on Vision4Press platform.
Data correspond to usage on the plateform after 2015. The current usage metrics is available 48-96 hours after online publication and is updated daily on week days.
Initial download of the metrics may take a while.