| Issue |
A&A
Volume 620, December 2018
|
|
|---|---|---|
| Article Number | A154 | |
| Number of page(s) | 12 | |
| Section | Galactic structure, stellar clusters and populations | |
| DOI | https://doi.org/10.1051/0004-6361/201833534 | |
| Published online | 12 December 2018 | |
Mergers, tidal interactions, and mass exchange in a population of disc globular clusters⋆
1 GEPI, Observatoire de Paris, PSL Research University, CNRS, Place Jules Janssen, 92195 Meudon Cedex, France
e-mail: sergey.khoperskov@obspm.fr
2 Max Planck Institute for Extraterrestrial Physics, 85741 Garching, Germany
3 Max Planck Institute für Astronomie, Konigsthul 17, 69117 Heidelberg, Germany
Received:
30
May
2018
Accepted:
10
September
2018
We present the results of a self-consistent N-body simulation following the evolution of a primordial population of thick-disc globular clusters (GCs). We study how the internal properties of such clusters evolve under the action of mutual interactions, while they orbit a Milky Way-like galaxy. For the first time, through analytical and numerical considerations, we find that physical encounters between disc GCs are a crucial factor that contributed to the shape of the current properties of the Galactic GC system. Close passages or motion on similar orbits may indeed have a significant impact on the internal structure of clusters, producing multiple gravitationally bound sub-populations through the exchange of mass and even mergers. Our model produces two major mergers and a few small mass exchanges between pairs of GCs. Two of our GCs accrete stars from two companions, ending up with three internal sub-populations. We propose these early interactions and mergers between thick disc GCs with slightly different initial chemical compositions as a possible explanation for the spreads in metallicity observed in some of the massive Milky Ways GCs.
Key words: galaxies: evolution / galaxies: kinematics and dynamics / galaxies: structure / globular clusters: general
High-resolution versions of the movies in Figs. 2, 5–7, A.1–A.2 are available at https://www.aanda.org
© ESO 2018
1. Introduction
With ages typically greater than 10 Gyr (Marín-Franch et al. 2009; Carretta et al. 2010; Van den Berg et al. 2013), globular clusters (GCs) are the oldest stellar systems in our Galaxy, and, as such, are tracers of its early formation and mass growth history.
Despite the large number of studies on individual GCs in the Galaxy, and on the Galactic GC system as a whole, we still lack a definite picture of their formation, and of their initial properties, such as the initial mass function of the GC system, and its initial metallicity distribution (Lamers et al. 2017; Forbes et al. 2018; Renaud 2018). This lack of knowledge of the properties of the original GC system makes it difficult to reconstruct its subsequent evolution; the parameter space of the possible initial conditions (initial masses, concentrations, spatial distribution, etc.) on which this evolution may depend is large. The picture is also complicated by the fact that in the Milky Way (MW), as well as in other galaxies, there is evidence that not all GCs formed in situ, that is in the galaxy itself. Part of the current population may indeed have been formed in satellite galaxies and subsequently accreted (Bellazzini et al. 2003; Forbes & Bridges 2010; Leaman et al. 2013; Mackey et al. 2010). Satellite accretions might enlarge the initial population of GCs in a galaxy (Tonini 2013; Renaud et al. 2017), but also kinematically heat the pre-existing in situ population (Kruijssen 2015; Moetazedian & Just 2016), similarly to the case of in situ disc stars. Those stars – repeatedly heated by accretion events – increase their random motions, contributing to the thick disc/-stellar halo field populations (see, e.g. Qu et al. 2011; Jean-Baptiste et al. 2017).
Once considered as single stellar populations made of stars with the same initial chemical composition and same age, GCs have been revealed in the last decade to be much more complex than previously thought. Old and massive clusters show the presence of multiple stellar populations with large star-to-star variations in light element abundances that have been detected both photometrically and spectroscopically, and whose origin is currently debated (Gratton et al. 2012; Bastian & Lardo 2018). Even more striking is the evidence that some Galactic GCs show large metallicity spreads, not compatible with the possibility that these clusters formed in a single burst of star formation. Some of the GCs with large metallicity spreads – like ω Centauri (Johnson & Pilachowski 2010) – have been suggested to have an extragalactic origin. Bekki & Freeman (2003), for example, proposed that ω Cen may constitute the remnant (or nucleus) of a disrupted dwarf galaxy accreted by the MW. Another possibility is that Galactic GCs with metallicity spreads may have been formed by mergers between parent GCs once located within dwarf spheroidal galaxies and subsequently accreted by the MW (van den Bergh 1996; Bekki & Freeman 2003; Gavagnin et al. 2016). The hypothesis of GC mergers taking place in dwarf galaxies – and not in the MW itself – is usually preferred since the probability of mergers and collisions among the current population of Galactic GCs is generally very low, taking into account the current volume they cover and their velocity dispersions (van den Bergh 1996; Gavagnin et al. 2016). However, though this extra-galactic scenario may be valid for some GCs (van den Bergh 1996), it is not entirely reconcilable with the properties of another GalacticGC:Terzan 5. This bulge/inner-disc cluster indeed has been shown to contain a multimodal metallicity distribution function (Massari et al. 2014), covering the whole extent of metallicity of the Galactic bulge, and also a significant age spread (Origlia et al. 2011; Ferraro et al. 2016). Its main populations lie on the same age-metallicity relation described by bulge stars in the field (Ferraro et al. 2016), thus making an extragalactic origin for this cluster very unlikely.
In this paper we aim at starting to explore the evolution of a system of disc GCs, evolving in a MW-like potential. The reasons to study the population of disc GCs are numerous. Firstly, we know that the current population of MW GCs is not only distributed into the Galactic halo: the population of metal-rich clusters (i.e. ≈[Fe/H] > −1 dex) is indeed more concentrated and flatter than that of the more metal-poor GCs – and is indeed associated to the thick disc and bulge populations (Armandroff & Zinn 1988; Armandroff 1989; Zinn 1985, 1990, 1991; Minniti 1995; Barbuy et al. 1998; Côté 1999; Ortolani 1999; Dinescu et al. 1999a,b; Casetti-Dinescu et al. 2007; Van Den Bergh 2003; Bica et al. 2006, 2016). Secondly, even if nowadays this population constitutes only about one third of the total GC population (Harris 1996, 2010 edition), there are reasons to think that the population of disc GCs was larger in the past. Former GC member stars have indeed recently been discovered in the inner regions the Galaxy (Schiavon et al. 2017b; Fernández-Trincado et al. 2017) and simulations also show that tidal effects in the inner kiloparsec of a MW-like galaxy could have been effcient over time in reducing the initial population, destroying part of it (Renaud et al. 2017). Thirdly, part of the initial population of Galactic-disc GCs has experienced kinematic heating over time due to accretion events, and can now be found in the inner halo (Kruijssen 2015), while at high redshifts it may have been formed in a disc. Finally, GCs with kinematics and spatial properties of disc populations also exist in nearby galaxies, as in M31 (see, e.g. Morrison et al. 2004; Caldwell & Romanowsky 2016).
For all these reasons, in this paper we want to initiate a new study of the dynamical evolution of a system of disc GCs. A number of studies have investigated this topic by modelling the evolution of single globular clusters in MW-like potentials, exploring a range of initial masses, concentrations, and orbital parameters for the clusters (Berentzen & Athanassoula 2012; Rossi & Hurley 2015a,b; Rossi et al. 2016, 2017). Other works have studied the evolution of a whole population of open clusters in the disc of a spiral galaxy (Fujii & Baba 2012; Dobbs et al. 2017). The novelty of our work is to present an N-body model of the self-consistent evolution of a whole population of disc GCs, thus naturally taking into account their mutual gravitational interactions. Such an approach has been used in several studies to look at the short-term evolution of thin-disc star clusters (see e.g. Fujii & Baba 2012; Dobbs et al. 2017). More precisely, in this work we present an N-body simulation of a GC system containing 128 resolved clusters with initial masses of 107 M⊙, and whose evolution is followed for 1.5 Gyr. We show that under certain conditions – namely an initially numerous and/or massive-enough GC disc population – mergers, fly-bys, and mass exchanges between GCs can occur over time, at a rate of a few events per gigayear. In a forthcoming study (Mastrobuono-Battisti et al. 2018), we will complement this analysis with a detailed study of the long-term evolution of the remnants of GC mergers, by means of direct N-body simulations. The paper is organised as follows: in Sect. 2, we introduce the Milky Way-like potential adopted in this paper, the modelled GC properties, and the code adopted to run the simulation. In Sect. 3, we make use of a simple analytic treatment to estimate the probability of physical collisions in a system of GCs as a function of their number and spatial distribution. In Sect. 4, we present the results of the N-body simulation, focusing in particular on the mergers, fly-bys, and related mass exchange occurring in our simulated GC system. A discussion and the implications of our results are given in Sect. 5.
2. Model
To follow the internal physics of individual GCs and the evolution of a GC system as a whole we choose to simulate the dynamics of resolved, N-body GCs in an analytic and time-independent MW potential. The advantage of this approach is that it allows the study of the mutual interactions and gravitational effects among simulated GCs, together with their internal evolution, mass gain and loss, all these effects “embedded” in the overall gravitational field exerted by a MW-type galaxy. The limits of this approach are the lack of consideration of the time-dependent variations and inhomogeneities of the galactic gravitational potential. Both these effects are very likely concurring to shape the evolution of the GC system over time (see, e.g. Kruijssen 2015; Renaud et al. 2017).
More specifically, in this work we simulate the dynamics of 128 disc GCs, each cluster being represented by 105 point masses, accounting for a total of 1.28 × 10⁷ particles. We chose to use a number of disc GCs, NGC, greater than the current one in the MW – approximately equal to 501 – under the hypothesis that this latter value for the current number of Galactic disc GCs is not representative of the initial one. This choice is justified by the fact that tidal effects, early disruption, and heating in the halo may all have contributed to reducing the primordial disc population. The exact choice of the initial number NGC = 128 is arbitrary and dictated by the fact that this number allows a particularly effective algorithm for MPI-parallelization.
Each GC is initially represented by a King model with a core radius rc = 4 pc and a tidal radius of rt = 80 pc, corresponding to a dimensionless central potential W0 = 6 (Binney & Tremaine 1987). Each cluster is made of particles all with the same mass m* = 100 M⊙. Their initial positions and velocities, in the absence of the external gravitational galactic potential, have been generated with the NEMO software (Teuben 1995).
The initial positions and velocities of the system of disc GCs have been calculated using the method described in Rodionov et al. (2009). This consists of an iterative method to construct equilibrium phase models of stellar systems, and can be adapted to a number of different mass distributions with arbitrary geometries, satisfying different kinematical constraints. The population of 128 GCs is at equilibrium in the galactic gravitational potential, which is represented by an axisymmetric composite disc made of a thin and a thick component and a spherical dark matter halo. The spatial distribution of this GC population follows a Miyamoto-Nagai density profile (Miyamoto & Nagai 1975) with a characteristic radial length of 2 kpc and a vertical height of 0.8 kpc, similar to those of the Galactic thick disc in Model II of Pouliasis et al. 2017). As shown by these authors, the adopted parameters satisfy a number of observational constraints of the current MW: stellar densities at the solar vicinity, thin and thick disc scale lengths and heights, rotation curve, and the absolute value of the perpendicular force as a function of distance to the galactic centre. No specific kinematical constraint has been introduced to generate the initial velocities of this GC population. We note that the GCs (especially those in the innermost kpcs) are not on circular orbits. The total mass of the GC system is equal to 1.28 × 10⁹ M⊙, but, as we discuss below, this mass diminishes with time, as a result of the evolution of the GCs with the overall Galactic tidal field, and of GC–GC collisions.
To model the evolution of the GC system in this potential, we employ a N-body code (Khoperskov et al. 2014), in which gravitational forces are calculated using an MPI-based parallel hierarchical tree method including Intel’s Advanced Vector Instructions (AVX). We use an opening angle parameter θ = 0.5. A Plummer potential is used to soften gravitational forces, with a constant softening length of ϵ = 0.2 pc. The equations of motion are integrated using a leapfrog algorithm with a fixed time step of 104 yr. The Tree Code works efficiently with the system we simulate, because of the sparse spatial distribution of GCs in the MW-like potential, while the internal evolution of GCs is performed with a direct summation accuracy. We performed several test simulations of a single isolated GC, finding that the choice of our Tree Code parameters and numerical resolution guarantees that the single GC is at equilibrium over timescales longer than those simulated in this work (≈ 1.5 Gyr), with a typical relative error in energy conservation of 1−2% at the end of the simulation.
3. Probability of physical collisions in a system of disc globular clusters
Before moving to show and discuss the results of our N-body simulations, we present here some general considerations regarding the probability of physical collisions and mergers in a GC system. These considerations constitute some of the main motivations for the work presented in this paper, and provide the reasons to numerically investigate the collisions in a system of disc GCs.
The majority of the current population of Galactic GCs are associated to the stellar halo, both because of their individual metallicity ([Fe/H] < −1 dex for about two thirds of the Galactic GC population; see Harris 1996) and current positions (Harris 1996) as well as orbital parameters, when available (Dinescu et al. 1997, 1999a,b, 2003; Casetti-Dinescu et al. 2007, 2010, 2013; Chemel et al. 2018).
Given a number NGC of GCs, redistributed over a volume V, all with identical characteristic radii RGC, the mean free path of a cluster in the system is given by

with n being the cluster volume density, that is n = NGC/V, and Σ the effective collision area, that is Σ = π(2RGC)2. The associated rate of physical collisions between one cluster and another is therefore r = ν/λ, where ν is the typical velocity of the cluster in the system and R is the cumulative rate of collisions over the whole cluster population, which scales quadratically with NGC:
For instance, for a population of one hundred halo GCs, distributed inside a sphere of radius 7 kpc, similar to the half-mass radius of the current population of Galactic halo (i.e. metal-poor, [Fe/H] < −1 dex) GCs, with a typical velocity of 100 km s−1, the cumulative collision rate would be less than 0.1 Gyr−1. In this estimate, we assume that all GCs have a physical size of 3 pc, a typical value for the core radii of the current GCs in the Galaxy. Of course, as shown in Fig. 1 (left panel) and in Eq. (2), this rate is both a function of the number of clusters in the system, and of the spatial extent of the population. As an example, to have at least one collision per gigayear in a population of one hundred GCs redistributed in a spherical halo, the spatial extent of this population should be of about 3 kpc, thus significantly smaller than the current extent of the system of halo GCs in the Galaxy. However, for the same number of GCs, the rate of collisions is significantly higher if this population is redistributed in a disc, rather than in a halo. As an example, for a system of NGC = 128 GCs redistributed in a disc whose scale-length and scale-height are respectively equal to 2 kpc and 1 kpc – thus similar to the scale-length and height of the Galactic thick disc (Bovy et al. 2012, 2016) – the rate of physical collisions would be 1.8 Gyr−1. As well as for the halo, for a population of disc GCs this rate is both a function of the number of GCs, and of their radial and vertical extent, as shown in the middle and right panels of Fig. 1. In all cases, if this population is redistributed in a compact, flattened configuration – as is the case of the current population of metal-rich GCs in the Galaxy, (see, e.g. Armandroff 1989), and if this population is large enough, one to two collisions per gigayear can be expected. In other words, collisions and mergers of GCs could have taken place also in situ, that is, in our Galaxy, and not necessarily only in dwarf galaxies with subsequent accretion into the Milky Way (van den Bergh 1996; Gavagnin et al. 2016) provided that, at early epochs, the Galactic GC system was numerous and compact enough. In the following, we indeed show by means of our N-body simulation, that such a collision rate is realistic, and that indeed gravitational interactions can take place in a system of disc GCs with similar characteristics in terms of number of clusters, scale length, and height leading to mergers, fly-bys, and mass exchanges.
 |
Fig. 1. Cumulative collision rate as a function of the number of GCs, in the case of a homogeneous spherical distribution (left panel), and of a disc distribution (middle and right panels). The colour code refers to the size of the spherical halo (left panel), the radial scale length of the disc (middle panel) for a fixed scale height of 0.8 kpc, and the vertical scale height (right panel) for a fixed scale length of 2 kpc. In each plot, the inset shows a zoom for a number of clusters between 40 and 150. In the inset in the middle and right panels, the asterisk indicates the collision rate corresponding to a disc of scale length of 2 kpc and scale height of 0.8 kpc. |
4. Evolution of an N-body system of disc GCs: Results
4.1. Unbound stars, major mergers, and mass accretions: some definitions
The stellar density distribution of the GC system after 1 Gyr of evolution in the galactic potential described in Sect. 2 is shown in Fig. 2. Most of the GCs are redistributed in the inner few kiloparsec of the Galaxy, with only a few clusters at distances greater than r = 5 kpc from the Galactic centre. In this figure, GCs appear as density peaks of the stellar distribution, embedded in a low-density field of stars escaped from the clusters over time. This loss of stellar mass from the clusters is the consequence of the action of the galactic gravitational field and of the mutual gravitational interactions among GCs, as we will discuss in more detail in Mastrobuono-Battisti et al. (2018). The effect of the galactic tidal field is also responsible for generating extended tidal tails around clusters, which are probes – on large scales – of the GC orbits (Montuori et al. 2007).We note that the evaporated stars are distributed in a thick-disc-like structure and contribute significantly to the bulge region, where populations of disrupted GCs have recently been observed in the Milky Way inner disc (see e.g. Schiavon et al. 2017a; Fernández-Trincado et al. 2017; Lee et al. 2018). To quantify the number of mergers and the amount of mass exchange between clusters, we define the following quantities. The escaped mass is defined as the difference between the gravitationally bound mass of the GC at any given time t, and its initial mass.
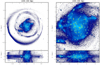 |
Fig. 2. Stellar density distribution (in logarithmic scale) of the entire globular cluster system in our simulation. Projections on the xy and xz planes are shown. In the right panels, a zoom in the inner disc regions is shown. Bound globular cluster stars are clearly seen as red over-densities, while light/dark blue regions correspond to stars escaped from the clusters and lost in the field. The high-resolution animation of the evolution of the simulated GC system is available online. |
Bound stars are defined as all stars inside the cluster tidal radius which have a negative energy:
where Ekin and Epot are the kinetic and potential energy of a star.
Finally, following Just et al. (2009), the cluster tidal radius rt is defined as
where M is the mass of the cluster, β = κ/Ω is the normalized epicyclic frequency, Ω is the angular speed of the cluster on a circular orbit at its guiding radius, and V(R) is the value of rotation curve at a distance R from the centre. In our simulations, the typical value of the tidal radius varies in the range of 100 − 300 pc, while the core density is in the range of (5−10) × 103M⊙ pc−3.
Over the first 1−1.5 Gyr of evolution, most of the GCs have maintained the majority of their initial mass, and only 14 clusters, corresponding to 10% of the GCs in the system, have lost more than 20% of their initial mass, as shown in Fig. 3 (top panel). For the same orbital guiding radius, GCs that experience a strong mass loss tend to have slightly higher orbital eccentricities (shown by colour), as shown in Fig. 3 (bottom panel). Globally, of the initial mass MGC = 1.28 × 10⁹ M⊙ in the GC system, 9.6% is unbound and dispersed into the field after 1.5 Gyr. The bottom panel of Fig. 3 shows that the amount of mass loss from a GC depends on its guiding radius; the lower the GC guiding radius, the higher the fraction of stellar mass lost over time. In particular this plot shows the existence of a zone of avoidance, with the escaped mass fraction always being higher than a minimum value which depends on the GC guiding radius.
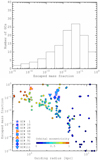 |
Fig. 3. Top panel: distribution of the escaped mass fraction from the simulated GCs, after 1.5 Gyr of evolution. Bottom panel: escaped mass fraction as a function of the orbital guiding radius. Colour code depicts the GCs orbital eccentricity. |
We have checked that this trend is not due to an initial internal relaxation of our GCs – since we do not see any rapid expansion of the simulated GCs once placed in the galactic field. It is rather a consequence of GC-GC collisions – whose rate is higher among clusters with small guiding radii – and of the significant variations in the tidal field experienced by clusters with high orbital eccentricities, which are preferentially found in the inner few kiloparsec of the galaxy. Both these effects contribute to determine the trends observed in Fig. 3.
Together with the effect of the mean galactic gravitational field, the GC system evolves also through the effect of mutual GC interactions. We assume that a GC contains an external population if stars from another (or several) cluster(s) are located within its tidal radius and if their energies satisfy the condition shown in Eq. (3). We refer to the GC that has accreted mass from another GC as the host, while the accreted stars are referred to as the external population. We define a major merger between GCs as an accretion where two interacting GCs completely merge and, as a consequence, the external population has a mass comparable to the bound mass of the host. Accretions where the host contains at least 1% of mass accreted from another GC, without any subsequent major merger, are referred to as mass exchanges or mass captures. In the following, we describe all individual cases of major mergers and mass capture in our simulated population of disc GCs. To identify mergers and interactions in the system, we number our GCs from 1 to 128. We also note that the same GC can be the host of an accretion event and concurrently part of its mass can contribute to the external population of another host GC. Therefore, a given GC can receive mass from another cluster, and at the same time, contribute with a fraction of its mass to a companion GC.
We also note a unique case of evolution of globular cluster #38 in the outer disc. This cluster is located in the top right of Fig. 3 with the escaped mass fraction of unity. The cluster is fully disrupted at the galactic outskirts, and its remnant is recognised as a nearly circular stream at R ≈ 12 kpc at later times (see Fig. 2). During the evolution of the system, this cluster interacted twice with different GCs. At t = 140 Myr it was perturbed by GC#24, and then GC#38 started to expand and lose mass. Later at t ≈ 0.5 Gyr, GC#38 flew through the potential well of the tail of another GC (#50) which sped up the evaporation of stars and triggered the formation of the extended tidal tail.
4.2. Major mergers and mass accretions
At the end of the simulation, several GCs in the system have experienced major mergers or mass accretion from other clusters, leading to GC remnants with composite populations. In particular, we find evidence for2 an early major merger leading to a GC remnant with equal fractional contributions from two parent clusters (GCs #68 and #90); a major merger with a minor accretion from a third cluster (GCs #70(H), #91 and #100); a host with two accreted populations (GCs #111(H), #28 and #91); and six clusters with accreted populations (GCs #001(H) and #010, GCs #010(H) and #001, GCs #024(H) and #123, GCs #028(H) and #111, GCs #080(H) and #121, GCs #100(H) and #91, and GCs #123(H) and #024).
In Fig. 4 we show the final volume density of all simulated GCs, which have experienced one or several mergers and/or accretions. For each of these GCs, we also show the kinetic-to-potential energy ratio distribution for gravitationally bound populations within the tidal radius3: in situ and accreted population(s). In the case of major mergers, one can see that the final density profile and the final energy distribution are equal for both populations, which are therefore fully mixed after 1−1.5 Gyr of evolution. In the case of mass accretion from another GC, the accreted stars do not penetrate the innermost regions of the host cluster because their kinetic energy is too large. Therefore, for the accreted populations, distance from the GC centre increases with their decreasing mass. For the long-term evolution of these accreted populations in the host GC we refer to Mastrobuono-Battisti et al. (2018). In the following, we describe in more detail the mergers and mass exchanges taking place in our simulated GC system.
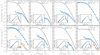 |
Fig. 4. Radial density profile in units of M⊙pc−3 for each GC (host) with gravitationally bound (see Eq. (3)) external stars inside of the tidal radius. In each subframe the distribution of the log(Ekin/Epot) is shown. Solid black lines show the host cluster characteristics; external populations are shown by blue and red (in case of two external populations) symbols. |
4.2.1. A major merger (GCs 68-90)
One of the two major mergers involves a pair of clusters (GCs #68-#90) with an initial separation of about ≈ 150 pc. These GCs are located in the inner disc, at a distance from the galactic centre of smaller than 2 kpc, and have small relative velocities in comparison to orbital motion.
Figure 5 (top-left panel) shows the evolution with time of the spatial separation between the two GCs which merge after about 50 Myr from the beginning of the simulation. The final face-on and edge-on distributions of stars initially belonging to the two GCs are shown in the right panel of Fig. 5. The merger remnant corresponding to the density peak in the plot is surrounded by an extended distribution, or “halo” of unbound stars lost in the field. During the merger, both clusters lose around 20−25% of their initial stellar mass due to their mutual tidal effects, while the influence of the galactic tidal field causes further mass loss and, at the end of the simulation, the GC remnant has lost about half of its initial mass (see Fig. 5, bottom-left panel). Nevertheless, the radial density profile of the GC merger remnant is that of a typical globular cluster (see Fig. 4, for GC #68 as a host). This new cluster will however consist of two fully mixed populations.
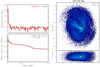 |
Fig. 5. Left: evolution of the separation between GCs 68 and 90 (top), and evolution of all gravitationally bound mass (Ekin/Epot < 1) within 50 pc of the centre of the host GC (GC 68). Right: As for the global evolution plot (Fig. 2), but only two GCs, 68 and 90, are shown. A high-resolution animation is available online. |
4.2.2. The case of a mass accretion followed by a major merger (GCs 70-91-100)
Another interesting case we obtain in our simulation is the interaction between multiple GCs, resulting in a remnant GC consisting of three gravitationally bound populations. In the top panel of Fig. 6 we show the evolution of the separation between the three pairs of clusters. The contribution of each progenitor to the mass fraction of the two GCs involved in the major merger (GCs #70-#91) is illustrated in the bottom panel of Fig. 6 as a function of time. The three clusters initially move on similar orbits – in terms of spatial extension and eccentricity – and cross their paths several times during the simulated time interval. At t ≈ 0.5 Gyr, during a close passage, the GC #91 captures 15% of the mass from the GC #100. Subsequently, at a later time (≈ 0.8 Gyr) this same cluster (#91) fully merges with another (#70). During this merger, a significant fraction of the external population accreted at t = 0.5 Gyr from GC #100 is lost in the field, and the resulting system contains ∼ 70% of the mass of GC #70, ∼ 60% of that of GC #91 and only a small percentage, ≈1−2%, of that of GC #100. Repeated interactions like this one are possible because of the similar orbital motions of the clusters that imply small relative velocities. The final density profiles of the two clusters involved in the major merger (GCs #70 and #91) are similar, while the minor population (GC#100) shows a power-law distribution and is found only outside the core of the GC remnant, at r > 1 pc (see Fig. 6).
4.2.3. An example of multiple tidal mass capture (GCs 111-28-91)
In addition to the two major mergers described above, at the end of the simulation we find several cases where GCs have accreted a small percentage of their mass from other clusters in the system during their orbital evolution in the galaxy. All cases are discussed in Appendix A, while here we only describe the case of the interaction between GCs #111, #28, and #91. In Fig. 7 we show the evolution with time of the relative separation of these clusters with respect to the host, GC#111. This cluster initially accretes 1−2% of its mass from GC #91 after about t = 0.6 Gyr from the beginning of the simulation. Then, at the final stages of the simulation, during a close passage, another 1−2% of its mass is accreted from GC #28. Therefore, even if at the end of the simulation the remnant cluster is for the vast majority made of stars originating from GCs#111, in its outer regions (see Fig. 4) we find a contamination, at the level of a few percent, from clusters which have passed close to it. Relative separations of the order of a few hundred parsec between these GCs are sufficient to generate these mass exchanges. We note that the mass exchange is also mutual, because when the GC #111 accretes mass from GC #28, it also provides this latter GC with a few percent of its original mass.
5. Discussion and Conclusions
In this work we have studied the dynamical evolution of a system of disc globular clusters in a Milky Way-like, axisymmetric potential, by means of an N-body simulation run for 1.5 Gyr. The main results of our work and the predictions of our model can be summarised as follows.
By means of analytic calculations of physical collision rates, we show that between one and two collisions are expected per gigayear for a system of globular clusters redistributed in a galactic disc with scale length and height similar to those of the current MW thick disc. Therefore collisions and mergers of GCs could have also taken place in situ, that is, in our Galaxy, and do not necessarily only take place in dwarf galaxies with subsequent accretion into the Milky Way.
In N-body simulations we have shown that for a disc population of GCs with scale length and height compatible to those of the Galactic thick disc, mergers among GCs can take place at a rate of ∼ 1 Gyr. For a similar merger rate, the GC population must be numerous (∼ 100 GCs) and the clusters need to be massive (the initial mass adopted for all clusters in our simulation being equal to 107 M⊙).
While orbiting in the disc, the mutual gravitational interaction can lead to mass exchanges and captures among simulated GCs. We indeed find several cases where a GC accretes a few per cent of its final mass from one or several companions.
In the case of a major merger between two GCs, the final density profiles are equal for both GC populations, indicating that they can be fully mixed ∼1 Gyr after the merger.
In the case of mass capture during GC fly-bys, the accreted mass tends to redistribute in the outer regions of the host GC, because the kinetic energy of the accreted stars is usually too high to allow them to penetrate the innermost GC regions.
We note that these findings extend the earlier works by Capuzzo-Dolcetta and collaborators (Miocchi et al. 2006; Capuzzo-Dolcetta & Miocchi 2008a,b; Mastrobuono-Battisti et al. 2012; Antonini et al. 2012; Capuzzo-Dolcetta 2013; Arca-Sedda & Capuzzo-Dolcetta 2014), who showed that mergers of GCs can occur in the nuclear regions of galaxies, that is, a few tens of parsecs from the galactic centre, leading to the formation of nuclear star clusters. Here we show that, in a population of disc globular clusters, mergers can occur also at distances of a few kiloparecs from the galactic center, and that the remnant of these mergers – or mass exchanges during fly-bys – are still stellar systems that can be classified as GCs on the basis of their morphology and kinematics, as we will show in a follow-up paper (Mastrobuono-Battisti et al. 2018). Before concluding we would like to briefly comment on the pertinence of the assumptions made for our N-body model. Because the conditions at early epochs of the GC system and of the Galaxy are still largely unknown, it is hard to say how realistic our assumptions can be. The adoption here of a time-independent potential like that of Pouliasis et al. (2017), which was developed as an axisymmetric mass model of the current Milky Way, is a first description of the Galaxy, and does not take into account that its properties at high redshift may have been significantly different from the current ones (both in terms of mass of the different disc components and dark matter, and of its equilibrium state). The current population of disc/bulge GCs in the Galaxy, defined as the GCs with [Fe/H] > −1 dex, consists of approximately 50 members (Harris 1996, 2010 edition), however their census may still be largely incomplete, as shown for example by the recent discovery of a dozen new metal-rich GCs toward the bulge (Minniti et al. 2017). Moreover, part of this initial population of disc GCs may have been destroyed over time by tidal effects and/or kinematically heated during the accretion of satellites and now be part of the Galactic halo GC population (Kruijssen 2015). Therefore, assuming a disc population which contains more than the current number of Galactic disc GCs (by a factor of 2−3) may still be reasonable for the GC system at high redshift, but this value is currently still difficult to probe. Finally, since the N-body model presented in this work is dissipationless, units can easily be re-scaled and GC masses can be reduced, for example by a factor of two, thus allowing to employ initial GC masses possibly less extreme than the values adopted in this work. Of course this rescaling must be adopted also for the Galactic potential. A stellar mass of the Galactic disc which is half of its current value would be compatible with that estimated for MW disc at redshift z ∼ 1 (Snaith et al. 2014).
To conclude, this work suggests a possible in situ process for explaining the existence of GCs like Terzan 5, which contains a significant metallicity spread and several peaks in its metallicity distribution function. Assuming that the progenitors of Terzan 5-like GCs have a different chemical composition and even different ages, the resulting GC remnant will exhibit several peaks or a spread in chemical abundances. The metal-poor peaks could at the very least be the signature of mergers and mass capture of former disc/bulge GCs that have taken place over time in the innermost region of the Galaxy. Furthermore, this work predicts a small percentage – typically a few percent – of the stars of some GCs in the Galaxy to have metallicities that are different from those of the vast majority of the GC stars, and that this contamination could be the result of mass capture from companion clusters. Looking for the existence and recurrence of these contaminants in the population of Galactic GCs may help to provide some constraints on the number of close encounters experienced by GCs over time, and thus indirectly, on their initial number and/or masses.
Movies
Movie of Fig. 2 Access here
Movie of Fig. 5 Access here
Movie of Fig. 6 Access here
Movie of Fig. 7 Access here
Movie of Fig. A.1 Access here
Movie of Fig. A.2 Access here
This may still be a lower limit to the number of disc/bulge GCs in theMW. Recently, indeed, 22 new GC candidates have been discovered in the inner MW (Minniti et al. 2017), with approximately half of them having [Fe/H] > −1 dex.
Acknowledgments
The authors thank Florent Renaud for a careful reading of the manuscript and an anonymous referee for useful comments. This work was granted access to the HPC resources of CINES under the allocation 2017-040507 (Pi : P. Di Matteo) made by GENCI. This work has been supported by ANR (Agence Nationale de la Recherche) through the MOD4Gaia project (ANR-15-CE31-0007, P.I.: P. Di Matteo). Numerical simulations are partially carried out using the equipment of the shared research facilities of HPC computing resources at Lomonosov Moscow State University supported by the project RFMEFI62117X0011 and the RFBR grant (16-32-60043). AMB acknowledges support by Sonderforschungsbereich (SFB) 881 “The Milky Way System” of the German Research Foundation (DFG). PDM thanks the Max Planck Institute für Astronomie for their hospitality during several visits while this paper was in progress.
References
- Antonini, F., Capuzzo-Dolcetta, R., Mastrobuono-Battisti, A., & Merritt, D. 2012, ApJ, 750, 111 [NASA ADS] [CrossRef] [Google Scholar]
- Arca-Sedda, M., & Capuzzo-Dolcetta, R. 2014, MNRAS, 444, 3738 [NASA ADS] [CrossRef] [Google Scholar]
- Armandroff, T. E. 1989, AJ, 97, 375 [NASA ADS] [CrossRef] [Google Scholar]
- Armandroff, T. E., & Zinn, R. 1988, AJ, 96, 92 [NASA ADS] [CrossRef] [Google Scholar]
- Barbuy, B., Bica, E., & Ortolani, S. 1998, A&A, 333, 117 [NASA ADS] [Google Scholar]
- Bastian, N., & Lardo, C. 2018, ARA&A, 56, 83 [NASA ADS] [CrossRef] [Google Scholar]
- Bekki, K., & Freeman, K. C. 2003, MNRAS, 346, L11 [NASA ADS] [CrossRef] [Google Scholar]
- Bellazzini, M., Ferraro, F. R., & Ibata, R. 2003, AJ, 125, 188 [NASA ADS] [CrossRef] [Google Scholar]
- Berentzen, I., & Athanassoula, E. 2012, MNRAS, 419, 3244 [NASA ADS] [CrossRef] [Google Scholar]
- Bica, E., Bonatto, C., Barbuy, B., & Ortolani, S. 2006, A&A, 450, 105 [NASA ADS] [CrossRef] [EDP Sciences] [Google Scholar]
- Bica, E., Ortolani, S., & Barbuy, B. 2016, PASA, 33, e028 [NASA ADS] [CrossRef] [Google Scholar]
- Binney, J., & Tremaine, S. 1987, Galactic dynamics (Princeton, NJ: Princeton University Press), 747 [Google Scholar]
- Bovy, J., Rix, H.-W., Liu, C., et al. 2012, ApJ, 753, 148 [NASA ADS] [CrossRef] [Google Scholar]
- Bovy, J., Rix, H.-W., Schlafly, E. F., et al. 2016, ApJ, 823, 30 [NASA ADS] [CrossRef] [Google Scholar]
- Caldwell, N., & Romanowsky, A. J. 2016, ApJ, 824, 42 [NASA ADS] [CrossRef] [Google Scholar]
- Capuzzo-Dolcetta, R. 2013, Mem. Soc. Astron. It., 84, 167 [NASA ADS] [Google Scholar]
- Capuzzo-Dolcetta, R., & Miocchi, P. 2008a, ApJ, 681, 1136 [NASA ADS] [CrossRef] [Google Scholar]
- Capuzzo-Dolcetta, R., & Miocchi, P. 2008b, MNRAS, 388, L69 [NASA ADS] [CrossRef] [MathSciNet] [Google Scholar]
- Carretta, E., Bragaglia, A., Gratton, R. G., et al. 2010, A&A, 516, A55 [NASA ADS] [CrossRef] [EDP Sciences] [Google Scholar]
- Casetti-Dinescu, D. I., Girard, T. M., Herrera, D., et al. 2007, AJ, 134, 195 [NASA ADS] [CrossRef] [Google Scholar]
- Casetti-Dinescu, D. I., Girard, T. M., Korchagin, V. I., van Altena, W. F., & López, C. E. 2010, AJ, 140, 1282 [NASA ADS] [CrossRef] [Google Scholar]
- Casetti-Dinescu, D. I., Girard, T. M., Jílková, L., et al. 2013, AJ, 146, 33 [NASA ADS] [CrossRef] [Google Scholar]
- Chemel, A. A., Glushkova, E. V., Dambis, A. K., Rastorguev, A. S., & Yalyalieva, L. N. 2018, Astrophys. Bull., 73, 162 [CrossRef] [Google Scholar]
- Côté, P. 1999, AJ, 118, 406 [NASA ADS] [CrossRef] [Google Scholar]
- Dinescu, D. I., Girard, T. M., van Altena, W. F., Mendez, R. A., & Lopez, C. E. 1997, AJ, 114, 1014 [NASA ADS] [CrossRef] [Google Scholar]
- Dinescu, D. I., Girard, T. M., & van Altena, W. F. 1999a, AJ, 117, 1792 [NASA ADS] [CrossRef] [Google Scholar]
- Dinescu, D. I., van Altena, W. F., Girard, T. M., & López, C. E. 1999b, AJ, 117, 277 [NASA ADS] [CrossRef] [Google Scholar]
- Dinescu, D. I., Girard, T. M., van Altena, W. F., & López, C. E. 2003, AJ, 125, 1373 [NASA ADS] [CrossRef] [Google Scholar]
- Dobbs, C. L., Adamo, A., Few, C. G., et al. 2017, MNRAS, 464, 3580 [NASA ADS] [CrossRef] [Google Scholar]
- Fernández-Trincado, J. G., Zamora, O., García-Hernández, D. A., et al. 2017, ApJ, 846, L2 [NASA ADS] [CrossRef] [Google Scholar]
- Ferraro, F. R., Massari, D., Dalessandro, E., et al. 2016, ApJ, 828, 75 [NASA ADS] [CrossRef] [Google Scholar]
- Forbes, D. A., & Bridges, T. 2010, MNRAS, 404, 1203 [NASA ADS] [Google Scholar]
- Forbes, D. A., Bastian, N., Gieles, M., et al. 2018, Proc. R. Soc. London Ser. A, 474, 20170616 [Google Scholar]
- Fujii, M. S., & Baba, J. 2012, MNRAS, 427, L16 [NASA ADS] [Google Scholar]
- Gavagnin, E., Mapelli, M., & Lake, G. 2016, MNRAS, 461, 1276 [NASA ADS] [CrossRef] [Google Scholar]
- Gratton, R. G., Carretta, E., & Bragaglia, A. 2012, A&ARv, 20, 50 [CrossRef] [Google Scholar]
- Harris, W. E. 1996, AJ, 112, 1487 [NASA ADS] [CrossRef] [Google Scholar]
- Jean-Baptiste, I., Di Matteo, P., Haywood, M., et al. 2017, A&A, 604, A106 [NASA ADS] [CrossRef] [EDP Sciences] [Google Scholar]
- Johnson, C. I., & Pilachowski, C. A. 2010, ApJ, 722, 1373 [NASA ADS] [CrossRef] [Google Scholar]
- Just, A., Berczik, P., Petrov, M. I., & Ernst, A. 2009, MNRAS, 392, 969 [NASA ADS] [CrossRef] [Google Scholar]
- Khoperskov, S. A., Vasiliev, E. O., Khoperskov, A. V., & Lubimov, V. N. 2014, J. Phys: Conf. Ser., 510, 012011 [Google Scholar]
- Kruijssen, J. M. D. 2015, MNRAS, 454, 1658 [NASA ADS] [CrossRef] [Google Scholar]
- Lamers, H. J. G. L. M., Kruijssen, J. M. D., Bastian, N., et al. 2017, A&A, 606, A85 [NASA ADS] [CrossRef] [EDP Sciences] [Google Scholar]
- Leaman, R., VandenBerg, D. A., & Mendel, J. T. 2013, MNRAS, 436, 122 [NASA ADS] [CrossRef] [Google Scholar]
- Lee, Y.-W., Hong, S., Lim, D., et al. 2018, ApJ, 862, L8 [CrossRef] [Google Scholar]
- Mackey, A. D., Huxor, A. P., Ferguson, A. M. N., et al. 2010, ApJ, 717, L11 [NASA ADS] [CrossRef] [Google Scholar]
- Marín-Franch, A., Aparicio, A., Piotto, G., et al. 2009, ApJ, 694, 1498 [NASA ADS] [CrossRef] [Google Scholar]
- Massari, D., Mucciarelli, A., Ferraro, F. R., et al. 2014, ApJ, 795, 22 [NASA ADS] [CrossRef] [Google Scholar]
- Mastrobuono-Battisti, A., & Capuzzo-Dolcetta, R. 2012, in Advances in Computational Astrophysics: Methods, Tools, and Outcome, eds. R. Capuzzo-Dolcetta, M. Limongi, & A. Tornambè, ASP Conf. Ser., 453, 237 [NASA ADS] [Google Scholar]
- Mastrobuono-Battisti, A., Khoperskov, S., Di Matteo, P., & Haywood, M. 2018, A&A, in press DOI: 10.1051/0004-6361/201834087 [Google Scholar]
- Minniti, D. 1995, AJ, 109, 1663 [NASA ADS] [CrossRef] [Google Scholar]
- Minniti, D., Geisler, D., Alonso-García, J., et al. 2017, ApJ, 849, L24 [NASA ADS] [CrossRef] [Google Scholar]
- Miocchi, P., Capuzzo Dolcetta, R., Di Matteo, P., & Vicari, A. 2006, ApJ, 644, 940 [NASA ADS] [CrossRef] [Google Scholar]
- Miyamoto, M., & Nagai, R. 1975, PASJ, 27, 533 [NASA ADS] [Google Scholar]
- Moetazedian, R., & Just, A. 2016, MNRAS, 459, 2905 [NASA ADS] [CrossRef] [Google Scholar]
- Montuori, M., Capuzzo-Dolcetta, R., Di Matteo, P., Lepinette, A., & Miocchi, P. 2007, ApJ, 659, 1212 [NASA ADS] [CrossRef] [Google Scholar]
- Morrison, H. L., Harding, P., Perrett, K., & Hurley-Keller, D. 2004, ApJ, 603, 87 [NASA ADS] [CrossRef] [Google Scholar]
- Origlia, L., Rich, R. M., Ferraro, F. R., et al. 2011, ApJ, 726, L20 [NASA ADS] [CrossRef] [Google Scholar]
- Ortolani, S. 1999, Ap&SS, 265, 355 [NASA ADS] [CrossRef] [Google Scholar]
- Pouliasis, E., Di Matteo, P., & Haywood, M. 2017, A&A, 598, A66 [NASA ADS] [CrossRef] [EDP Sciences] [Google Scholar]
- Qu, Y., Di Matteo, P., Lehnert, M. D., & van Driel, W. 2011, A&A, 530, A10 [NASA ADS] [CrossRef] [EDP Sciences] [Google Scholar]
- Renaud, F. 2018, New Astron. Rev., 81, 1 [NASA ADS] [CrossRef] [Google Scholar]
- Renaud, F., Agertz, O., & Gieles, M. 2017, MNRAS, 465, 3622 [NASA ADS] [CrossRef] [Google Scholar]
- Rodionov, S. A., Athanassoula, E., & Sotnikova, N. Y. 2009, MNRAS, 392, 904 [NASA ADS] [CrossRef] [Google Scholar]
- Rossi, L. J., & Hurley, J. R. 2015a, MNRAS, 454, 1453 [NASA ADS] [CrossRef] [Google Scholar]
- Rossi, L. J., & Hurley, J. R. 2015b, MNRAS, 446, 3389 [NASA ADS] [CrossRef] [Google Scholar]
- Rossi, L. J., Bekki, K., & Hurley, J. R. 2016, MNRAS, 462, 2861 [NASA ADS] [CrossRef] [Google Scholar]
- Rossi, L. J., Hurley, J. R., & Bekki, K. 2017, MNRAS, 468, 4441 [NASA ADS] [CrossRef] [Google Scholar]
- Schiavon, R. P., Johnson, J. A., Frinchaboy, P. M., et al. 2017a, MNRAS, 466, 1010 [NASA ADS] [CrossRef] [Google Scholar]
- Schiavon, R. P., Zamora, O., Carrera, R., et al. 2017b, MNRAS, 465, 501 [NASA ADS] [CrossRef] [Google Scholar]
- Snaith, O. N., Haywood, M., Di Matteo, P., et al. 2014, ApJ, 781, L31 [CrossRef] [Google Scholar]
- Teuben, P., 1995, in Astronomical Data Analysis Software and Systems IV, eds. R. A. Shaw, H. E. Payne, & J. J. E. Hayes, ASP Conf. Ser., 77, 398 [NASA ADS] [Google Scholar]
- Tonini, C. 2013, ApJ, 762, 39 [NASA ADS] [CrossRef] [Google Scholar]
- van den Bergh, S. 1996, ApJ, 471, L31 [NASA ADS] [CrossRef] [Google Scholar]
- Van Den Bergh, S. 2003, ApJ, 590, 797 [NASA ADS] [CrossRef] [Google Scholar]
- Van den Berg, D. A., Brogaard, K., Leaman, R., & Casagrande, L. 2013, ApJ, 775, 134 [NASA ADS] [CrossRef] [Google Scholar]
- Zinn, R. 1985, ApJ, 293, 424 [Google Scholar]
- Zinn, R. 1990, JRASC, 84, 89 [NASA ADS] [Google Scholar]
- Zinn, R. 1991, in The Formation and Evolution of Star Clusters, eds. K. Janes, ASP Conf. Ser., 13, 532 [NASA ADS] [Google Scholar]
Appendix A: GC interactions: minor mass capture
The evolution of some of the GC pairs participating in a single minor mass capture at different times is shown in Figs. A.1 and A.2.
All Figures
|
Fig. 1. Cumulative collision rate as a function of the number of GCs, in the case of a homogeneous spherical distribution (left panel), and of a disc distribution (middle and right panels). The colour code refers to the size of the spherical halo (left panel), the radial scale length of the disc (middle panel) for a fixed scale height of 0.8 kpc, and the vertical scale height (right panel) for a fixed scale length of 2 kpc. In each plot, the inset shows a zoom for a number of clusters between 40 and 150. In the inset in the middle and right panels, the asterisk indicates the collision rate corresponding to a disc of scale length of 2 kpc and scale height of 0.8 kpc. |
| In the text | |
|
Fig. 2. Stellar density distribution (in logarithmic scale) of the entire globular cluster system in our simulation. Projections on the xy and xz planes are shown. In the right panels, a zoom in the inner disc regions is shown. Bound globular cluster stars are clearly seen as red over-densities, while light/dark blue regions correspond to stars escaped from the clusters and lost in the field. The high-resolution animation of the evolution of the simulated GC system is available online. |
| In the text | |
|
Fig. 3. Top panel: distribution of the escaped mass fraction from the simulated GCs, after 1.5 Gyr of evolution. Bottom panel: escaped mass fraction as a function of the orbital guiding radius. Colour code depicts the GCs orbital eccentricity. |
| In the text | |
|
Fig. 4. Radial density profile in units of M⊙pc−3 for each GC (host) with gravitationally bound (see Eq. (3)) external stars inside of the tidal radius. In each subframe the distribution of the log(Ekin/Epot) is shown. Solid black lines show the host cluster characteristics; external populations are shown by blue and red (in case of two external populations) symbols. |
| In the text | |
|
Fig. 5. Left: evolution of the separation between GCs 68 and 90 (top), and evolution of all gravitationally bound mass (Ekin/Epot < 1) within 50 pc of the centre of the host GC (GC 68). Right: As for the global evolution plot (Fig. 2), but only two GCs, 68 and 90, are shown. A high-resolution animation is available online. |
| In the text | |
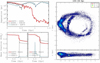 |
Fig. 6. As in Fig. 5, but for GCs 70, 91, and 100. |
| In the text | |
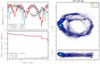 |
Fig. 7. As in Fig. 5, but for GCs 111, 28 and 91. |
| In the text | |
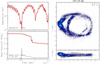 |
Fig. A.1. As in Fig. 5, but for GCs 100 and 91. |
| In the text | |
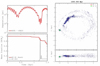 |
Fig. A.2. As in Fig. 5, but for GCs 1 and 10. |
| In the text | |
Current usage metrics show cumulative count of Article Views (full-text article views including HTML views, PDF and ePub downloads, according to the available data) and Abstracts Views on Vision4Press platform.
Data correspond to usage on the plateform after 2015. The current usage metrics is available 48-96 hours after online publication and is updated daily on week days.
Initial download of the metrics may take a while.