Free Access
Fig. 3.
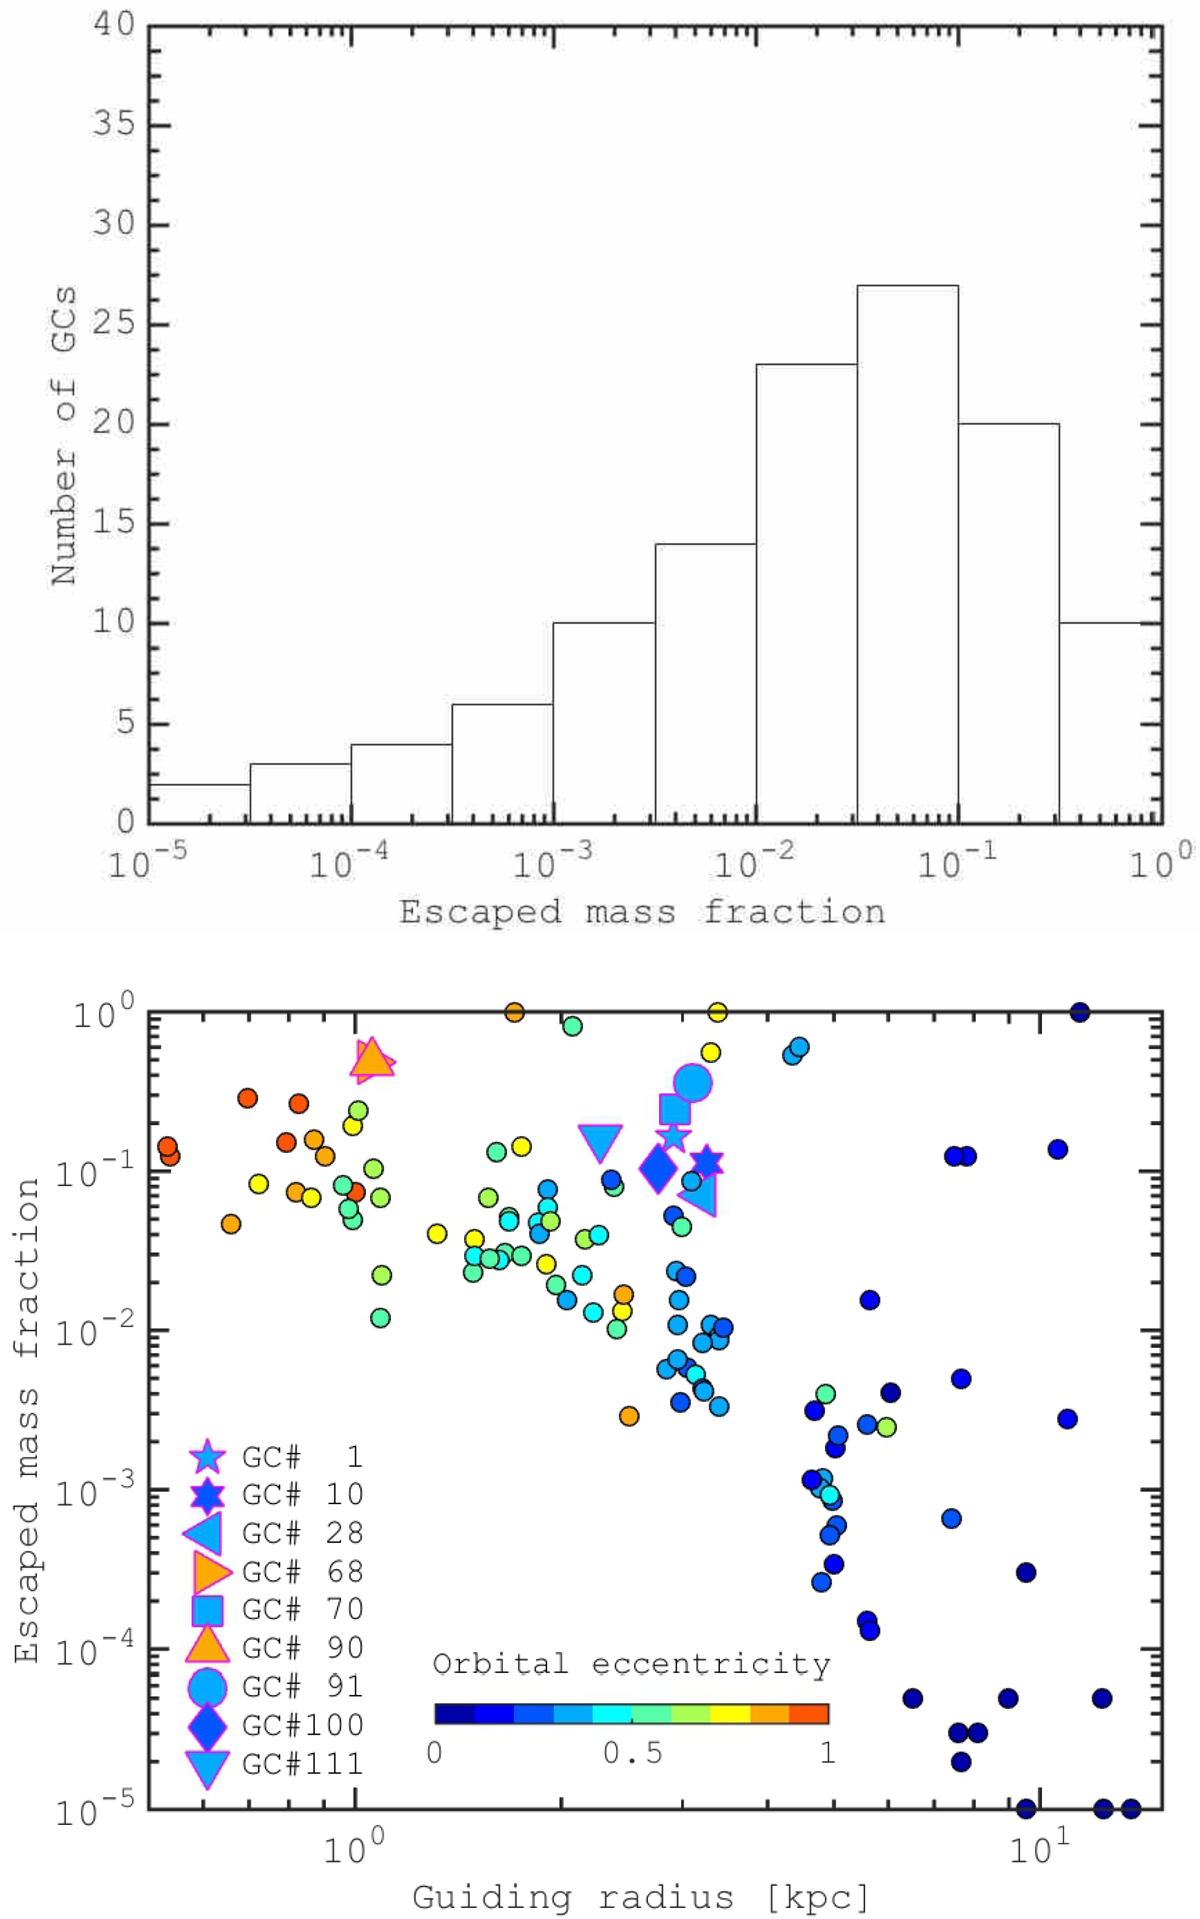
Top panel: distribution of the escaped mass fraction from the simulated GCs, after 1.5 Gyr of evolution. Bottom panel: escaped mass fraction as a function of the orbital guiding radius. Colour code depicts the GCs orbital eccentricity.
Current usage metrics show cumulative count of Article Views (full-text article views including HTML views, PDF and ePub downloads, according to the available data) and Abstracts Views on Vision4Press platform.
Data correspond to usage on the plateform after 2015. The current usage metrics is available 48-96 hours after online publication and is updated daily on week days.
Initial download of the metrics may take a while.