Free Access
Fig. 5.
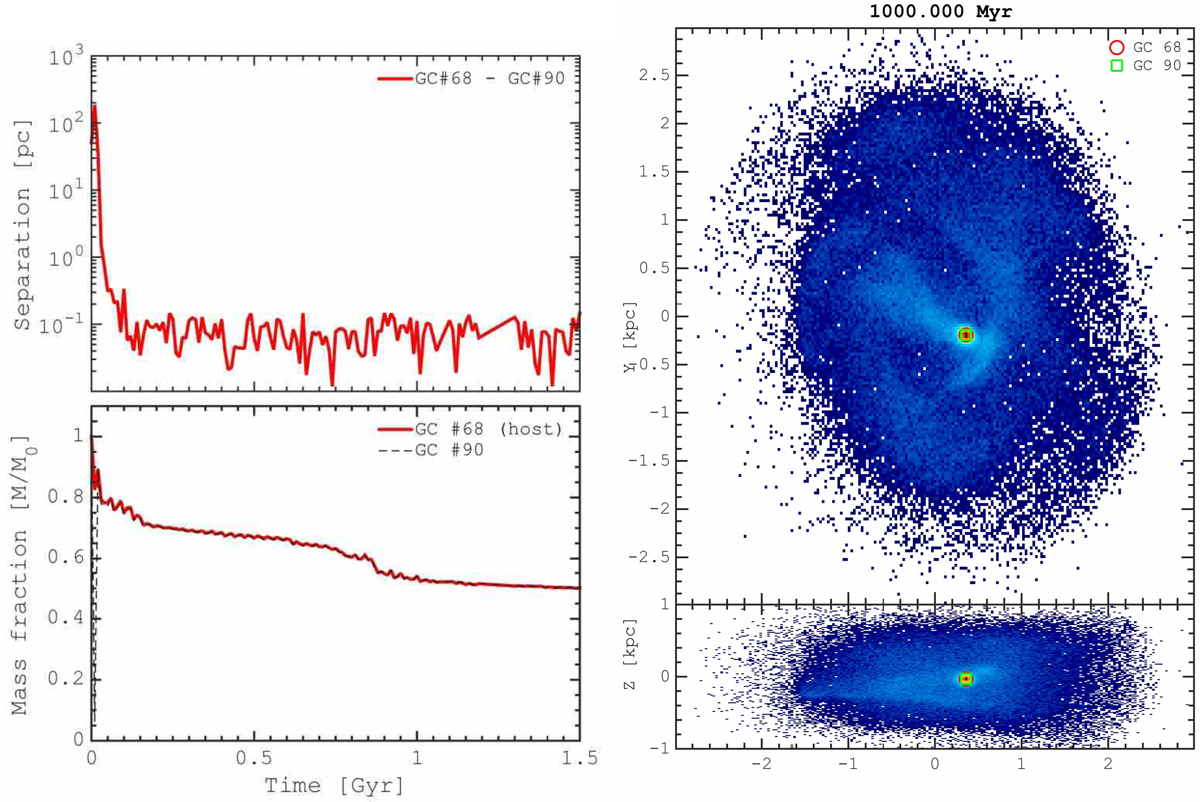
Left: evolution of the separation between GCs 68 and 90 (top), and evolution of all gravitationally bound mass (Ekin/Epot < 1) within 50 pc of the centre of the host GC (GC 68). Right: As for the global evolution plot (Fig. 2), but only two GCs, 68 and 90, are shown. A high-resolution animation is available online.
Current usage metrics show cumulative count of Article Views (full-text article views including HTML views, PDF and ePub downloads, according to the available data) and Abstracts Views on Vision4Press platform.
Data correspond to usage on the plateform after 2015. The current usage metrics is available 48-96 hours after online publication and is updated daily on week days.
Initial download of the metrics may take a while.