Fig. 1.
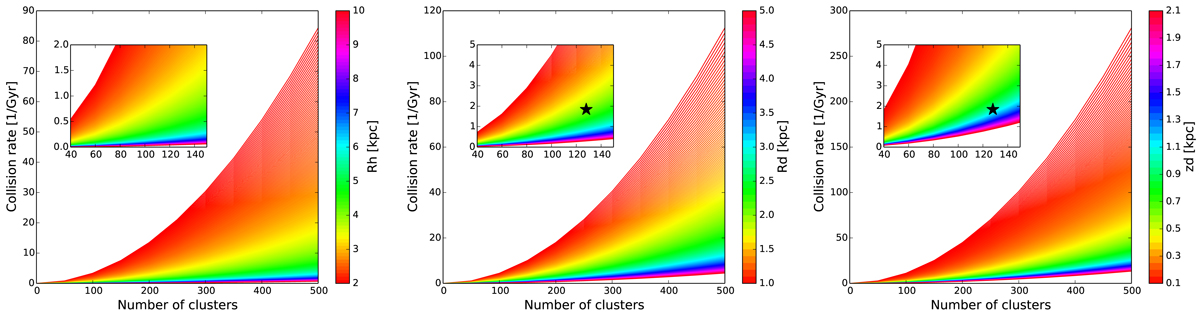
Cumulative collision rate as a function of the number of GCs, in the case of a homogeneous spherical distribution (left panel), and of a disc distribution (middle and right panels). The colour code refers to the size of the spherical halo (left panel), the radial scale length of the disc (middle panel) for a fixed scale height of 0.8 kpc, and the vertical scale height (right panel) for a fixed scale length of 2 kpc. In each plot, the inset shows a zoom for a number of clusters between 40 and 150. In the inset in the middle and right panels, the asterisk indicates the collision rate corresponding to a disc of scale length of 2 kpc and scale height of 0.8 kpc.
Current usage metrics show cumulative count of Article Views (full-text article views including HTML views, PDF and ePub downloads, according to the available data) and Abstracts Views on Vision4Press platform.
Data correspond to usage on the plateform after 2015. The current usage metrics is available 48-96 hours after online publication and is updated daily on week days.
Initial download of the metrics may take a while.