Fig. 2.
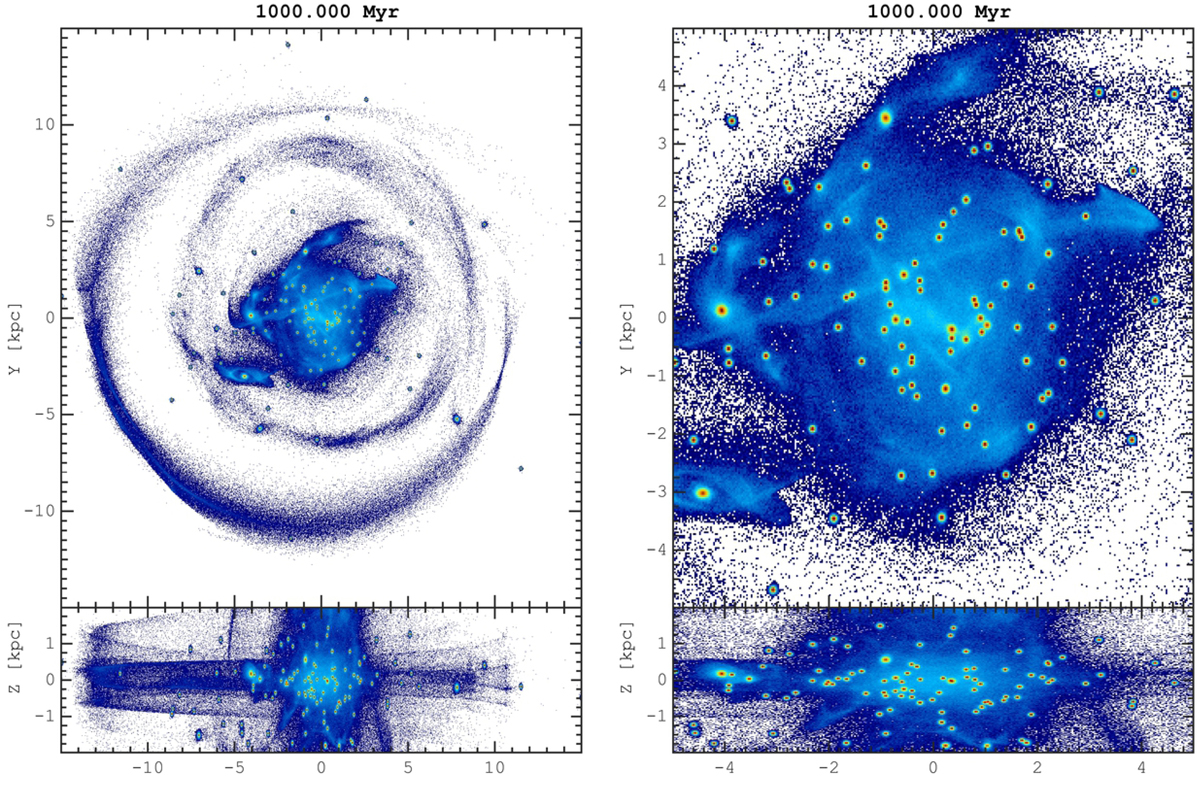
Stellar density distribution (in logarithmic scale) of the entire globular cluster system in our simulation. Projections on the xy and xz planes are shown. In the right panels, a zoom in the inner disc regions is shown. Bound globular cluster stars are clearly seen as red over-densities, while light/dark blue regions correspond to stars escaped from the clusters and lost in the field. The high-resolution animation of the evolution of the simulated GC system is available online.
Current usage metrics show cumulative count of Article Views (full-text article views including HTML views, PDF and ePub downloads, according to the available data) and Abstracts Views on Vision4Press platform.
Data correspond to usage on the plateform after 2015. The current usage metrics is available 48-96 hours after online publication and is updated daily on week days.
Initial download of the metrics may take a while.