Fig. A.2
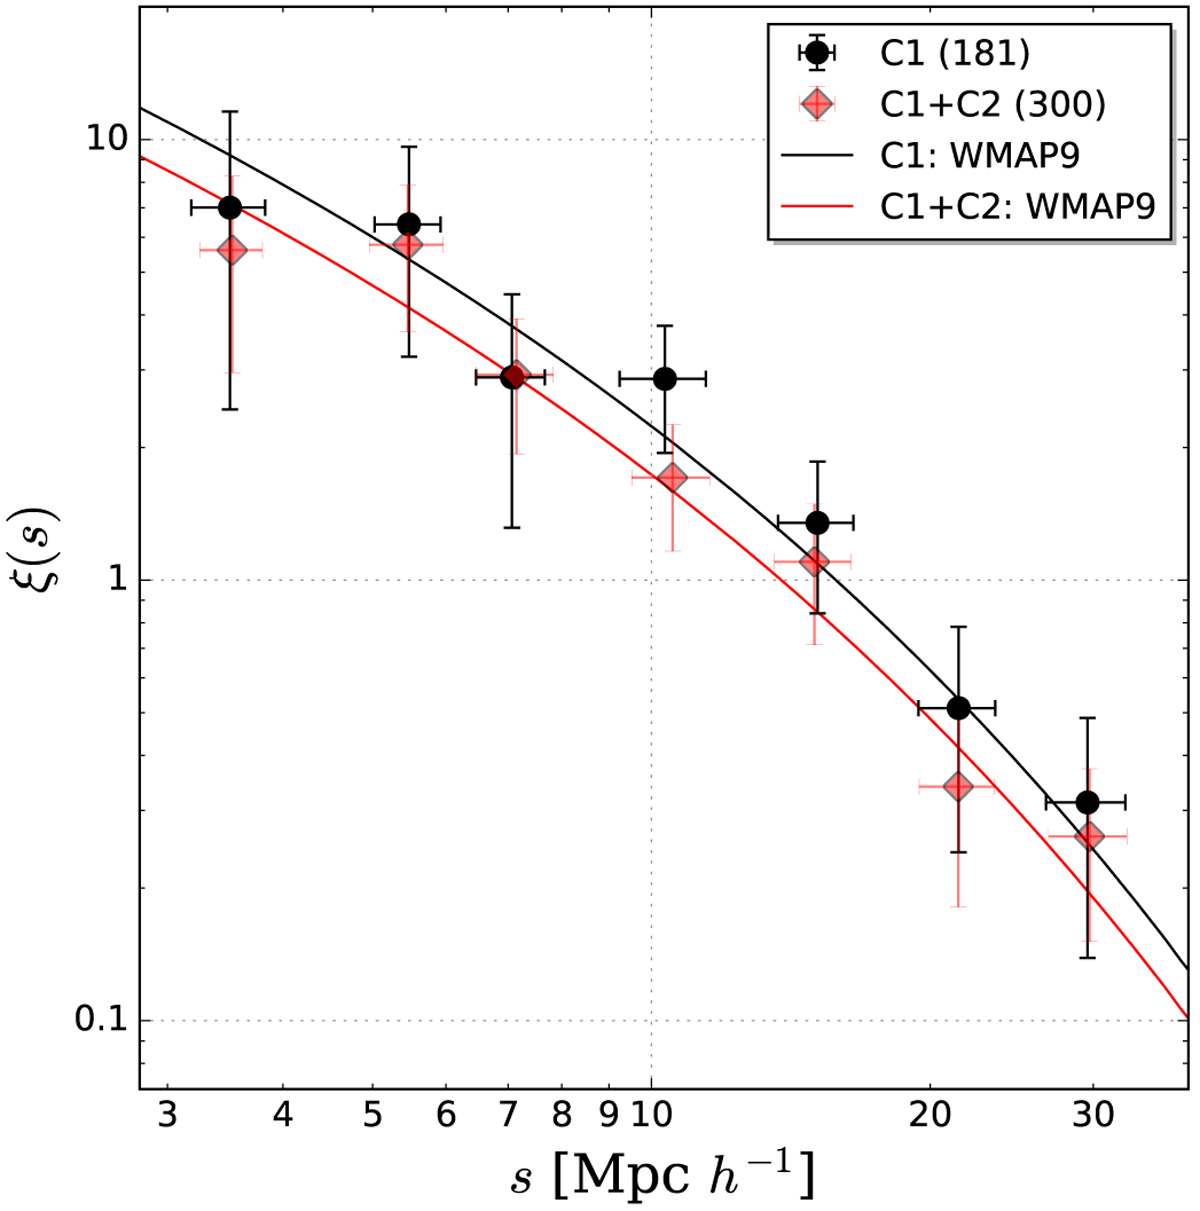
Comparison between the redshift-space 2PCF of XXL C1 (black dots) and C1+C2 clusters (red diamonds). The black and red lines show the theoretical WMAP9 predictions, computed as described in Sect. 4 for C1 and C1+C2, respectively. The number of C1 and C1+C2 XXL clusters in each field is reported in parentheses.
Current usage metrics show cumulative count of Article Views (full-text article views including HTML views, PDF and ePub downloads, according to the available data) and Abstracts Views on Vision4Press platform.
Data correspond to usage on the plateform after 2015. The current usage metrics is available 48-96 hours after online publication and is updated daily on week days.
Initial download of the metrics may take a while.