Fig. 3
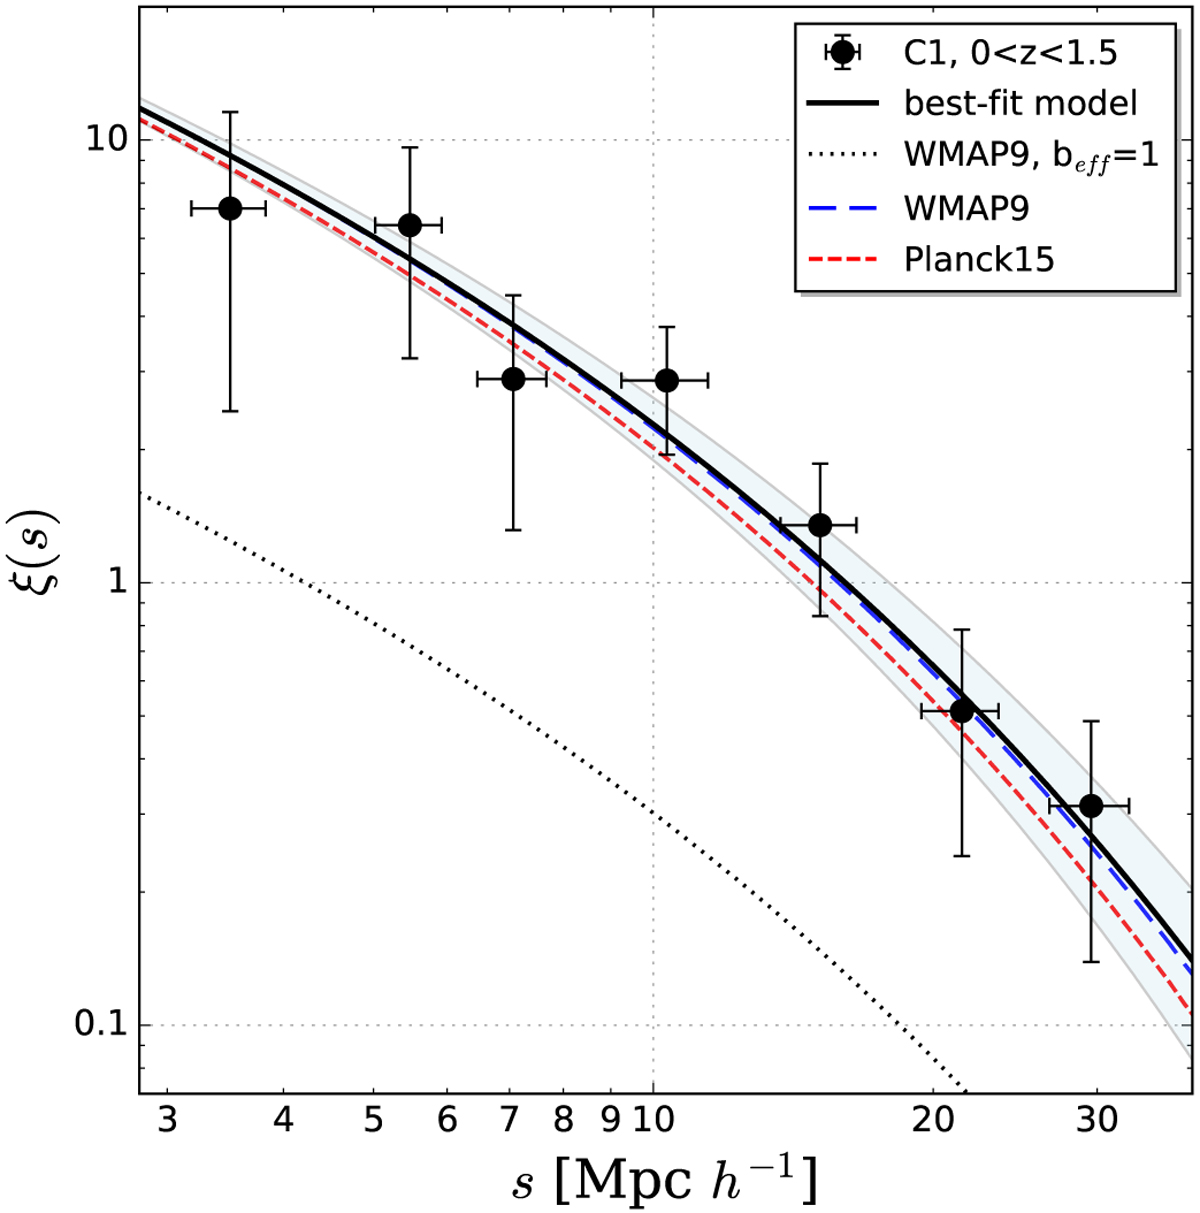
Redshift-space 2PCF of the C1 XXL clusters at z < 1.5 (black dots) compared to the best-fit model, i.e. the median of the MCMC posterior distribution (black solid line). The shaded area shows the 68% uncertainty on the posterior median. The derived best-fit model correlation length is s0 = 16± 2 h−1 Mpc. The red dashed and blue long-dashed lines show the WMAP9 and Planck15 predictions, respectively, computed as described in Sect. 4. Their correlation lengths are s0 = 15.83 h−1 Mpc and s0 = 14.81 h−1 Mpc, respectively. The vertical error bars are the diagonal values of the bootstrap covariance matrix, while the horizontal error bars show the standard deviation around the mean pair separation in each bin. The black dotted line shows the WMAP9 prediction with beff = 1 as a reference.
Current usage metrics show cumulative count of Article Views (full-text article views including HTML views, PDF and ePub downloads, according to the available data) and Abstracts Views on Vision4Press platform.
Data correspond to usage on the plateform after 2015. The current usage metrics is available 48-96 hours after online publication and is updated daily on week days.
Initial download of the metrics may take a while.