Fig. 1
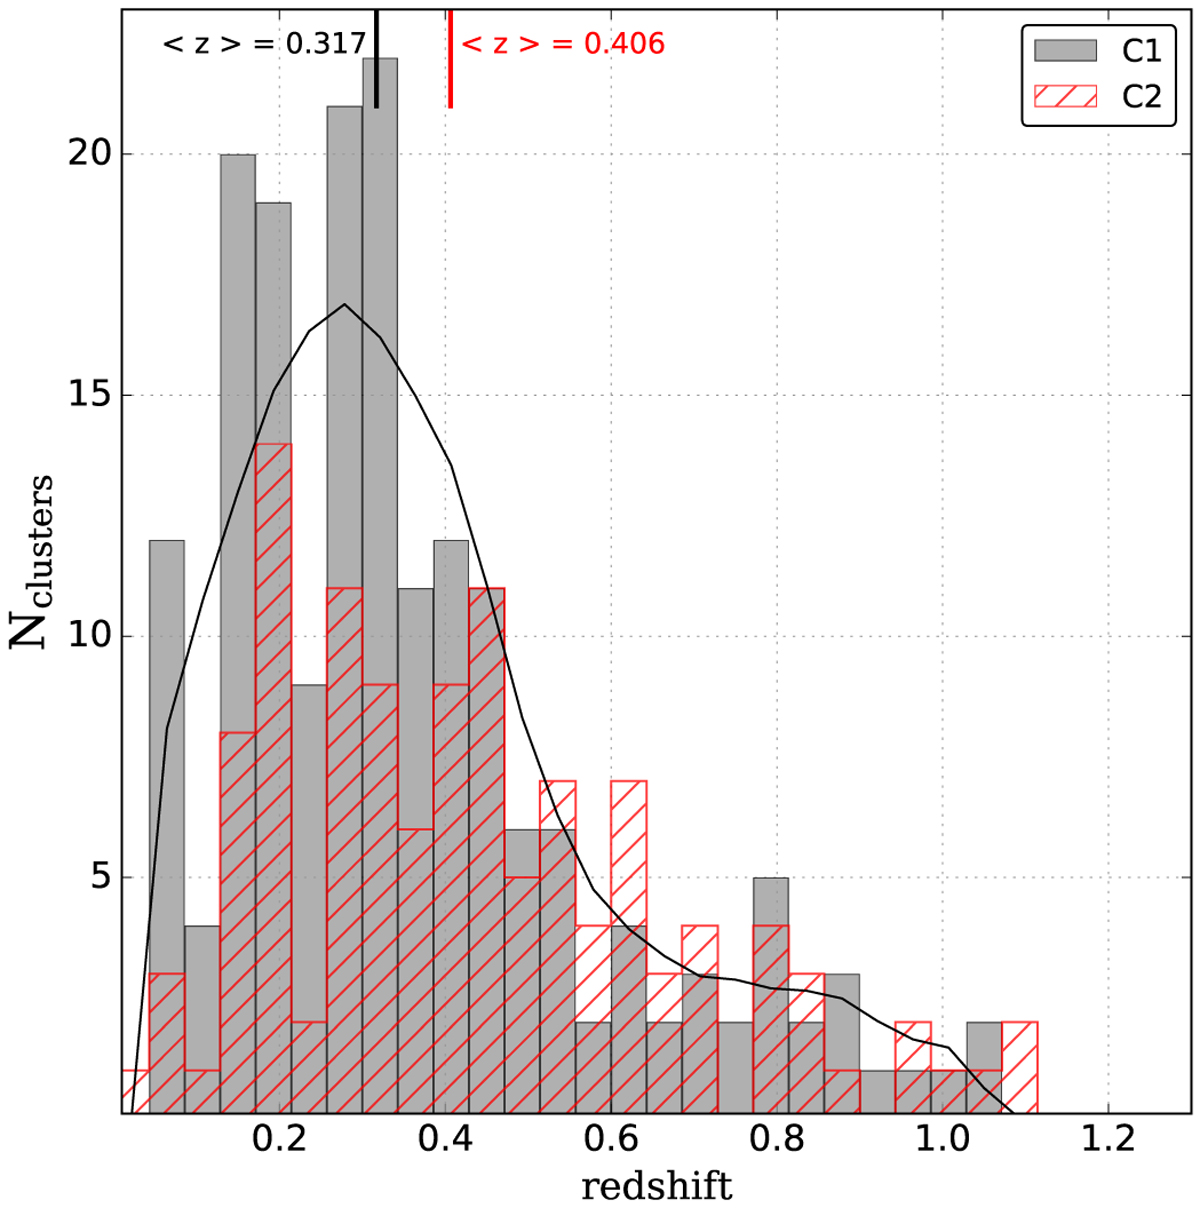
Redshift distribution of XXL C1 (grey histogram) and C2 (red histogram) clusters at z < 1.5, and of the C1 random objects normalised to the number of XXL C1 clusters (black line). The median redshifts of C1 and C2 clusters are shown at the top of the box.
Current usage metrics show cumulative count of Article Views (full-text article views including HTML views, PDF and ePub downloads, according to the available data) and Abstracts Views on Vision4Press platform.
Data correspond to usage on the plateform after 2015. The current usage metrics is available 48-96 hours after online publication and is updated daily on week days.
Initial download of the metrics may take a while.