| Issue |
A&A
Volume 620, December 2018
|
|
|---|---|---|
| Article Number | A66 | |
| Number of page(s) | 14 | |
| Section | Astrophysical processes | |
| DOI | https://doi.org/10.1051/0004-6361/201732153 | |
| Published online | 03 December 2018 | |
First ground-based measurement of sub-20 GeV to 100 GeV γ-Rays from the Vela pulsar with H.E.S.S. II
1
Centre for Space Research, North-West University, Potchefstroom 2520, South Africa
2
Universität Hamburg, Institut für Experimentalphysik, Luruper Chaussee 149, 22761 Hamburg, Germany
3
Max-Planck-Institut für Kernphysik, PO Box 103980, 69029 Heidelberg, Germany
4
Dublin Institute for Advanced Studies, 31 Fitzwilliam Place, Dublin 2, Ireland
5
National Academy of Sciences of the Republic of Armenia, Marshall Baghramian Avenue, 24, 0019 Yerevan, Republic of Armenia
6
Yerevan Physics Institute, 2 Alikhanian Brothers St., 375036 Yerevan, Republic of Armenia
7
Institut für Physik, Humboldt-Universität zu Berlin, Newtonstr. 15, 12489 Berlin, Germany
8
University of Namibia, Department of Physics, Private Bag 13301 Windhoek, Namibia
9
GRAPPA, Anton Pannekoek Institute for Astronomy, University of Amsterdam, Science Park 904, 1098 XH Amsterdam, The Netherlands
10
Department of Physics and Electrical Engineering, Linnaeus University, 351 95 Växjö, Sweden
11
Institut für Theoretische Physik, Lehrstuhl IV: Weltraum und Astrophysik, Ruhr-Universität Bochum, 44780 Bochum, Germany
12
Institut für Astro- und Teilchenphysik, Leopold-Franzens-Universität Innsbruck, 6020 Innsbruck, Austria
13
School of Physical Sciences, University of Adelaide, Adelaide 5005, Australia
14
LUTH, Observatoire de Paris, PSL Research University, CNRS, Université Paris Diderot, 5 Place Jules Janssen, 92190 Meudon, France
15
Sorbonne Université, Université Paris Diderot, Sorbonne Paris Cité, CNRS/IN2P3, Laboratoire de Physique Nucléaire et de Hautes Energies, LPNHE, 4 Place Jussieu, 75252 Paris, France
16
Laboratoire Univers et Particules de Montpellier, Université Montpellier, CNRS/IN2P3, CC 72, Place Eugène Bataillon, 34095 Montpellier Cedex 5, France
17
IRFU, CEA, Université Paris-Saclay, 91191 Gif-sur-Yvette, France
18
Astronomical Observatory, The University of Warsaw, Al. Ujazdowskie 4, 00-478 Warsaw, Poland
19
Aix-Marseille Université, CNRS/IN2P3, CPPM, Marseille, France
20
Instytut Fizyki Ja̧drowej PAN, ul. Radzikowskiego 152, 31-342 Kraków, Poland
21
School of Physics, University of the Witwatersrand, 1 Jan Smuts Avenue, Braamfontein, Johannesburg, 2050, South Africa
22
Laboratoire d’Annecy de Physique des Particules, Univ. Grenoble Alpes, Univ. Savoie Mont Blanc, CNRS, LAPP, 74000 Annecy, France
23
Landessternwarte, Universität Heidelberg, Königstuhl, 69117 Heidelberg, Germany
24
Université Bordeaux, CNRS/IN2P3, Centre d’Études Nucléaires de Bordeaux Gradignan, 33175 Gradignan, France
25
Oskar Klein Centre, Department of Physics, Stockholm University, Albanova University Center, 10691 Stockholm, Sweden
26
Institut für Astronomie und Astrophysik, Universität Tübingen, Sand 1, 72076 Tübingen, Germany
27
Laboratoire Leprince-Ringuet, Ecole Polytechnique, CNRS/IN2P3, 91128 Palaiseau, France
28
APC, AstroParticule et Cosmologie, Université Paris Diderot, CNRS/IN2P3, CEA/Irfu, Observatoire de Paris, Sorbonne Paris Cité, 10, rue Alice Domon et Léonie Duquet, 75205 Paris Cedex 13, France
29
Univ. Grenoble Alpes, CNRS, IPAG, 38000
Grenoble, France
30
Department of Physics and Astronomy, The University of Leicester, University Road, Leicester LE1 7RH, UK
31
Nicolaus Copernicus Astronomical Center, Polish Academy of Sciences, ul. Bartycka 18, 00-716 Warsaw, Poland
32
Institut für Physik und Astronomie, Universität Potsdam, Karl-Liebknecht-Strasse 24/25, 14476 Potsdam, Germany
33
Friedrich-Alexander-Universität Erlangen-Nürnberg, Erlangen Centre for Astroparticle Physics, Erwin-Rommel-Str. 1, 91058 Erlangen, Germany
34
DESY, 15738 Zeuthen, Germany
35
Obserwatorium Astronomiczne, Uniwersytet Jagielloński, ul. Orla 171, 30-244 Kraków, Poland
36
Centre for Astronomy, Faculty of Physics, Astronomy and Informatics, Nicolaus Copernicus University, Grudziadzka 5, 87-100 Torun, Poland
37
Department of Physics, University of the Free State, PO Box 339, Bloemfontein 9300, South Africa
38
Department of Physics, Rikkyo University, 3-34-1 Nishi-Ikebukuro, Toshima-ku, Tokyo 171-8501, Japan
39
Kavli Institute for the Physics and Mathematics of the Universe (Kavli IPMU), The University of Tokyo Institutes for Advanced Study (UTIAS), The University of Tokyo, 5-1-5 Kashiwa-no-Ha, Kashiwa City, Chiba 277-8583, Japan
40
Department of Physics, The University of Tokyo, 7-3-1 Hongo, Bunkyo-ku, Tokyo 113-0033, Japan
41
RIKEN, 2-1 Hirosawa, Wako, Saitama 351-0198, Japan
42
The School of Physics, The University of New South Wales, Sydney 2052, Australia
43
Instituto de Física de São Carlos, Universidade de São Paulo, Av. Trabalhador São-carlense, 400, CEP 13566-590 São Carlos, SP, Brazil
44
Space Science Division, Naval Research Laboratory, Washington 20375-5352, USA
45
CSIRO Astronomy and Space Science, Australia Telescope National Facility, PO Box 76, Epping, NSW 1710, Australia
46
Centre for Astrophysics and Supercomputing, Swinburne University of Technology Mail H30, PO Box 218, Hawthorn, VIC 3122, Australia
47
ARC Centre of Excellence for Gravitational Wave Discovery (OzGrav), Australia
Received:
23
October
2017
Accepted:
2
July
2018
Abstract
Aims. We report on the measurement and investigation of pulsed high-energy γ-ray emission from the Vela pulsar, PSR B0833−45, based on observations with the largest telescope of H.E.S.S., CT5, in monoscopic mode, and on data obtained with the Fermi-LAT.
Methods. Data from 40.3 h of observations carried out with the H.E.S.S. II array from 2013 to 2015 have been used. A dedicated very low-threshold event reconstruction and analysis pipeline was developed to achieve the lowest possible energy threshold. Eight years of Fermi-LAT data were analysed and also used as reference to validate the CT5 telescope response model and analysis methods.
Results. A pulsed γ-ray signal at a significance level of more than 15σ is detected from the P2 peak of the Vela pulsar light curve. Of a total of 15 835 events, more than 6000 lie at an energy below 20 GeV, implying a significant overlap between H.E.S.S. II-CT5 and the Fermi-LAT. While the investigation of the pulsar light curve with the LAT confirms characteristics previously known up to 20 GeV in the tens of GeV energy range, CT5 data show a change in the pulse morphology of P2, i.e. an extreme sharpening of its trailing edge, together with the possible onset of a new component at 3.4σ significance level. Assuming a power-law model for the P2 spectrum, an excellent agreement is found for the photon indices (Γ ≃ 4.1) obtained with the two telescopes above 10 GeV and an upper bound of 8% is derived on the relative offset between their energy scales. Using data from both instruments, it is shown however that the spectrum of P2 in the 10–100 GeV has a pronounced curvature; this is a confirmation of the sub-exponential cut-off form found at lower energies with the LAT. This is further supported by weak evidence of an emission above 100 GeV obtained with CT5. In contrast, converging indications are found from both CT5 and LAT data for the emergence of a hard component above 50 GeV in the leading wing (LW2) of P2, which possibly extends beyond 100 GeV.
Conclusions. The detection demonstrates the performance and understanding of CT5 from 100 GeV down to the sub-20 GeV domain, i.e. unprecedented low energy for ground-based γ-ray astronomy. The extreme sharpening of the trailing edge of the P2 peak found in the H.E.S.S. II light curve of the Vela pulsar and the possible extension beyond 100 GeV of at least one of its features, LW2, provide further constraints to models of γ-Ray emission from pulsars.
Key words: gamma rays: stars / pulsars: individual: PSR B0833-45 / radiation mechanisms: non-thermal
Corresponding authors: H.E.S.S. Collaboration, e-mail:This email address is being protected from spambots. You need JavaScript enabled to view it.
Funded by EU FP7 Marie Curie, grant agreement No. PIEF-GA-2012-332350.
Deceased.
© ESO 2018
1. Introduction
The Vela pulsar, PSR B0833−45, was one of the very first γ-Ray sources discovered with the SAS-II mission (Thompson et al. 1975) and has since been detected with subsequent space-borne γ-Ray instruments, namely, COS B (Kanbach et al. 1980), EGRET (Kanbach et al. 1994), AGILE (Pellizzoni et al. 2009), and Fermi-LAT (Abdo et al. 2009). At a period of 89 ms, the light curve of the pulsar exhibits two peaks, labelled P1 and P2, separated by 0.43 in phase and connected by a bridge emission, labelled P3.
The initial detection of the Vela pulsar with the Fermi-LAT instrument was based on 75 days of verification and early phase observations and reached energies above 10 GeV (Abdo et al. 2009). With 11 months of data, a high significance signal was obtained up to 20 GeV (Abdo et al. 2010a). More recently, Leung et al. (2014) exploiting a deeper data set of 62 months of observations, reported that the pulsations extend above 50 GeV with a weak total signal of five photons at a 4σ significance level.
As the brightest persistent source of high-energy γ-rays with a potential signal in the tens of GeV range, the Vela pulsar was one of the prime targets in the commissioning period of the 2012 upgrade of the H.E.S.S. array of imaging atmospheric Cherenkov telescopes (IACTs), located in the Khomas Highland of Namibia (23° 16′18″ S, 16° 30′00″ E, 1800 m). This upgrade, referred to as H.E.S.S. II, consisted of the addition of a 28 m equivalent diameter telescope (CT5) to its core array of four 12 m equivalent diameter telescopes (CT1-4) and was designed to push the energy threshold of the system to below 50 GeV (from above 100 GeV), thus bridging the gap with satellite-based γ-Ray instruments.
Previous observations of the Vela pulsar with the H.E.S.S. array, above a threshold energy of 170 GeV, had only resulted in upper limits (Aharonian et al. 2007). In this paper we report the detection of pulsed γ-Rays from the Vela pulsar using CT5-only data with the aim of reaching the lowest accessible energies. In order to evaluate the telescope performance, for the first time, near its trigger threshold, Fermi-LAT data from the Vela pulsar is analysed and used as reference. The light curve and its energy dependence are investigated in the 1–80 GeV and the spectra of its different features are derived using both instruments. Results are subsequently compared and their implications on pulsar emission models are discussed.
The paper is organized as follows: H.E.S.S. II observations and data analysis are presented in Sect. 2. Section 3 describes the Fermi-LAT data set and analysis. Light curves and spectra obtained from the two instruments are presented in Sects. 4 and 5. They are subsequently discussed and compared in Sect. 6. The three appendices give details of the commissioning of the new telescope, investigation of systematic errors on spectral fits, and complementary tables.
2. H.E.S.S. II observations and data analysis
2.1. Observations
Vela pulsar observations with H.E.S.S. II were carried out from March to May 2013, December to April 2014, and February to April 2015. A total of 40.3 h of data were selected based on weather conditions and instrumental effects while requiring a zenith angle smaller than 40° to reach a lower energy threshold and better sensitivity. The data were split into two sets corresponding to the commissioning period in 2013–14 (data set I in the following), and normal instrument operation in 2015 (data set II), consisting of 24 and 16.3 h, respectively. Observations were made in wobble mode (Aharonian et al. 2006) with a source-to-centre of the field-of-view distance of 0.7°.
2.2. Data analysis overview
To test and commission CT5 near its threshold energy, data from smaller telescopes were discarded during the analysis step and a new event reconstruction technique was developed. Following the raw data reduction using the calibration runs (see Aharonian et al. 2006 for an overall view), shower image intensities were obtained after application of a tail-cuts algorithm with two thresholds, i.e. five and seven photo-electrons (or p.e.), in order to remove noisy pixels and night sky background effects. The reconstruction algorithm was applied to each image to estimate the shower direction, impact distance, and energy. The background rejection is based on image shape parameters and a spatial cut on the reconstructed angle of events with respect to the source position. Further separation (of signal and background) was obtained in the time domain through selection in phase according to on- and off-phase intervals, which are defined a priori using the Fermi-LAT light curve. The overall monoscopic analysis pipeline and the response model of CT5 were validated through a detailed comparison of parameter distributions for Monte Carlo-generated (MC) events with those obtained from the observations. The expected distributions were derived using the Fermi-LAT spectrum as input to simulations. Details of this procedure are given in Appendix A.
2.3. Event reconstruction
The event reconstruction performs a non-parametric estimation of the shower properties, i.e. direction, impact distance, and energy, using a multi-layer perceptron artificial neural network. The training data set was produced through extensive MC simulations of the overall detection chain, starting from the generation of electromagnetic showers in the atmosphere down to the light collection and charge measurement in the detector (Bernlöhr 2008). The image intensity, Q, its second order moments (Hillas 1985), i.e. length l, width w, together with the angular distance, d, of the image barycentre to the source position, were used as input parameters to the neural networks.
The reconstruction algorithm for the event direction assumes that the shower direction projected onto the camera plane lies on the major axis of the image and its angular distance d from the barycentre is a function of l, w, and Q. For sources of known position, for example pulsars, it is further assumed that the source lies towards the centre of the field of view. This provides a better angular resolution at the lowest energies, at the expense of a higher background. To train the estimator for the impact distance, ρ, the actual value of d, calculated using the true source position in the field of view, is used as input in addition to the above-mentioned image parameters. The energy estimator relies on the following five parameters: Q, l, w, d, and ρ. During the training phase, the true value, ρtrue, is used to avoid the smearing of the estimator response by the impact distance error.
2.4. Background rejection
In addition to the selection through a spatial (angular) cut at the 68% containment radius, R68, the background rejection (of non-γ-ray showers) relies on image shape and on estimates of shower physical parameters. A multi-variate boosted decision tree (BDT) classifier, based on the TMVA package (Hoecker et al. 2007), is used in the same spirit as that for the H.E.S.S. I array (Becherini et al. 2011). During the training step, MC simulations of γ-ray induced images and real off-source data are used as signal and background inputs, respectively. In addition to l and w, physical parameters of the shower are obtained thanks to a 3D Gaussian-model fit of the corresponding photo-sphere (Lemoine-Goumard et al. 2006), and are used to improve the discrimination power. These consist of the shower length, width, and the depth of its maximum in the atmosphere. During the 3D fit of monoscopic events, the shower direction and impact distance are fixed to values obtained by the event reconstruction algorithm.
For the BDT-response parameter, ζ, uni-modal distributions are obtained both for signal and background training samples, and test samples are checked for their compatibility with the training samples, to exclude over-training artifacts. Both the training and test samples of the signal consist of MC-generated γ-Rays.
2.5. Performance
In order to reach a low-energy detection threshold, and given the expected very soft energy spectrum of the Vela pulsar (see Sect. 3), analysis cuts were optimized such as to yield a large effective area in the 10–20 GeV range, at the cost of a reduced γ-background separation.
The main analysis cut configuration (Cuts I) is based on an image intensity cut, Q > Qmin = 30 p.e., and a BDT discrimination cut, ζ > −0.1. The selected events exhibit a 68% containment radius R68 = 0.3° for the reconstructed direction. The reconstructed energy, Erec, shows a large bias near the detection threshold, decreasing with increasing energy (see Fig. 1, right panel).
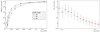 |
Fig. 1. Left: effective area of H.E.S.S. II-CT5 in monoscopic mode as a function of energy for different zenith angles: the specific analysis used here has been developed to yield a large effective area near threshold, i.e. 2.6 × 10² m2 at 10 GeV and 20° zenith angle. There is a strong dependency of the effective area near the threshold on zenith angle, e.g. a drop of a factor ∼10 below 30 GeV when comparing 20° and 40° zenith angles. Right: distribution of (Erec − Etrue)/Etrue as a function of Etrue at 20° zenith for a power-law distribution between 5 and 120 GeV with index Γ = 4. The parameters Erec and Etrue stand for reconstructed and simulated energies, respectively. Error bars show the spread (RMS) of events around the average value. We note that bins are correlated. |
This set of cuts provides a background rejection Brej = 96% and an effective area Aeff ∼ 4.5 × 10³ m2 at 20 GeV at a zenith angle of 20° (see Fig. 1, left panel). A second configuration with a higher energy threshold, (Cuts II), consists of a two times larger image intensity cut, Qmin = 60 p.e., together with a tighter spatial cut, R68 = 0.224°, thanks to the improvement of the point spread function. The resulting rejection is Brej = 98.4%, for Aeff ∼ 1.3 × 10³ m2 at 20 GeV.
2.6. Timing and phase selection
Event time stamps are provided by the central trigger system of the H.E.S.S. array with a long-term stability of better than 2 μs. This stability has been obtained thanks to a GPS receiver and various software corrections of the timing in the array (e.g. leap seconds and polar motion; Funk et al. 2004). The pulsar phase corresponding to each event is calculated using the Tempo2 package (Hobbs et al. 2006). Arrival times are transformed to the solar system barycentre and the phase of each event is computed using an ephemeris based on radio data from the Parkes Radio Telescope. The ephemeris is valid in the range MJD 54175.52–57 624.20 (with fiducial phase reference, TZRMJD = 55896.55) with a precision of better than 1 milli-period (91μs), degrading to ∼10 milli-periods around the glitch at MJD 56555.8. We note, however, that there were no H.E.S.S. II data taken in the vicinity of the glitch.
The search for pulsed signals is performed using a maximum likelihood-ratio test (Li & Ma 1983) on counts extracted from a priori defined on- and off-phase intervals (see Sect. 4.1) and by applying the H-test periodicity test (de Jager et al. 1989). The latter makes no prior assumptions about the light-curve model.
2.7. Spectral derivation
The energy spectra are derived using a maximum likelihood fit within a forward-folding scheme, assuming a priori spectral models (Piron et al. 2001). Two sets of instrument response functions (IRFs) were used for each cut configuration to account for different optical efficiencies of CT5 in data sets I and II. These IRFs were computed through extensive MC simulations as a function of the energy, zenith, and azimuthal angles of the telescope pointing direction, the impact parameter of showers, and the configuration of the telescope for each observing period. The pipeline was tested and validated by simulating 150 spectra of γ-rays with a steep power law (with index Γ = 4.0) added to background events such as to reach a signal-to-noise ratio similar to that of real data. In this way it is possible to estimate the energy threshold,  GeV in reconstructed units, defined as the energy above which the bias in the reconstructed parameters, due to the uncertainties in the IRFs, remains negligible as compared to the statistical errors (see Appendix B.1 for more details on this point).
3. Fermi-LAT data analysis
Fermi-LAT data were used to derive the expected signal above 10 GeV and to define the phase ranges of interest subsequently. The analysis was performed using 96 months of data acquired from August 4, 2008, to July 26, 2016. Events were selected in an energy range of 100 MeV to 500 GeV in the P8 Source class (event class = 128, event type = 3) within a region of interest (ROI) of 10° radius around the position of the Vela pulsar; P8R2_SOURCE_V6 IRFs were used. In order to reduce contamination by γ-rays from Earth’s limb, only γ-ray events with reconstructed zenith angles smaller than 90° were selected. For the specific study of the energy range overlapping with that of H.E.S.S. II, events were selected above 10 GeV and the ROI was limited to 5°. To compute the pulsar phase, selected events were folded using the Tempo2 Fermi plug-in (Ray et al. 2011) and the same ephemeris as that used for the H.E.S.S. II data (see Sect. 2.6). To generate the light curves, an additional selection cut was applied on the angular distance of each photon to the pulsar position, where θmax = 0.8°. This value corresponds to the 68% and 95% containment radii of the Fermi-LAT at 1 and 10 GeV, respectively, and allows us to retain a large number of highest energy photons, while limiting the background in the 1 − 10 GeV range.
Spectral analysis was performed with gtlike, with Galactic diffuse emission model, gll_iem_v06.fits, and isotropic diffuse model, iso_P8R2_SOURCE_V6_v06.txt. All sources from the Fermi-LAT third source catalogue (3FGL; Acero et al. 2015), within a region of 20° radius centred on the pulsar position were added to the source model, while parameters for sources outside the ROI were fixed during the fit. Finally, energy dispersion correction was enabled during the analysis to minimize systematic effects. More details are given in Appendix B.2.
4. Light curves
4.1. Fermi-LAT
The Fermi-LAT phasogram above 10 GeV of the Vela pulsar is shown in the bottom left panel of Fig. 2. It contains a total of 3817 events including a background of 190 events estimated using the phase interval [0.7–1.0]. This range, initially defined as the off-pulse interval in Abdo et al. (2009), was restricted to [0.8,1.0] in Abdo et al. (2010a) to limit contamination of background by the low-energy (i.e. < 1 GeV) trailing edge of P2. Given the focus of this study above the CT5 energy threshold, i.e. well above 1 GeV, the initial background phase range was retained. On-pulse phase ranges were defined for the three main features of the pulsar light curve as follows: [0.1–0.2] for the first peak, P1, [0.2–0.4] for the bridge, P3, [0.45–0.5] for the leading wing of the second peak, labelled LW2, and [0.5–0.6] for P2 itself. The latter is the most prominent peak in the phasogram, exhibiting 1977 excess events after subtraction of 19 background counts. Peaks P1, LW2 and P3 show lower intensities with excess counts of 382, 227, and 953, respectively. All three peaks are still present for energies higher than 20 GeV; P1, P2, and P3 have excess counts/significance levels of 21/5.1σ, 228/23.2σ and 43/6.3σ, respectively. Peak LW2 is also present above 20 GeV with 29 excess counts at 8.3σ. We note the high significance of LW2 above 20 GeV because its intensity relative to P2, LW2/P2 ∼ 15% does not decrease with increasing energy. This is in contrast to the P1/P2 ratio, which drops very quickly, or even to the P3/P1 ratio, which exhibits a smaller decrease. This hints at a harder spectrum for LW2, as compared to the two other features. This point is investigated further in Sects. 4.2, 5.1, and 6.
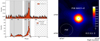 |
Fig. 2. Left: γ-Ray phasogram of the Vela pulsar obtained using 40.3 h of H.E.S.S. II-CT5 data with the Cuts I analysis configuration (top panel) and 96 months of Fermi-LAT data above 10 and 20 GeV (bottom panel). The dashed line on the CT5 phasogram shows the level of the background estimated in the [0.7–1.0] phase range. Right: Gaussian-smoothed excess map (σ = 0.15°) for the CT5 data in the P2 phase range, where the on and off maps are made after selection of events in on- and off-phase intervals defined as [0.5–0.6] and [0.7–1.0], respectively. The black triangle indicates the position of the pulsar. |
The above-mentioned phase ranges for P1, LW2, P2, P3, and for background estimation are used when searching for signals with H.E.S.S. II in the following section.
4.2. H.E.S.S. II
The phasogram of the Vela pulsar for the whole data set, obtained in monoscopic mode with the main analysis configuration, Cuts I, is shown in the top left panel of Fig. 2. Using the H test for periodicity on the full phasogram range yields a significance of > 17.5σ. A simple maximum likelihood-ratio test (Li & Ma 1983) within the predefined phase range for P2, [0.5 − 0.6], results in an excess of 15835 events, at a significance level of 15.6σ. The background, evaluated in the [0.7,1.0] phase interval, amounts to 765 679 events after normalization (see Table 1). The excess map is shown in the right panel of Fig. 2. Data set I was used for validation of the analysis pipeline and of the CT5 response model (see Appendix A) and as such was subject to few trials (< 10). Its analysis with the Cuts I configuration yields an excess of 9789 events at a significance level of 12.4σ. This high level of significance makes any correction for the trials factor irrelevant. Analysis with the same configuration of data set II yields an excess of 6047 events at 9.4σ. While the phase intervals P1 and P3 show positive excess counts, they are not significant based on a simple likelihood-ratio test (whether analysed individually or jointly; see Table 1). The figures do not improve with a phasogram model-based likelihood-ratio test (see Sect. 4.3) nor with the higher threshold analysis configuration, Cuts II. This is in contrast with the leading wing of P2, i.e. LW2. Indeed, while LW2 shows an excess of 2431 events at 3.6σ with the low-threshold analysis configuration (Cuts I), its significance reaches 4.5σ with Cuts II, with a corresponding excess of 1949 events. This reinforces the hint of a hard spectrum for LW2 found in the Fermi-LAT data in Sect. 4.1.
Number of events, excess counts (Excess), and significance (Sig) derived from the H.E.S.S. II light curve for the four features of the Vela pulsar as defined by their phase intervals.
The true-energy distribution of events in excess in the P2 phase range was derived using MC simulations (see details in Appendix A) and is shown in Fig. A.1, right panel. The average true energy of the excess is 31 GeV, 40% of events lie below 20 GeV (i.e. ∼6400 events out of the total excess), 36% (∼5400) are in the 10–20 GeV range, and still 6% (∼1000) below 10 GeV.
4.3. Light curve evolution with energy as seen with both instruments
In this section the light curves obtained with the Fermi-LAT are compared to those derived from H.E.S.S. II data, based on the same ephemeris (see Sects. 2.6 and 3). As the H.E.S.S. II data span only a subset of the Fermi observation period (i.e. 96 months), the stability of the LAT phasograms corresponding to the overlapping period and the overall data set was checked. This showed no measurable variation and hence systematic effects are expected to be negligible when comparing the two instruments light curves.
To characterize the Fermi-LAT phasograms, following Abdo et al. (2010a), two asymmetric Lorentzian functions and a log-normal function were used in a joint unbinned maximum likelihood fit to P1, P2, and P3, respectively. The same functions were used to fit the H.E.S.S. II data. However, given the low significance of P1 and P3, all of their parameters except the amplitude were fixed to values obtained above 10 GeV with the Fermi-LAT. Including in this manner both P1 and P3 (only P1 or P3) in the fit improves the likelihood at a level of 3.4σ (2.8σ and 1.7σ, respectively), when compared to a P2-only fit.
In order to study the evolution of the light curve as a function of energy, data of both instruments were subdivided into energy bands as follows: 1–3, 3–10, 10–20, and > 20 GeV for the LAT; and ∼10–33 GeV and ∼20–80 GeV for CT5. The former CT5 band is obtained by selecting events with Erec < 40 GeV and the latter by using the higher threshold Cuts II analysis configuration. The approximate lower bounds and overlap between these two energy bands are caused by the migration of events from lower to higher energies owing to the large bias and dispersion in energy reconstruction (see Sect. 2.3, and Fig. 1, right panel). The upper bound of 80 GeV corresponds to the average true energy in the last significant bin of the spectrum (discussed in Sect. 5.2).
Fit results for P2 (given in Table 2) confirm those obtained by Abdo et al. (2010a) in the 1–20 GeV range, i.e. the fitted position of P2, ΦP2 = 0.565, shows no variation, while its width decreases with increasing energy mainly owing to the sharpening of the outer (trailing) edge, σT, up to 10 GeV, and then also because of a decrease of its inner (leading) edge width, σL. We note, however, that the fit residuals are large, implying that the asymmetric Lorentzian model is not sufficient to describe the peak (see e.g. the 10–20 GeV fit in Fig. 3). Alternatively, the use of a Gaussian kernel density estimator (KDE) results in similar conclusions, except that the estimated peak position,  , is offset towards earlier phases, as it corresponds to the maximum of the peak distribution. Above 20 GeV in the Fermi-LAT data and in the first H.E.S.S. II energy band, the fitted position for P2 remains unchanged and the narrowing of both of its edges continues. While the KDE estimate of the position for the LAT is also stable, that of H.E.S.S. II,
  , is at variance with the former and with the fitted position,
  . This variation might be attributed to the onset of a second component in the phase range [0.550,0.558], which is also apparent in the second and highest H.E.S.S. II energy band (see Fig. 3). To test this hypothesis, a Gaussian component was added to the asymmetric Lorentzian function and fitted to data. While the limited statistics yield only a marginal evidence for such a component in each of the energy bands fitted separately (i.e. ≲2σ), a significance level of 3.4σ is obtained for the full energy range (shown on the top-most panel of Fig. 3). The additional component exhibits a Gaussian width of σG, P2 = 0.002 and its fitted position, ΦG, P2 = 0.557, coincides with the KDE result, as expected.
Best-fit parameters of an asymmetric Lorentzian model for the P2 peak, obtained from the Fermi-LAT and H.E.S.S. II data in different energy ranges, as part of a three-component function fit to the Vela pulsar light curve (see text).
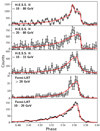 |
Fig. 3. γ-Ray phasogram of the Vela pulsar around P2 in the phase range [0.45,0.6], in different energy bands from 10 to 80 GeV, as obtained from the Fermi-LAT and H.E.S.S. II data. The red curve represents the asymmetric Lorentzian form fitted to data, except for the top-most panel where an additional Gaussian component is included in the fit to the H.E.S.S. II full energy range light curve (see Table 2). The background has been subtracted for the H.E.S.S. II light curves. The bin width for all histograms is 0.25 ms. |
In the full range and in the highest energy band, the fitted position of P2 moves to later phases by ∼5 milli-periods, ΦP2 ≃ 0.569, its trailing edge continues to sharpen, narrowing down to a width compatible with zero, whilst its leading edge width, σL, widens. As the peak maximum stays stable, the change in the fitted position is mainly caused by the strong sharpening of the P2 trailing edge rather than by a shift of the peak as a whole. Combined with the hardening of LW2 in the tens of GeV range (see Sects. 4.1, 5.1, and 5.2 below), this is possibly the cause of the larger value fitted for σL.
The fitted parameters for P1 and P3 (given in Table C.1) and their evolution with increasing energy, up to 20 GeV in the LAT data, are also in line with the results reported in Abdo et al. (2010a), namely: (i) no measurable change in the P1 position; (ii) a sharpening of its leading (or outer) edge and an initial increase of its trailing edge width above 3 GeV before a decrease; and (iii) a pronounced movement towards later phases of the P3 centroid accompanied by a narrowing of its width. We note important fit residuals here as was the case for P2, in particular close to the maximum of P1. The KDE estimated position of P1 shows, as in the case of P2, an offset  with respect to the fitted one, except that ΔΦ(P1) is positive here and increases with increasing energy, varying from +3 to +6 milli-periods in the 1 − 20 GeV range. Above the latter energy, both ΦP1 = 0.158 ± 0.003 and
  move towards higher phase values, but the scarcity of statistics forbids any firm conclusion. The same limitation holds for the widening of P3, i.e. the increase of σP3 = 0.157 ± 0.007 in the 10–20 GeV band to 0.39 ± 0.10 above 20 GeV.
5. Spectra
5.1. Fermi-LAT
Phase-averaged (PA) and phase-resolved spectra were fitted first above 100 MeV, assuming a power law with an exponential cut-off (ECPL, dN(E)/dE = N0(E/E0)−γexp[−(E/Ec)b]). Results, summarized in Table 3, show that the best-fit values of b differ significantly from unity. There is hence a clear preference for a sub-exponential cut-off for the PA spectrum, as already shown by Abdo et al. (2010a), but also for the phase-resolved spectra of P1, P2, LW2, and P3. These more precise determinations are obtained thanks to the large event statistics accumulated with the additional exposure, and to the improved performance of the P8 data processing software. In a second step, the spectra of the four light curve features were derived above 10 GeV, i.e. in the energy range overlapping with that of H.E.S.S. II. A simple power law was assumed that was independent from the lower energy part of the emission. For the strongest peak at these energies, P2, a spectral index1 of ΓLAT = 4.10 ± 0.08stat ± 0.1sys best fits the data with a normalization Φ0 = 40.3 ± 1.8stat ± 0.5sys × 10−9 TeV−1 cm−2 s−1, at a reference energy E0 = 25 GeV (see Fig. 5). The leading edge of P2, LW2 shows a spectrum as hard as that of P2, while both P1 and P3 exhibit steeper spectra with indices of 5.24 ± 0.27 and 5.05 ± 0.16, respectively.
Phase-averaged (PA) and phased-resolved spectra parameters for the Vela pulsar obtained with 96 months of Fermi-LAT data using the exponentially cut-off power-law hypothesis (ECPL) above 100 MeV, and a simple power law (PWL) for energies > 10 GeV.
To test for any measurable curvature in the tail at high energies of the P2 spectrum, the simplest quadratic form, i.e. a log parabola (LPB, dN(E)/dE = Φ0(E/E0)−Γ − β ln(E/E0)), was also fitted to the data above 10 GeV. A likelihood-ratio test between the power law and the curved model hypotheses favours the latter at a significance level of SLPB = 3.3σ. A study of systematic errors due to uncertainties in the model of bright nearby sources (mainly the Galactic plane; see Appendix B.2) shows that the best-fit values of parameters for the PL and LPB models (ΓLPB = 4.3 ± 0.13, β = 0.7 ± 0.2) are stable and that SLPB varies mildly between 3.1σ and 3.5σ. The impact of the curvature on the power-law index fit to P2 was investigated by selecting data above several energy thresholds, i.e. 8, 12, 15, 20, and 30 GeV. As could be expected, the index varies, ranging from Γ8GeV = 3.86 ± 0.05 above 8 GeV, to Γ15GeV = 4.55 ± 0.17 above 15 GeV (see Fig. 4), up to Γ20GeV = 4.80 ± 0.30 and Γ30GeV = 5.38 ± 0.78 for thresholds of 20 and 30 GeV, respectively. The log parabola model was also fitted to data for the different thresholds. While the LPB best-fit values do not show any significant change up to 15 GeV, the significance of the curvature, SLPB, attains a large value of 7.3σ above 8 GeV, decreasing to 1.9σ for 12 GeV and to below 1σ above 15 GeV. This is expected because of the progressive lack of event statistics.
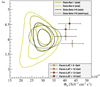 |
Fig. 4. Contours at one and two standard deviations shown for the fitted differential flux at 25 GeV, Φ0, and the power-law index, Γ for H.E.S.S. II data sets I, II, and their combination. The dashed curve shows the 1σ statistical contour for the overall data set combined quadratically with systematic errors, |


Compared to P2, LW2 shows an opposite behaviour, i.e. the LPB fit results in a convex curve, where Γ = 4.08 ± 0.20, β = − 0.60 ± 0.14, and SLPB = 2.4σ, and a power-law fit above 20 GeV gives Γ20GeV = 2.80 ± 0.45, suggesting a hardening as a function of energy. The fit of a broken power-law model (BPL; dN(E)/dE ∝ (E/Eb)−Γ1 if (E < Eb); else ∝(E/Eb)−Γ2) results indeed in indices Γ1 = 4.37 ± 0.24 and Γ2 = 1.37 ± 0.64, where the break energy Ec = 50.2 ± 9.5 GeV. The BPL is favoured, however, only at SBPL = 2.3σ. This point is further investigated in Sect. 6.4.
5.2. H.E.S.S. II
Data were selected with the main analysis configuration, Cuts I (see Sect. 2.3), and according to the definitions for P2 and off-phase intervals given in Table 1. The fit of a power law to the overall data set above  results in an index,
  , a normalization,
  , at the reference energy, E0 = 25 GeV, and with decorrelation energy, Ed = 21.5 GeV. The systematic uncertainties on normalization
  , and on index
  , are discussed in Appendix B.1, where it is shown, in particular, that data sets I and II yield compatible results when fitted independently (see Fig. 4), but a large deviation, δΦ0split = ± 20%, is obtained when splitting the data in two zenith angle bands (see Table B.1).
The energy range of the spectral fit is ∼10–110 GeV and was derived using MC simulations. Indeed, there is a non-negligible offset between the true energy and reconstructed energy scales due to the large bias and dispersion in the reconstructed energies near the threshold (see Fig. 1, right panel). Of the total of 15 835 excess events, 14 415 are retained for the spectral fit with the nominal threshold (Cuts I); those with a reconstructed energy  are excluded. The number of events with a true energy Etrue< 20 GeV participating to the spectral fit under the power-law hypothesis (see Appendix A) amounts up to ∼5800 events, out of which 15% lie below 10 GeV (i.e. 6% of the total). The threshold energy for the P2 spectrum as measured by H.E.S.S. II-CT5 was consequently chosen to be 10 GeV. This is further strengthened by the fact that the spectral index
  best compares with that of the Fermi-LAT ΓLAT = 4.10 ± 0.08, which was obtained for a threshold
  .
.
At the other end of the spectrum, the last significant bin covers the energy range, Erec ∈ [92 − 110] GeV, and entails 912 excess events at a significance level of 3.3σ. Owing to contamination from lower energy bins, the average true energy in this bin, under the power-law hypothesis, is ⟨Etrue⟩ = 82 GeV, where RMS, σ⟨Etrue⟩ = 29 GeV, and a portion, ρ>80GeV = 33%, of events are predicted to lie above 80 GeV. When assuming the ECPL or the LPB models derived from the Fermi-LAT data (see Sect. 5.1, above), these figures do not change significantly, i.e. ⟨Etrue⟩ = 80 GeV, σ⟨Etrue⟩ = 28 GeV and ρ>80GeV = 30%. As a result, the spectrum entails events with true energies ranging from below 10 GeV, up to ⟨Etrue⟩+σ⟨Etrue⟩ ∼ 110 GeV.
To test for curvature in the P2 spectrum, first, the LPB model was tested against the power-law hypothesis but resulted in unstable fits. Alternatively, the power law was fitted to events selected using Cuts II, i.e. above an approximately two times higher energy threshold (see Sect. 2.3 and Appendix B.1 for details). The spectral index obtained, i.e.  , is significantly larger than the best-fit value found with the lower threshold analysis above. Given that the two measurements share partially the same data, and thereby are correlated, the significance level of the deviation between the two indices exceeds 3σ.
The spectral fit results for P2 are presented as a confidence region in Fig. 5, in the energy range 10–110 GeV where the region above 80 GeV is distinguished by a lighter colour. In order to take into account the variation of the spectral index with energy, the confidence region consists of the union of 1σ error boxes obtained under the power-law hypothesis for the two energy thresholds, including systematic errors, as discussed in Appendix B.1. Above 110 GeV, the 99.7% confidence level upper limits are derived in two bins with energy ranges of [110–157] and [157–225] GeV.
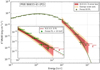 |
Fig. 5. Spectral energy distribution of the second peak, P2, of the Vela pulsar. The fit to the Fermi-LAT data above 100 MeV is shown as a dark green curve and points in the main frame. Red indicates the error box in the 10–110 GeV energy range for the power-law fits to H.E.S.S. II data. It consists of the union of 1σ statistical uncertainty confidence intervals obtained through the systematic error investigation procedure, including results from both analysis configurations, Cuts I and II (see Appendix B.1). The lighter colour above 80 GeV corresponds to the range where the significance of detection is difficult to assess precisely (see text). The error box has been extended to include a ±10% systematic error on the absolute energy scale. An upper limit of 8% on the relative shift in the absolute energy scales of the two instruments can be inferred based on the excellent agreement between the indices obtained under the power-law hypothesis (PWL). The inset shows the PWL fit to the Fermi-LAT data in solid green, and the H.E.S.S. II best-fit power law as a dark red line. Both are extrapolated above 80 GeV by dashed lines only to ease readability. The favoured hypothesis is a power law with an exponential cut-off (ECPL; see Table 3). All upper limits are derived as 99.7% confidence intervals. |
Although the significance of LW2 is low in the H.E.S.S. II data (see Table 1), its spectrum was tentatively derived using the PWL model with both analysis configurations (the lack of statistics forbids any other meaningful model test). In contrast to the behaviour observed in the case of P2, the photon indices obtained for LW2 with the nominal threshold cuts, ΓCI = 3.72 ± 0.51, and the higher threshold analysis, ΓCII = 3.48 ± 0.21, do not show any significant variation. The energy bin [92–110] GeV displays an excess of 343 excess at 2.5σ, but the next bin, [110–157] GeV, shows also an excess of 251 events at a significance level of 2.1σ. Assuming the spectral models derived from the LAT data, the average true energy in the combined bin, [92–157] GeV, varies from ⟨Etrue⟩∼110 GeV for a simple power law with Γ20GeV = 2.80, to ⟨Etrue⟩ ∼ 130 GeV for the BPL form. The combined excess (594 events at 3.3σ) represents 30% of the total excess measured from LW2 with Cuts II (see Table 1); for P2 this ratio is only ∼13%.
Along with the spectral fit results, these numbers point to the harder nature of the LW2 spectrum, as compared to P2, in the tens of GeV range, and thereby support the indications found in the Fermi-LAT data in Sects. 4.1 and 5.1, and in the analysis of the H.E.S.S. II light curve in Sect. 4.2.
6. Discussion
6.1. Relative energy scale offset between Fermi-LAT and H.E.S.S. II
The Vela signal is a unique occasion to compare the energy scale of a ground-based telescope such as H.E.S.S. II with that of the beam-calibrated LAT instrument. Indeed, the pulsed nature of the emission enables one to extract the on- and off-source events from the same portion of the field of view, thereby eliminating a significant source of systematic errors that arise from variations of acceptance as a function of direction in the sky and/or position in the camera. The power-law index for P2 as measured by H.E.S.S. II is in excellent agreement with that derived with the Fermi-LAT above 10 GeV, where  and
and  . While the flux normalizations show a deviation, their ratio,
  (see Fig. 4 and the inset in Fig. 5), remains compatible with unity, given the systematic uncertainties (see Appendices B.1 and B.2). It is noticeable that
  is stable with respect to variations of
  from 8 to 20 GeV.
If the deviation in flux is assumed to be only due to a difference in absolute energy scales, a relative offset,  , can be inferred between the two instruments. However, as other systematic effects that can bias the effective area (e.g. the uncertainties on event reconstruction and/or selection efficiencies) are not excluded, this value has to be considered as a conservative upper bound. With regard to the absolute energy measurements, this value of
  is well contained within the uncertainty range of ±10% usually quoted for IACTs (e.g. Aharonian et al. 2006; Meyer et al. 2010). Additionally, the systematic error estimated for the absolute scale of the Fermi-LAT, +2%/−5% (Ackermann et al. 2012), should be taken into account.
6.2. Evolution of the light curve as a function of energy
The fit of a three-component function (two asymmetric Lorentzian and a log-normal function) to the Fermi-LAT data in different energy bands confirms the main characteristics of the Vela pulsar light curve that were previously revealed with COS B (Kanbach et al. 1980), elaborated with EGRET (Kanbach et al. 1994) and AGILE (Pellizzoni et al. 2009), and then subsequently measured up to 20 GeV with the Fermi-LAT (Abdo et al. 2009, 2010a). Namely, we observe, with increasing energy: (i) a decrease in the P1/P2 ratio; (ii) a sharpening of the outer edges of both peaks; (iii) a continuous decrease of the inner width of P2, while that of P1 attains a maximum in the 3–10 GeV band before decreasing; (iv) no measurable change in the P1 and P2 positions; and (v) a shift to later phases of P3. As mentioned in Sect. 4.3, the asymmetric Lorentzian functional form does not describe fully the data, and the analysis of the light curve with a KDE, i.e. with no strong a priori assumptions on its form, results in the following two differences: (vi) an offset of few milli-periods is obtained between the fitted positions of P1 and P2 and their maxima and (vii) the maximum of P1 shifts to later phases with increasing energy.
While H.E.S.S. II data below 33 GeV confirm the evolution with energy of the P1/P2 ratio and P2 noted in (i), (iv), and (vi) above, in the tens of GeV energy range, a qualitative change of P2 is found. A shift to later phases – by ∼5 milli-periods – of its fitted position is observed, which can be attributed to an extreme sharpening of its trailing edge, together with the possible onset of a new component at 3.4σ significance level. These, combined with the hardening of LW2 above 50 GeV, could be at the origin of the widening of the leading edge of P2.
The behaviour of the amplitude ratio of P1 and P2 as a function of energy is in line with results obtained for some other bright Fermi-detected pulsars (e.g. Abdo et al. 2010b,c,d). The physical processes responsible for this trend are not known, although within the context of curvature radiation in the radiation-reaction limit, this trend may be pointing to relatively weaker electric fields and/or smaller curvature radii of magnetic field lines in the magnetospheric regions where P1 originates, compared to the P2 regions. Bednarek (2012) proposed a light cylinder gap model in which the leading and trailing magnetic field lines have different radii of curvature, leading to different spectral cut-offs for the two main peaks. Hirotani (2014), however, showed that this model is based on the erroneous assumption of divergence of the Goldreich–Julian charge density at the light cylinder. Furthermore, in the popular caustic models, the two pulses are not formed by leading and trailing field lines, but rather by caustics (where photons accumulate in phase) formed by either trailing or overlapping magnetic field lines (Dyks et al. 2004). The P1/P2 trend has furthermore not been reproduced (or predicted) by recent 3D numerical magnetospheric gap models of γ-ray pulsars (e.g. Wang et al. 2011). On the other hand, Brambilla et al. (2015) introduced a pulsar model with the accelerating electric field operating outside the light cylinder and found that in about half of their predicted light curves, a larger energy cut-off value was produced in P2 compared to P1 because of a larger azimuthally dependent electric field in that emission region.
A decrease in pulse width with increasing energy was also seen for the Crab pulsar (Abdo et al. 2010b; VERITAS Collaboration et al. 2011; Aleksić et al. 2012). This phenomenon may point to the fact that the particles responsible for high-energy emission are confined to a smaller region embedded within the γ-ray emitting zone, corresponding to general expectations of magnetospheric gap models, where the accelerating electric field is zero at the gap boundaries, but peaks in its centre (Muslimov & Harding 2003; Wang et al. 2010). Wind models, in turn, naturally explain a pulse width that decreases with increasing energy, where the high-energy pulsed emission is due to Doppler-boosted synchrotron radiation by relativistic electrons powered by magnetic field line reconnections in the wind current sheet (e.g. Arka & Dubus 2013; Mochol & Pétri 2015).
6.3. Spectral shape of P2 in 10–80 GeV range
Although a very good agreement is found between the power-law indices derived for the Fermi-LAT data above 10 GeV and for H.E.S.S. II with the Cuts I analysis configuration, the power law is not the favoured model for the spectrum of P2 at these energies. Indeed, the curvature measured with the LAT at a significance level of 3.3σ assuming the LPB model, which has been shown to be robust against systematic uncertainties in Appendix B.2, is confirmed by the variation observed in the spectral index as a function of the analysis threshold energy for both instruments, in a consistent manner:  and
and  . The fitted values of ΓHESS and ΓLAT correspond hence to the average slope of a curved spectrum (i.e. in a log-log plot) above a given threshold, rather than corresponding to the index of a power law. The signal from P2 detected by H.E.S.S. II consists therefore of the same spectral component as that of the Fermi-LAT data above 100 MeV, and thereby confirms its sub-exponential cut-off (ECPL) form.
Abdo et al. (2010a) and Leung et al. (2014) already showed the ECPL nature of the phase-averaged spectrum of the Vela pulsar. In addition to P2, our analysis of the eight-year LAT data shows a clear preference for the ECPL model for the phase-resolved spectra of P1, LW2, and P3. The traditional outer gap models with a single value of injected current may have difficulty reproducing this spectrum invoking the usual curvature radiation component, given its high-energy sub-exponential form. Leung et al. (2014) therefore proposed a “superposition of stationary outer gap states” to match their Fermi-LAT spectrum. However, this model implies an increase in pulse width with energy (cf. their Sect. 3), contrary to what is seen.
6.4. Hints of pulsed emission > 100 GeV from the Vela PSR
Estimation based on the energy migration matrix shows that under the ECPL hypothesis for P2, with best-fit parameters of the LAT spectrum, H.E.S.S. II data contains more than 2000 events above 50 GeV in the [0.5,0.6] phase range, and that the emission extends at least up to an energy of 80 GeV. This corresponds to the average energy of the highest energy significant bin in the data ([92–110] GeV) using Cuts I; 912 events are at a significance level of 3.3σ of which a portion, ρ>80GeV = 30%, is predicted to lie above 80 GeV. With the tighter Cuts II, the excess in this bin drops to 620 events at 3.0σ, while the next bin ([110–157] GeV), which has an estimated ⟨Etrue⟩∼110 GeV, shows an excess of 334 events at a level of 1.8σ only.
The 96 months Fermi-LAT data set contains, in turn, 31 photons above 50 GeV, of which 7 lie in the P2 phase range and only two photons exhibit an energy above 80 GeV, i.e. 93.7 and 206.3 GeV. The P2 signal above 90 GeV found by Leung et al. (2014) at a significance level of 3.3σ consisted of these two photons, detected within the first 62 months of data, and with the P7REP processing. Here, with the P8 processing, the source probability (i.e. the estimated probability for a photon to originate from the pulsar) of the 206.3 GeV event has dropped from  to
to  , mainly due to its larger reconstructed angular distance to the source (ΔθP8 = 0.33°, as compared to ΔθP7REP = 0.092°; see Table C.2). Still, a phase-resolved analysis in the P2 range above 80 GeV results in a test statistic value, TS = 9.8, i.e. a significance of ∼3σ. Hence, both instruments give independent evidence for a weak signal in the P2 phase range above 80 GeV and at a significance level of ∼3σ each.
The leading wing of P2, LW2, shows different behaviour. As discussed in Sect. 5.1, the log-parabola (LPB) fit to Fermi-LAT data results in a convex curve, suggesting a hardening of its spectrum with increasing energy. This is confirmed by a BPL fit, which yields a break energy Ec = 50.2 ± 9.5 GeV, and indices Γ1 = 4.37 ± 0.24 and Γ2 = 1.37 ± 0.64. Although the two indices differ significantly from each other, a likelihood-ratio test shows that the BPL is favoured only at SBPL = 2.3σ. At the same time, a power-law fit above 80 GeV yields an index, Γ80 Ge V = 1.80 ± 1.1, which is well compatible with Γ2, and a test statistic value, TS = 16.8. This corresponds to an evidence for a signal above 80 GeV at a significance level of ∼4σ. Investigation at the event level shows indeed that five out of the fifteen events selected with an energy > 80 GeV (and within a radius of θmax = 0.8°; see Sect. 3) lie in the phase range corresponding to LW2, [0.45–0.5], i.e. 5% of the full rotation period, or a chance probability of < 0.001 (> 3σ). In addition, four of these events display a high probability of originating from the pulsar, PPSR, ranging from 77% to > 99% (see Table C.2). It is remarkable that all events except one have an energy exceeding 100 GeV, of which the highest energy photon exhibits 377 GeV together with the highest source probability, PPSR> 99.3%. We note that none of these events display any peculiarity, regarding reconstructed angles in the instrument, conversion types, or zenith angles. We note also that two (four) of the other > 80 GeV events are within the P1 phase interval (P3, respectively), and that none are detected in the background interval (see Table C.2).
The hardness of the LW2 spectrum in the tens of GeV range is further supported by the H.E.S.S. II data: (i) the analysis of the H.E.S.S. II light curve in the LW2 phase range (Sect. 4.2) resulted in a higher significance (4.5σ) with the higher threshold configuration, Cuts II, as compared to the nominal threshold analysis, Cuts I (3.4σ); (ii) contrary to the steepening observed for P2 with the latter configuration, the photon index obtained for LW2,  , does not show any significant variation as compared to
  , which is derived with the nominal threshold analysis, Cuts I (Sect. 5.2); and (iii) although the LW2/P2 flux ratio at 10 GeV is of only ∼12% (see Table 3), the highest energy bins of the LW2 spectrum display excess counts and significance levels comparable to those obtained for P2, in which a total of 594 events in the [110–157] GeV range, corresponding to ⟨Etrue⟩ ≳ 100 GeV, were detected at a significance level of 3.3σ. There are therefore converging indications from both instruments that the emission from LW2 is harder than that from P2 and that it extends beyond 100 GeV, i.e. to the very high-energy (VHE) range, in contrast to the weak signal from P2 itself.
The Crab pulsar is the only pulsar known to emit at energies beyond 100 GeV (VERITAS Collaboration et al. 2011; Aleksić et al. 2012). In the case of Geminga, the second brightest γ-ray pulsar in the GeV sky, only upper limits have been derived above 100 GeV so far (Aliu et al. 2015; Ahnen et al. 2016). McCann (2015) performed a stacking analysis involving 115 Fermi pulsars (excluding the Crab) and did not find any significant emission above 50 GeV. The VHE emission is detected from both peaks of the Crab pulsar and also from the bridge (Aleksić et al. 2014). More recently, γ-Rays reaching 1.5 TeV (Ansoldi et al. 2016) were reported from the second peak of the pulsar. There have been a number of attempts to explain (e.g. Aleksić et al. 2012; Aharonian et al. 2012) and predict the VHE emission by pulsars (e.g. Muslimov & Harding 2003, 2004; Du et al. 2012). No significant VHE emission is expected so far for current IACTs from the Vela pulsar, (e.g. Harding & Kalapotharakos 2015; Mochol & Pétri 2015). It should be noted that all VHE components of the Crab pulsar seem to connect smoothly with their lower energy counterparts, i.e. a simple power law describes well the data above 10 GeV. This would not be the case for LW2, given that if the evidence for its hardening above 50 GeV is confirmed, it should correspond to the rise of a second and new component.
7. Summary
Pulsed γ-Ray emission from the Vela pulsar was detected at high significance with the largest telescope of the H.E.S.S. II array, CT5. This telescope was added as an upgrade to the initial four-telescope set-up in 2012 in view of lowering its detection energy threshold down to a few tens of GeV. Data from 40.3 h of observations have been analysed in monoscopic mode, through a reconstruction pipeline specifically designed to achieve a large effective area at the lowest energies possible. Data from eight years of Fermi-LAT observations were analysed in parallel and used as input to MC simulations of the overall detection chain, and subsequently used for comparison to the H.E.S.S. II results. An excellent agreement was obtained and made it possible to validate the response model and the analysis pipeline of CT5 down to the sub-20 GeV range with reasonable systematic uncertainties. An upper limit on the relative offset in the energy scales of the two instruments,  , could be consequently derived.
Measurement of spectra extending to the sub-20 GeV domain is unprecedented in ground-based γ-ray astronomy. We note, however, that the pulsed nature of the signal plays a major role here, as it enables extraction of the on- and off-source events from the same portion of the field of view, thereby eliminating a major part of systematic effects that arise from variations of acceptance as a function of direction in the sky and/or position in the camera.
The study of the Vela pulsar light curve and its energy dependence with the Fermi-LAT confirmed its main and previously known characteristics up to 20 GeV. Beyond this energy, a shift to later phases was found for P2 in the H.E.S.S. II light curve, possibly owing to a change of morphology and the onset of a new component at a confidence level of 3.4σ. The measurement of the P2 spectrum above different energy thresholds with the two instruments demonstrated its curved form in the 10–80 GeV range; there was only weak evidence for a signal above 100 GeV. In contrast, the leading wing of P2 was shown to possibly exhibit a hard component setting in above ∼50 GeV, with hints of extension beyond 100 GeV, namely, a 4σ signal above 80 GeV including 4 events with energies > 100 GeV in the LAT data and 594 events above 100 GeV in the CT5 data at 3.3σ.
In fact, the local slope of the spectrum, given the reduced energy range studied here.
As recommended in https://fermi.gsfc.nasa.gov/ssc/data/analysis/scitools/Aeff_Systematics.html
Acknowledgments
The support of the Namibian authorities and of the University of Namibia in facilitating the construction and operation of H.E.S.S. is gratefully acknowledged, as is the support by the German Ministry for Education and Research (BMBF), the Max Planck Society, the German Research Foundation (DFG), the Helmholtz Association, the Alexander von Humboldt Foundation, the French Ministry of Higher Education, Research and Innovation, the Centre National de la Recherche Scientifique (CNRS/IN2P3 and CNRS/INSU), the Commissariat à l’énergie atomique et aux énergies alternatives (CEA), the U.K. Science and Technology Facilities Council (STFC), the Knut and Alice Wallenberg Foundation, the National Science Centre, Poland grant no. 2016/22/M/ST9/00382, the South African Department of Science and Technology and National Research Foundation, the University of Namibia, the National Commission on Research, Science & Technology of Namibia (NCRST), the Austrian Federal Ministry of Education, Science and Research and the Austrian Science Fund (FWF), the Australian Research Council (ARC), the Japan Society for the Promotion of Science and by the University of Amsterdam. We appreciate the excellent work of the technical support staff in Berlin, Zeuthen, Heidelberg, Palaiseau, Paris, Saclay, Tübingen, and in Namibia in the construction and operation of the equipment. This work benefitted from services provided by the H.E.S.S. Virtual Organisation, supported by the national resource providers of the EGI Federation. The Parkes radio telescope is part of the Australia Telescope, which is funded by the Commonwealth Government for operation as a National Facility managed by CSIRO. Work at NRL is supported by NASA.
References
- Abdo, A. A., Ackermann, M., Atwood, W. B., et al. 2009, ApJ, 696, 1084 [NASA ADS] [CrossRef] [Google Scholar]
- Abdo, A. A., Ackermann, M., Ajello, M., et al. 2010a, ApJ, 713, 154 [NASA ADS] [CrossRef] [Google Scholar]
- Abdo, A. A., Ackermann, M., Ajello, M., et al. 2010b, ApJ, 708, 1254 [NASA ADS] [CrossRef] [Google Scholar]
- Abdo, A. A., Ackermann, M., Ajello, M., et al. 2010c, ApJ, 720, 272 [NASA ADS] [CrossRef] [Google Scholar]
- Abdo, A. A., Ajello, M., Antolini, E., et al. 2010d, ApJ, 720, 26 [NASA ADS] [CrossRef] [Google Scholar]
- Acero, F., Ackermann, M., Ajello, M., et al. 2015, ApJs, 218, 23 [NASA ADS] [CrossRef] [Google Scholar]
- Ackermann, M., Ajello, M., Albert, A., et al. 2012, ApJs, 203, 4 [CrossRef] [Google Scholar]
- Aharonian, F., Akhperjanian, A. G., Bazer-Bachi, A. R., et al. 2006, A&A, 457, 899 [NASA ADS] [CrossRef] [EDP Sciences] [Google Scholar]
- Aharonian, F., Akhperjanian, A. G., Bazer-Bachi, A. R., et al. 2007, A&A, 466, 543 [NASA ADS] [CrossRef] [EDP Sciences] [Google Scholar]
- Aharonian, F. A., Bogovalov, S. V., & Khangulyan, D. 2012, Nature, 482, 507 [NASA ADS] [CrossRef] [PubMed] [Google Scholar]
- Ahnen, M. L., Ansoldi, S., Antonelli, L. A., et al. 2016, A&A, 591, A138 [NASA ADS] [CrossRef] [EDP Sciences] [Google Scholar]
- Aleksić, J., Alvarez, E. A., Antonelli, L. A., et al. 2012, A&A, 540, A69 [NASA ADS] [CrossRef] [EDP Sciences] [Google Scholar]
- Aleksić, J., Ansoldi, S., Antonelli, L. A., et al. 2014, A&A, 565, L12 [NASA ADS] [CrossRef] [EDP Sciences] [Google Scholar]
- Aliu, E., Archambault, S., Archer, A., et al. 2015, ApJ, 800, 61 [NASA ADS] [CrossRef] [Google Scholar]
- Ansoldi, S., Antonelli, L. A., Antoranz, P., et al. 2016, A&A, 585, A133 [NASA ADS] [CrossRef] [EDP Sciences] [Google Scholar]
- Arka, I., & Dubus, G. 2013, A&A, 550, A101 [NASA ADS] [CrossRef] [EDP Sciences] [Google Scholar]
- Becherini, Y., Djannati-Ataï, A., Marandon, V., Punch, M., & Pita, S. 2011, Astropart. Phys., 34, 858 [NASA ADS] [CrossRef] [Google Scholar]
- Bednarek, W. 2012, MNRAS, 424, 2079 [NASA ADS] [CrossRef] [Google Scholar]
- Bernlöhr, K. 2008, Astropart. Phys., 30, 149 [NASA ADS] [CrossRef] [Google Scholar]
- Brambilla, G., Kalapotharakos, C., Harding, A. K., & Kazanas, D. 2015, ApJ, 804, 84 [NASA ADS] [CrossRef] [Google Scholar]
- de Jager, O. C., Raubenheimer, B. C., & Swanepoel, J. W. H. 1989, A&A, 221, 180 [NASA ADS] [Google Scholar]
- Du, Y. J., Qiao, G. J., & Wang, W. 2012, ApJ, 748, 84 [NASA ADS] [CrossRef] [Google Scholar]
- Dyks, J., Harding, A. K., & Rudak, B. 2004, ApJ, 606, 1125 [NASA ADS] [CrossRef] [Google Scholar]
- Funk, S., Hermann, G., Hinton, J., et al. 2004, Astropart. Phys., 22, 285 [NASA ADS] [CrossRef] [Google Scholar]
- Grondin, M.-H., Romani, R. W., Lemoine-Goumard, M., et al. 2013, ApJ, 774, 110 [NASA ADS] [CrossRef] [Google Scholar]
- Harding, A. K., & Kalapotharakos, C. 2015, ApJ, 811, 63 [NASA ADS] [CrossRef] [Google Scholar]
- Hewitt, J. W., Grondin, M.-H., Lemoine-Goumard, M., et al. 2012, ApJ, 759, 89 [NASA ADS] [CrossRef] [Google Scholar]
- Hillas, A. M. 1985, Int. Cosmic Ray Conf., 3 [Google Scholar]
- Hirotani, K. 2014, MNRAS, 442, L43 [NASA ADS] [CrossRef] [Google Scholar]
- Hobbs, G. B., Edwards, R. T., & Manchester, R. N. 2006, MNRAS, 369, 655 [NASA ADS] [CrossRef] [Google Scholar]
- Hoecker, A., Speckmayer, P., Stelzer, J., et al. 2007, PoS, ACAT, 040 [Google Scholar]
- Kanbach, G., Bennett, K., Bignami, G. F., et al. 1980, A&A, 90, 163 [Google Scholar]
- Kanbach, G., Arzoumanian, Z., Bertsch, D. L., et al. 1994, A&A, 289, 855 [NASA ADS] [Google Scholar]
- Lemoine-Goumard, M., Degrange, B., & Tluczykont, M. 2006, Astropart. Phys., 25, 195 [NASA ADS] [CrossRef] [Google Scholar]
- Leung, G. C. K., Takata, J., Ng, C. W., et al. 2014, ApJ, 797, L13 [NASA ADS] [CrossRef] [Google Scholar]
- Li, T.-P., & Ma, Y.-Q. 1983, ApJ, 272, 317 [NASA ADS] [CrossRef] [Google Scholar]
- McCann, A. 2015, ApJ, 804, 86 [NASA ADS] [CrossRef] [Google Scholar]
- Meyer, M., Horns, D., & Zechlin, H.-S. 2010, A&A, 523, A2 [NASA ADS] [CrossRef] [EDP Sciences] [Google Scholar]
- Mochol, I., & Pétri, J. 2015, MNRAS, 449, L51 [NASA ADS] [CrossRef] [Google Scholar]
- Muslimov, A. G., & Harding, A. K. 2003, ApJ, 588, 430 [NASA ADS] [CrossRef] [Google Scholar]
- Muslimov, A. G., & Harding, A. K. 2004, ApJ, 606, 1143 [NASA ADS] [CrossRef] [Google Scholar]
- Pellizzoni, A., Pilia, M., Possenti, A., et al. 2009, ApJ, 691, 1618 [NASA ADS] [CrossRef] [Google Scholar]
- Piron, F., Djannati-Atai, A., Punch, M., et al. 2001, A&A, 374, 895 [NASA ADS] [CrossRef] [EDP Sciences] [Google Scholar]
- Ray, P. S., Kerr, M., Parent, D., et al. 2011, ApJs, 194, 17 [NASA ADS] [CrossRef] [Google Scholar]
- Tanaka, T., Allafort, A., Ballet, J., et al. 2011, ApJ, 740, L51 [NASA ADS] [CrossRef] [Google Scholar]
- Thompson, D. J., Fichtel, C. E., Kniffen, D. A., & Ogelman, H. B. 1975, ApJ, 200, L79 [NASA ADS] [CrossRef] [Google Scholar]
- VERITAS Collaboration, (Aliu, E., et al.) 2011, Science, 334, 69 [NASA ADS] [CrossRef] [PubMed] [Google Scholar]
- Wang, Y., Takata, J., & Cheng, K. S. 2010, ApJ, 720, 178 [NASA ADS] [CrossRef] [Google Scholar]
- Wang, Y., Takata, J., & Cheng, K. S. 2011, MNRAS, 414, 2664 [NASA ADS] [CrossRef] [Google Scholar]
Appendix A: Validation of H.E.S.S. II CT5 response model and analysis pipeline
Relatively good knowledge of the source spectrum above 10 GeV, thanks to the analysis of Fermi-LAT data, enables us to use the Vela pulsar emission as a test beam to check the validity of the overall analysis pipeline, i.e. the instrument response model obtained through MC simulations, and the methods for event direction and energy reconstruction. Data set I of the commissioning period was initially used for such a study, where the power law obtained from Fermi-LAT data above  on P2 (with photon index ΓLAT = 4.10 ± 0.08, and normalization, Φ0 = 40.3 ± 1.8 × 10⁻⁹ TeV−1 cm−2 s−1, at a reference energy, E0 = 25 GeV; see Sect. 5.1) was used to produce the MC-expected signal and corresponding low-level parameters distributions, which were subsequently compared to measurements. The expected number of γ-ray events, NMC = 11697 ± 675, for which the error is evaluated using the statistical uncertainty on the Fermi-LAT flux normalization (see Sect. 4.1), compares well to the measured excess, NHESS = 9789 ± 789 (see Sect. 4.2). Although the deviation of 1908 ± 1038 events, corresponding to a ratio η = NHESS/NMC = 0.84 ± 0.08, is of low statistical significance (≲2σ), it can point to systematic errors in the CT5 effective area calculation and/or an offset between the energy scales of the two instruments (see Appendix B, below), and/or deviations of the intrinsic source spectrum from the assumed model. Regarding this point, varying the power-law model index, ΓLAT, from 3.86 to 4.55 (corresponding to variations of
  from 8 to 15 GeV; see Appendix B.2), implies values for η ranging from 0.80 to 0.91, respectively. Alternatively, using the power law with an exponential cut-off obtained from the fit to the Fermi-LAT data above 100 MeV (ECPL; see Table 3), yields η = 0.91 ± 0.09.
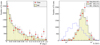 |
Fig. A.1. Distribution of the square of the angle between the source position and event direction (left), and distribution of the reconstructed energy (right) for data (excess events) and MC simulations. The latter have been weighted such as to represent the power law fitted to the Fermi-LAT data with index Γ = 4.1 and scaled by a factor η = 0.84 (see text). The light blue histogram on the right panel is the corresponding distribution for the generated true energy, Etrue, for MC events passing the analysis cuts. This distribution has an average energy of 31 GeV and peaks at ∼20 GeV: ∼40% of events lie below the latter energy, 34% are in the 10–20 GeV range, and 6% have an energy below 10 GeV. |
Measurements were compared further with MC simulations using low-level reconstructed parameters. Fig. A.1 shows the distribution of the square of the angle between the source position and event direction, θ2, and of the reconstructed energy, Erec, for excess events and for MC simulations, after scaling with η = 0.84. The agreement between expected and experimental distributions validates the overall analysis chain and the MC model of the instrument down to its threshold energy. The true-energy distribution of MC events passing the analysis cuts is shown in blue on the right panel of Fig. A.1. The distribution peaks at 20 GeV with an average energy of 31 GeV. It is noteworthy that ∼40% of events lie below the peak, out of which 15% have an energy <10 GeV. These figures do not change when considering events above  for the spectral derivation (see Sect. B.1). A significant overlap in energy range can thus be inferred between H.E.S.S. II in monoscopic mode and Fermi-LAT.
Appendix B: Systematic errors on spectral parameters
B.1. H.E.S.S. II systematic errors
Spectral measurements close to the trigger threshold of IACTs are challenging. One important limitation is related to the systematic uncertainties on the effective area near the threshold, mainly due to the lack of precise knowledge on the atmospheric transparency, regarding both its absolute value and its variations. While the former uncertainty is typically considered to lie within ±10%, and imply an error of the same magnitude on the absolute energy scale of the IACTs, one seeks to limit the latter by monitoring the atmospheric conditions during the data taking and by selecting data, accordingly. This process entails a tolerance (in terms of the degree of severity of the quality cuts) and leads in turn to systematic errors, especially close to the detection threshold. Fluctuations of the night sky background, as well as residual instrumental effects that are difficult to model precisely, add to the uncertainties on the effective area close to the threshold. This implies possible biases on the measurement of a given source spectrum, both for the absolute flux and the spectral index (e.g. for a power law). To limit these errors, a safe energy threshold cut is applied on the reconstructed energy,  . The cut value is determined using MC simulations of the spectral fitting process with manual introduction of errors in the IRFs, for example by scaling the effective area by error functions inferred from the variance of low-level parameters of background events (trigger rate and image charge distributions), recorded in similar conditions. Given that there is some degree of arbitrariness in this process, possible systematic effects due to the particular choice of the scaling function, and hence of
  , were investigated by testing different values of the latter (ranging from 20 to 45 GeV), including the case in which no such cut was applied. These tests have shown that systematic variations do not exceed the amplitude of statistical errors, i.e.
  and
and  , when
  is varied from no cut up to 45 GeV. The variation of the index as a function of
  could be assumed to result, at least partly, from the curvature of the P2 spectrum (as measured with Fermi-LAT, see Sect. 5.1 and Appendix B.2, below). However, because of the large bias and dispersion in the reconstructed energies near the threshold (leading to large migration of events from lower to higher energies), the cut on
  does not result in a sharp rise of the energy threshold; hence such an assumption has to be checked.
An alternative method consisting of applying a tighter cut on image intensities, Qmin = 60 p.e., that is two times larger than the standard cut (Cuts II, see Sect. 2.3), is better suited for this purpose. Given that image intensities are roughly proportional to the energy of γ-Rays, this implies a higher threshold,  . The spectral index obtained with this configuration, Γ = 5.05 ± 0.25, deviates strongly from the best-fit value of the standard analysis, Γ = 4.06 ± 0.16, with a significance level in excess of 3σ; we note that the errors of the two measurements, which share partially the same data, are correlated. The variation observed in the H.E.S.S. II data,
  , is consistent with that obtained with Fermi-LAT,
  , when its analysis threshold,
  , is increased from 10 to 20 GeV (see Sect. B.2). One can hence conclude with confidence that the smaller amplitude of the above-mentioned variation of the index with
  , should be mainly due to the curvature in the spectrum, rather than resulting from a systematic effect.
An estimate of the magnitude of possible systematic effects due to the uncertainty in the absolute value of the atmospheric transparency was obtained using a different extinction model. The test of a model with a 45% larger aerosol optical depth at 400 nm (from 10 km to the site altitude) resulted in a larger flux normalization,  , and a small change,
  , of the spectral index. We note, however, that the comparison of the Fermi-LAT and H.E.S.S. II-CT5 power-law fits makes it possible to constrain significantly this source of systematic error (see Sect. 6.1).
Investigation of systematic errors on the power-law best-fit values for the P2 spectrum in the range ∼10–110 GeV.
Further investigation of systematic effects was made by splitting the data in several ways. Fitting data sets I and II separately shows results that are compatible with each other and with the overall data set within statistical uncertainties (see Table B.1). Splitting the data in two zenith angle bands, however, i.e. below and above the median zenith angle of 23.7°, results in stable indices of  , but flux normalization deviations of
  , which are larger than statistical errors.
For the overall systematic error on the best-fit value of the spectral index we retain, conservatively,  . For the flux normalization, the quadratic combination of
  and
and  , i.e.
  , is used.
These errors are independent of statistical fluctuations and have been added quadratically to the 1σ statistical error contour of the overall data set in Fig. 4. Alternatively, the central error box in Fig. 5 represents the union of all 1σ statistical uncertainty confidence intervals obtained through the systematic error investigation procedure, including those computed for the higher threshold (Cuts II) analysis results. In addition, the error box has been extended such as to include the uncertainty of ±10% on the absolute energy scale.
B.2. Fermi-LAT systematic errors
The systematic errors on Fermi-LAT results were studied mainly in the overlapping energy range with H.E.S.S. II, i.e. above 10 GeV. One of the main sources of error is the uncertainty on the spectral models used for extended, bright, hard and nearby sources, i.e. the supernova remnants Vela Jr and Puppis A, the Vela X pulsar wind nebula, and the normalization of the Galactic diffuse emission model. Two extreme cases were modelled in which the flux normalization and spectral index of the above-mentioned sources were pushed to i) maximum flux normalization and hardest index and ii) minimum flux and softest index. These numbers were determined from statistical and systematic errors reported in the dedicated papers for Puppis A (Hewitt et al. 2012) and Vela Jr (Tanaka et al. 2011). For the Vela X nebula, the best-fit flux normalization was obtained through a dedicated off-pulse analysis in the restricted phase range [0.8–1.0] and using the same BPL definition as Grondin et al. (2013). We note that the normalization derived in this work (e.g. at the break energy of 2.1 GeV) is a factor 1.5 lower than that found in Grondin et al. (2013), while being very close to that of 3FGL catalogue. This is somewhat expected because the 3FGL catalogue was used as source model, but was not available in Grondin et al. (2013). In the study of systematic effects in the same paper, the deviation of the best-fit Galactic diffuse intensity for nearby source-free regions was shown to be ≤6%. Its normalization was conservatively modified by +10% and −10% in the two cases i) and ii), respectively. Comparison of the best-fit parameters for these extreme cases has shown that the spectral parameters for the two models used in Sect. 5.1, i.e. a power law and a log parabola (LPB), have no deviations beyond the statistical errors; that is a systematic error of  for the flux normalization and of
  for the index, which has no measurable effect on the curvature parameter of the LPB (becasue of its large statistical error, β = 0.7 ± 0.3). However, the confidence level for the LPB hypothesis, when tested against a simple power-law model, showed some variation, i.e. 3.1σ to 3.5σ for cases i) and ii), respectively. Checking the effect of each source model individually shows that the main contributor to these variations is the Galactic diffuse model normalization.
In addition, the effect of the uncertainties on the effective area were studied using modified IRFs, which can simulate instrument model deviations from the real instrument. The application of the effective area bracketing method2 resulted in differences of spectral parameters from best-fit values that were smaller than the estimates given for a soft source in Ackermann et al. (2012), i.e.  for the flux normalization and
  for the index. These values were consequently adopted as systematic errors for spectral measurements with the Fermi-LAT in this paper.
The most important source of uncertainty, when comparing H.E.S.S. II and Fermi-LAT results and assessing the significance of the LPB model as compared to the power-law hypothesis, is the LAT analysis energy threshold,  , which was initially set to 10 GeV. Testing
  values of 8, 12, 15, and 20 GeV, resulted in stable flux estimates, while the spectral index showed variation from
  at 8 GeV, to +0.45 ± 0.17 at 15 GeV, and +0.70 ± 0.30 for a threshold of 20 GeV. This behaviour is expected as well, given the possibly curved nature of the P2 spectrum at least up to ∼50 GeV (see Sect. 5.1 and Fig. 4). The significance of the LPB hypothesis also depends on the chosen threshold, varying from a very significant level, SLPB = + 7.3σ for
  GeV, down to only 1.9σ at 12 GeV, and falling below 1σ above 15 GeV.
It is clear that the above-mentioned variation of ΓLAT as a function of energy does not constitute a systematic error on the Fermi-LAT measurements themselves, but should be taken into account when it comes to compare them to H.E.S.S. II results, given the absence of calibration between the two instruments. In this respect, the uncertainty on the Fermi-LAT absolute energy scale, +2%/−5% (Ackermann et al. 2012), is to be considered as well.
Appendix C: Complementary tables
Fit parameters to the Fermi-LAT light curve for P1 and P3 as a function of energy.
List of >80 GeV photons in ascending phase value.
All Tables
Number of events, excess counts (Excess), and significance (Sig) derived from the H.E.S.S. II light curve for the four features of the Vela pulsar as defined by their phase intervals.
Best-fit parameters of an asymmetric Lorentzian model for the P2 peak, obtained from the Fermi-LAT and H.E.S.S. II data in different energy ranges, as part of a three-component function fit to the Vela pulsar light curve (see text).
Phase-averaged (PA) and phased-resolved spectra parameters for the Vela pulsar obtained with 96 months of Fermi-LAT data using the exponentially cut-off power-law hypothesis (ECPL) above 100 MeV, and a simple power law (PWL) for energies > 10 GeV.
Investigation of systematic errors on the power-law best-fit values for the P2 spectrum in the range ∼10–110 GeV.
Fit parameters to the Fermi-LAT light curve for P1 and P3 as a function of energy.
All Figures
|
Fig. 1. Left: effective area of H.E.S.S. II-CT5 in monoscopic mode as a function of energy for different zenith angles: the specific analysis used here has been developed to yield a large effective area near threshold, i.e. 2.6 × 10² m2 at 10 GeV and 20° zenith angle. There is a strong dependency of the effective area near the threshold on zenith angle, e.g. a drop of a factor ∼10 below 30 GeV when comparing 20° and 40° zenith angles. Right: distribution of (Erec − Etrue)/Etrue as a function of Etrue at 20° zenith for a power-law distribution between 5 and 120 GeV with index Γ = 4. The parameters Erec and Etrue stand for reconstructed and simulated energies, respectively. Error bars show the spread (RMS) of events around the average value. We note that bins are correlated. |
| In the text | |
|
Fig. 2. Left: γ-Ray phasogram of the Vela pulsar obtained using 40.3 h of H.E.S.S. II-CT5 data with the Cuts I analysis configuration (top panel) and 96 months of Fermi-LAT data above 10 and 20 GeV (bottom panel). The dashed line on the CT5 phasogram shows the level of the background estimated in the [0.7–1.0] phase range. Right: Gaussian-smoothed excess map (σ = 0.15°) for the CT5 data in the P2 phase range, where the on and off maps are made after selection of events in on- and off-phase intervals defined as [0.5–0.6] and [0.7–1.0], respectively. The black triangle indicates the position of the pulsar. |
| In the text | |
|
Fig. 3. γ-Ray phasogram of the Vela pulsar around P2 in the phase range [0.45,0.6], in different energy bands from 10 to 80 GeV, as obtained from the Fermi-LAT and H.E.S.S. II data. The red curve represents the asymmetric Lorentzian form fitted to data, except for the top-most panel where an additional Gaussian component is included in the fit to the H.E.S.S. II full energy range light curve (see Table 2). The background has been subtracted for the H.E.S.S. II light curves. The bin width for all histograms is 0.25 ms. |
| In the text | |
|
Fig. 4. Contours at one and two standard deviations shown for the fitted differential flux at 25 GeV, Φ0, and the power-law index, Γ for H.E.S.S. II data sets I, II, and their combination. The dashed curve shows the 1σ statistical contour for the overall data set combined quadratically with systematic errors, |
| In the text | |
|
Fig. 5. Spectral energy distribution of the second peak, P2, of the Vela pulsar. The fit to the Fermi-LAT data above 100 MeV is shown as a dark green curve and points in the main frame. Red indicates the error box in the 10–110 GeV energy range for the power-law fits to H.E.S.S. II data. It consists of the union of 1σ statistical uncertainty confidence intervals obtained through the systematic error investigation procedure, including results from both analysis configurations, Cuts I and II (see Appendix B.1). The lighter colour above 80 GeV corresponds to the range where the significance of detection is difficult to assess precisely (see text). The error box has been extended to include a ±10% systematic error on the absolute energy scale. An upper limit of 8% on the relative shift in the absolute energy scales of the two instruments can be inferred based on the excellent agreement between the indices obtained under the power-law hypothesis (PWL). The inset shows the PWL fit to the Fermi-LAT data in solid green, and the H.E.S.S. II best-fit power law as a dark red line. Both are extrapolated above 80 GeV by dashed lines only to ease readability. The favoured hypothesis is a power law with an exponential cut-off (ECPL; see Table 3). All upper limits are derived as 99.7% confidence intervals. |
| In the text | |
|
Fig. A.1. Distribution of the square of the angle between the source position and event direction (left), and distribution of the reconstructed energy (right) for data (excess events) and MC simulations. The latter have been weighted such as to represent the power law fitted to the Fermi-LAT data with index Γ = 4.1 and scaled by a factor η = 0.84 (see text). The light blue histogram on the right panel is the corresponding distribution for the generated true energy, Etrue, for MC events passing the analysis cuts. This distribution has an average energy of 31 GeV and peaks at ∼20 GeV: ∼40% of events lie below the latter energy, 34% are in the 10–20 GeV range, and 6% have an energy below 10 GeV. |
| In the text | |
Current usage metrics show cumulative count of Article Views (full-text article views including HTML views, PDF and ePub downloads, according to the available data) and Abstracts Views on Vision4Press platform.
Data correspond to usage on the plateform after 2015. The current usage metrics is available 48-96 hours after online publication and is updated daily on week days.
Initial download of the metrics may take a while.