Fig. 3.
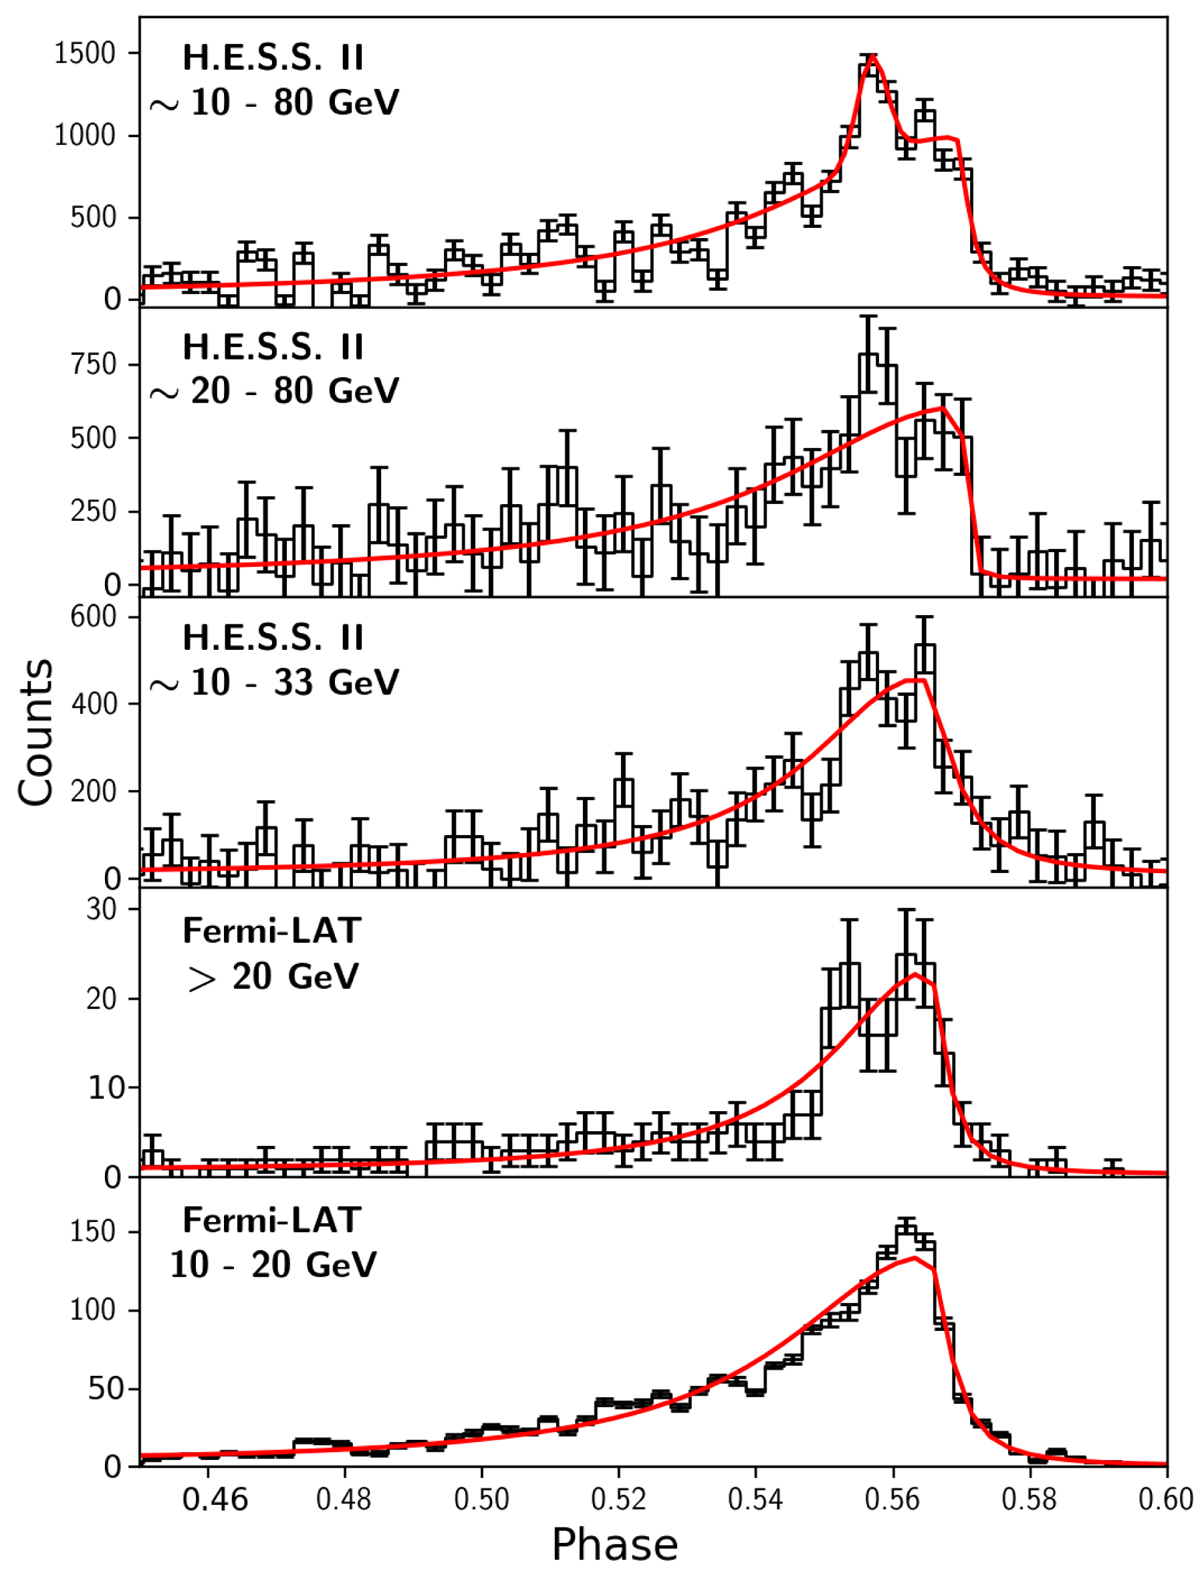
γ-Ray phasogram of the Vela pulsar around P2 in the phase range [0.45,0.6], in different energy bands from 10 to 80 GeV, as obtained from the Fermi-LAT and H.E.S.S. II data. The red curve represents the asymmetric Lorentzian form fitted to data, except for the top-most panel where an additional Gaussian component is included in the fit to the H.E.S.S. II full energy range light curve (see Table 2). The background has been subtracted for the H.E.S.S. II light curves. The bin width for all histograms is 0.25 ms.
Current usage metrics show cumulative count of Article Views (full-text article views including HTML views, PDF and ePub downloads, according to the available data) and Abstracts Views on Vision4Press platform.
Data correspond to usage on the plateform after 2015. The current usage metrics is available 48-96 hours after online publication and is updated daily on week days.
Initial download of the metrics may take a while.