Fig. 2.
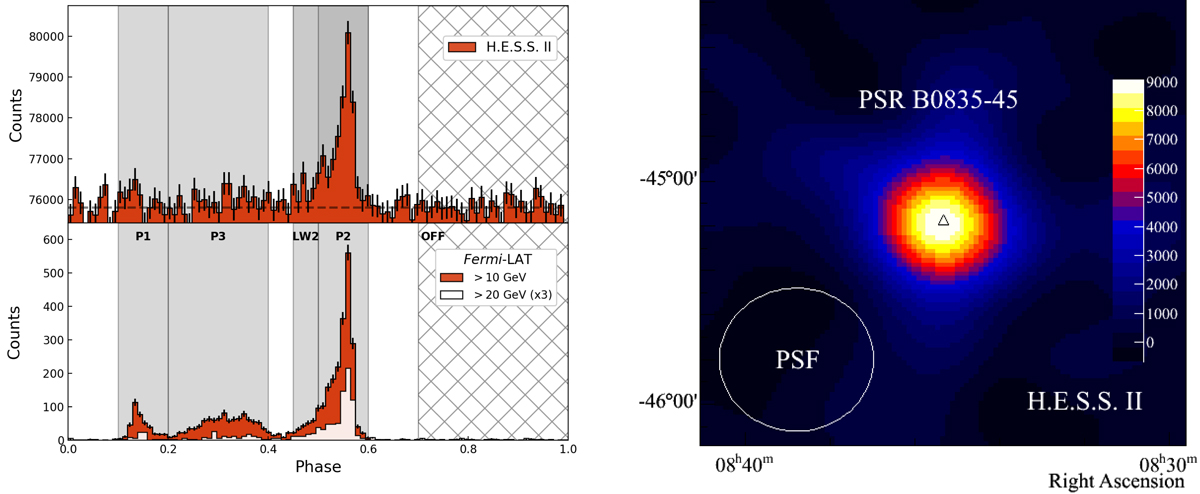
Left: γ-Ray phasogram of the Vela pulsar obtained using 40.3 h of H.E.S.S. II-CT5 data with the Cuts I analysis configuration (top panel) and 96 months of Fermi-LAT data above 10 and 20 GeV (bottom panel). The dashed line on the CT5 phasogram shows the level of the background estimated in the [0.7–1.0] phase range. Right: Gaussian-smoothed excess map (σ = 0.15°) for the CT5 data in the P2 phase range, where the on and off maps are made after selection of events in on- and off-phase intervals defined as [0.5–0.6] and [0.7–1.0], respectively. The black triangle indicates the position of the pulsar.
Current usage metrics show cumulative count of Article Views (full-text article views including HTML views, PDF and ePub downloads, according to the available data) and Abstracts Views on Vision4Press platform.
Data correspond to usage on the plateform after 2015. The current usage metrics is available 48-96 hours after online publication and is updated daily on week days.
Initial download of the metrics may take a while.