Fig. 4.
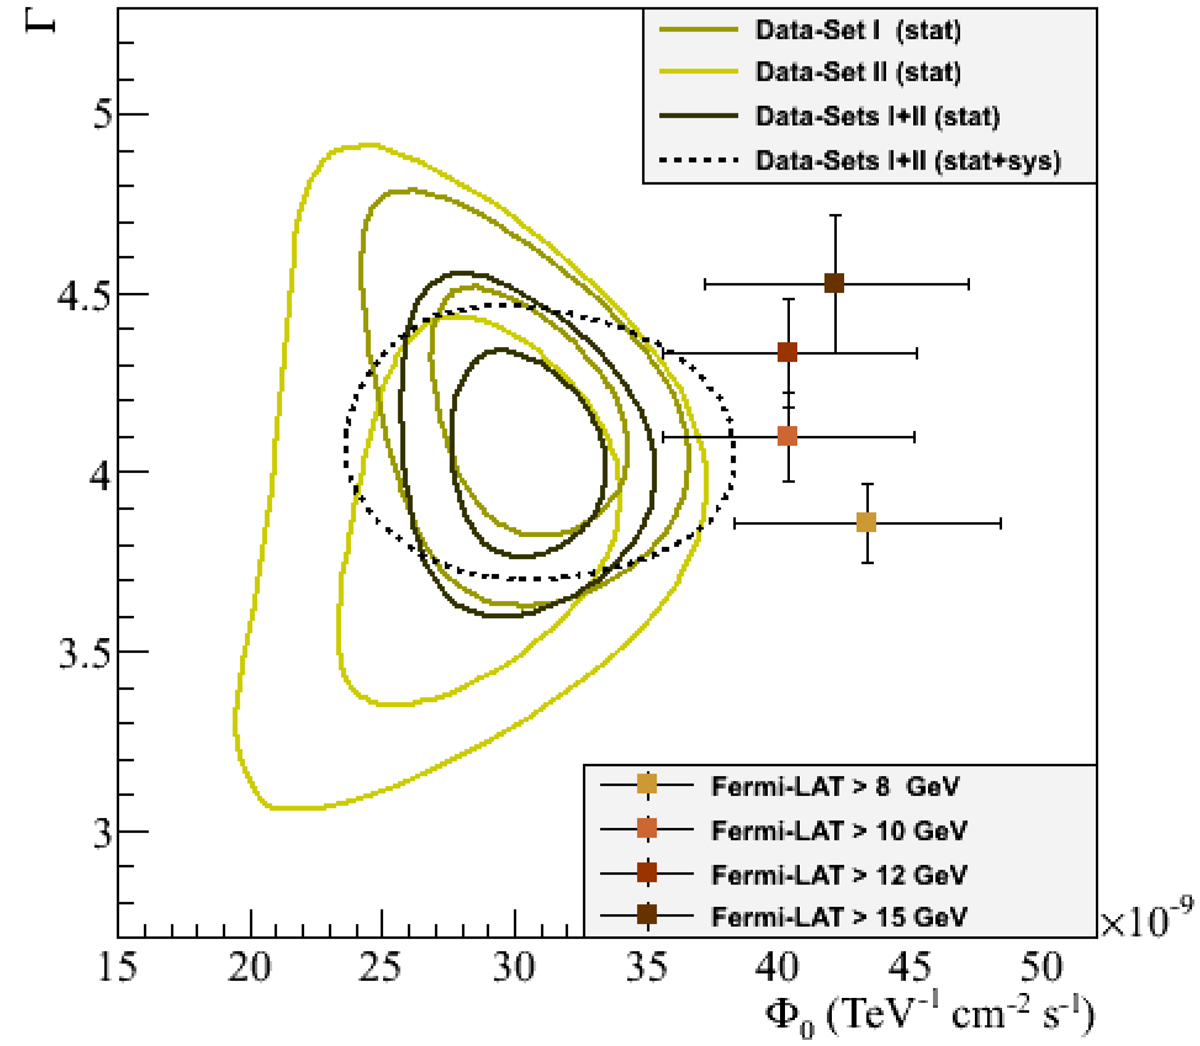
Contours at one and two standard deviations shown for the fitted differential flux at 25 GeV, Φ0, and the power-law index, Γ for H.E.S.S. II data sets I, II, and their combination. The dashed curve shows the 1σ statistical contour for the overall data set combined quadratically with systematic errors, ![]() . Best-fit values to Fermi-LAT data above
. Best-fit values to Fermi-LAT data above ![]() , 10, 12, and 15 GeV are shown as crosses including both statistical and systematic errors, combined quadratically as well. The systematic effects on the flux normalizations due to the uncertainty on absolute energy scale of H.E.S.S. II and of the Fermi-LAT are not included in the plot. An upper limit of 8% on the relative shift in the absolute energy scales of the two instruments can be inferred based on the deviation of the flux normalization values (see text). Spectral indices are compatible within errors for all thresholds; the best agreement is obtained for
, 10, 12, and 15 GeV are shown as crosses including both statistical and systematic errors, combined quadratically as well. The systematic effects on the flux normalizations due to the uncertainty on absolute energy scale of H.E.S.S. II and of the Fermi-LAT are not included in the plot. An upper limit of 8% on the relative shift in the absolute energy scales of the two instruments can be inferred based on the deviation of the flux normalization values (see text). Spectral indices are compatible within errors for all thresholds; the best agreement is obtained for ![]() .
.
Current usage metrics show cumulative count of Article Views (full-text article views including HTML views, PDF and ePub downloads, according to the available data) and Abstracts Views on Vision4Press platform.
Data correspond to usage on the plateform after 2015. The current usage metrics is available 48-96 hours after online publication and is updated daily on week days.
Initial download of the metrics may take a while.