| Issue |
A&A
Volume 619, November 2018
|
|
|---|---|---|
| Article Number | A152 | |
| Number of page(s) | 8 | |
| Section | Stellar atmospheres | |
| DOI | https://doi.org/10.1051/0004-6361/201834067 | |
| Published online | 19 November 2018 | |
Line shapes of the magnesium resonance lines in cool DZ white dwarf atmospheres⋆
1
GEPI, Observatoire de Paris, Université PSL, UMR 8111, CNRS, 61 Avenue de l’Observatoire, 75014
Paris, France
e-mail: This email address is being protected from spambots. You need JavaScript enabled to view it.
2
Sorbonne Université, CNRS, UMR7095, Institut d’Astrophysique de Paris, 98bis Boulevard Arago, Paris, France
3
Department of Physics and Astronomy, University of Louisville, Louisville, KY, 40292
USA
4
Département de physique, Université de Montréal, Montréal, Québec, H3C 3J7
Canada
5
Laboratoire de Physique et Chimie Quantique, UMR 5626, Université de Toulouse (UPS) and CNRS, 118 route de Narbonne, 31400
Toulouse, France
6
Laboratoire Interdisciplinaire Carnot de Bourgogne, UMR6303, CNRS, Université de Bourgogne Franche Comté, 21078
Dijon Cedex, France
Received:
10
August
2018
Accepted:
26
August
2018
Abstract
Context. Line shapes of the magnesium resonance lines in white dwarf spectra are determined by the properties of magnesium atoms and the structure of the white dwarf atmosphere. Through their blanketing effect, these lines have a dominant influence on the model structure and thus on the determination from the spectra of other physical parameters that describe the stellar atmosphere and elemental abundances.
Aims. In continuation of previous work on Mg+He lines in the UV, we present theoretical profiles of the resonance line of neutral Mg perturbed by He at the extreme density conditions found in the cool largely transparent atmosphere of DZ white dwarfs.
Methods. We accurately determined the broadening of Mg by He in a unified theory of collisional line profiles using ab initio calculations of MgHe potential energies and transition matrix elements among the singlet electronic states that are involved for the observable spectral lines.
Results. We computed the shapes and line parameters of the Mg lines and studied their dependence on helium densities and temperatures. We present results over the full range of temperatures from 4000 to 12 000 K needed for input to stellar spectra models. Atmosphere models were constructed for a range of effective temperatures and surface gravities typical for cool DZ white dwarfs. We present synthetic spectra tracing the behavior of the Mg resonance line profiles under the low temperatures and high gas pressures prevalent in these atmospheres.
Conclusions. The determination of accurate opacity data of magnesium resonance lines together with an improved atmosphere model code lead to a good fit of cool DZ white dwarf stars. The broadening of spectral lines by helium needs to be understood to accurately determine the H/He and Mg/He abundance ratio in DZ white dwarf atmospheres. We emphasize that no free potential parameters or ad hoc adjustments were used to calculate the line profiles.
Key words: line: profiles / white dwarfs / line: formation / atomic processes / stars: individual: L 119-34
Tables of broadening functions are only available at the CDS via anonymous ftp to cdsarc.u-strasbg.fr (130.79.128.5) or via http://cdsarc.u-strasbg.fr/viz-bin/qcat?J/A+A/619/A152
© ESO 2018
 Open Access article, published by EDP Sciences, under the terms of the Creative Commons Attribution License (http://creativecommons.org/licenses/by/4.0), which permits unrestricted use, distribution, and reproduction in any medium, provided the original work is properly cited.
1. Introduction
The UV spectra of cool DZ white dwarfs, which are rich in helium, show the resonance lines of Mg at 2852 Å and Mg+ at 2796/2803 Å. An example in Fig. 1 shows the ion and neutral lines in a spectrum of L 745-46A. The resonance-broadened wings extend and decrease monotonically very far on the red long-wavelength side of line center. Their blue wings, however, show “satellite bands”, features that are due to the absorption of radiation during the Mg–He and Mg+–He collisions, which are close to 2750 Å and 2300 Å for the neutral atom and the ion, respectively. The aim of this study is to clarify the contribution of each of these two lines in their far wings to stellar opacity.
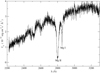 |
Fig. 1. Ultraviolet spectrum of the DZ white dwarf L 745-46A. The distinctive resonance lines of Mg at 2852 Å and Mg+ at 2796/2803 Å are clearly visible (Shipman 1990). |
Blouin et al. (2018) have now developed an improved atmosphere model code to accurately describe cool DZ white dwarfs taking into account non-ideal high-density effects arising at the photosphere. The line profiles of the resonance lines of Mg+ (Allard et al. 2016b) and neutral Mg described in this paper have been included. Figure 2 shows a typical pressure structure for a helium-rich white dwarf at T eff = 6000K, in which the helium density can reach 1022 cm−3. In these physical conditions, the emitting atoms can experience multiple simultaneous energetic perturbations from the surrounding helium atoms. Recently, Reggami & Bouledroua (2011) calculated the collisional broadening of Mg for low helium density in the wavelength range from 2600 to 3100 Å and for a temperature range from 100 to 3000 K. The higher temperature of white dwarfs makes the close collisions more likely, which are affected by short-range atomic interactions, while the higher density increases the probability of all collisions and their effects on the spectral line shape compared to, for example, Doppler broadening.
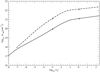 |
Fig. 2. He density as a function of Rosseland mean optical depth assuming atmospheric parameters used in synthetic spectra studied in Sect. 4.2. T eff = 8000 K (full line), log Ca/He = −9, log Mg/He = −7.3, log H/He = −3.5. T eff = 6000 K (dashed line), log Ca/He = −10.5, log Mg/He = −7.3, and log H/He = −3.5. |
Since our review paper 36 years ago (Allard & Kielkopf 1982), considerable progress in unified line broadening theory and in computational technology now enables us to calculate neutral atom spectra given the potential energies and radiative transition moments for relevant states of the radiating atom interacting with other atoms in its environment. Although our unified theory has been developed in Allard et al. (1999), and a detailed discussion is presented there, we provide an overview Sect. 2 for its use in this context. Because the underpinning atomic physics is understood, theoretical models may be drastically improved compared to previous work such as Koester & Wolff (2000) and Wolff et al. (2002) by including a more complete representation of the interactions, especially in the region of atomic separations that determine the line wings. Nevertheless, the main limitation remains a lack of precision in theoretical fundamental atomic interaction data suitable for such spectroscopic calculations. In a field where most work focuses on lower precision for use in chemistry and reaction kinetics, it is fortunate that Mg–He and Mg+–He molecular data are now very well studied and have accurate asymptotic energies available. The potentials we use are described in detail in Sect. 3. In Sect. 4.1 we examine the far wings quantitatively for the MgHe and Mg+He lines, which both contribute to the ultraviolet spectra. We present line profiles obtained over the full range of temperatures from 4000 to 12 000 K for helium densities varying from 1021 to 1022 cm−3. In Sect. 4.2 we study the relative contribution of the two resonance lines in their far wings and how they can contribute to the line blanketing. At sufficiently low densities of perturbers, the symmetric center of a spectral line is Lorentzian and can be defined by two line parameters, the width and the shift of the main line. The impact approximation determines the asymptotic behavior of the unified line shape autocorrelation function. The Lorentzian width can be readily extracted, and is presented in Sect. 4.3. Finally, we report the study of WD 2216–657 in Sect. 5.
2. General expression for the spectrum in an adiabatic representation
In a unified treatment, the complete spectral energy distribution is computed from the core to the far line wing. The semiclassical methods used by Sando & Wormhoudt (1973) were generalized to apply to the entire profile in the unified Franck-Condon theory of Szudy & Baylis (1975). This method has been widely used for the analysis of experiments on line broadening (Allard & Kielkopf 1982). Its simplicity derives from a neglect, in the line wing, of multiple close collisions and non-adiabatic effects, and from the use of a cubic expansion of the phase shift of the WKB wavefunctions. The profiles computed with this approach provide a unified expression from the line core to the wing. However, in the satellite region of the line wing, the results are only valid when densities are so low that the probability of close collisions of more than two atoms is negligibly small.
With n
He densities above 1021 cm−3 for Ross 640 (Blouin et al. 2018), reaching 2 × 1022 cm−3 for vMa2 (Dufour, priv. comm.), multiple perturber effects have to be taken into account. Each one of these white dwarfs constitutes a very interesting case study. In dense plasmas, as in these very cool DZ white dwarfs, a reliable determination of the line profiles that is applicable in all parts of the line at all densities is the Anderson semi-classical theory (Anderson 1952), which uses the Fourier transform of an autocorrelation function. A unified theory of spectral line broadening (Allard et al. 1999) has been developed to calculate neutral atom spectra given the interaction and the radiative transition moments of relevant states of the radiating atom with other atoms in its environment. Our approach is based on the quantum theory of spectral line shapes of Baranger (1958a, b) developed in an adiabatic representation to include the degeneracy of atomic levels Royer (1974, 1980); Allard et al. (1994). The spectrum I(Δω) can be written as the Fourier transform (FT) of the dipole autocorrelation function Φ(s), (1)
(1)
where s is time. The FT in Eq. (1) is taken such that I(Δω) is normalized to unity when integrated over all frequencies, and Δω is measured relative to the unperturbed line. A pairwise additive assumption allows us to calculate the total profile I(Δω) where all the perturbers interact as the FT of the Nth power of the autocorrelation function ϕ(s) of a unique atom-perturber pair. Therefore (2)
(2)
That is to say, we neglect the interperturber correlations. The radiator can interact with several perturbers simultaneously, but the perturbers do not interact with each other. This is what Royer (1980) calls the totally uncorrelated perturbers approximation. The fundamental result expressing the autocorrelation function for many perturbers in terms of a single perturber quantity g(s) was first obtained by Anderson (1952) and Baranger (1958b) in the classical and quantum cases, respectively. From the point of view of a general classical theory, the solution to the Anderson (1952) model corresponds to the first-order approximation in the gas density obtained by the cumulant expansion method (Royer 1972). The higher-order terms representing correlations between the perturbers are neglected since they are extremely complicated (Royer 1972; Kubo 1962a, b; Kampen 1974). We obtain for a perturber density n
p
 (3)
(3)
The decay of the autocorrelation function Φ(s) with time s leads to atomic line broadening. It depends on the density of perturbing atoms n
p and on their interaction with the radiating atom. The molecular potentials and radiative dipole transition moments are input data for a unified spectral line shape evaluation. The dipole autocorrelation function Φ(s) is evaluated for a classical collision path with an average over all possible collisions. For a transition α = (i, f) from an initial state i to a final state f, we have![Mathematical equation: $$ \begin{aligned} {g}_{\alpha }(s)&= \frac{1}{\sum _{e,e{^{\prime }}} \, \! ^{(\alpha )} \, |d_{ee{^{\prime }}}|^2 } \sum _{e,e{^{\prime }}} \, \! ^{(\alpha )} \; \; \nonumber \\&\int ^{+\infty }_{0}\!\!2\pi b\,{\mathrm{d}}b \int ^{+\infty }_{-\infty }\!\! {\mathrm{d}}x \; \tilde{d}_{ee{^{\prime }}}[R(0)] \, \nonumber \\&[{\mathrm{e}}^{\frac{i}{\hbar }\int ^s_0 \!\! {\mathrm{d}}t \, V_{e{^{\prime }} e }[R(t)] } \, \, \tilde{d^{*}}_{ee{^{\prime }}}[R(s)] - \tilde{d}_{ee{^{\prime }}} [R(0)]]. \end{aligned} $$](/articles/aa/full_html/2018/11/aa34067-18/aa34067-18-eq4.gif) (4)
(4)
In Eq. (4), e and e′ label the energy surfaces on which the interacting atoms approach the initial and final atomic states of the transition as R → ∞. The sum  is over all pairs (e,e′) such that ω
e′,e
(R)→ω
α
as R → ∞. We define
is over all pairs (e,e′) such that ω
e′,e
(R)→ω
α
as R → ∞. We define  as a modulated dipole (Allard et al. 1999)
![Mathematical equation: $$ \begin{aligned} D(R) \equiv \tilde{d}_{ee{^{\prime }}}[R(t)] = d_{ee{^{\prime }}}[R(t)]\mathrm{e}^{-\frac{\beta }{2}V_{e}[R(t)] } \; , \; \end{aligned} $$](/articles/aa/full_html/2018/11/aa34067-18/aa34067-18-eq7.gif) (5)
(5)
where β is the inverse temperature (1/k
T). Here V
e
is the ground-state potential when we consider absorption profiles, or an excited state for the calculation of a profile in emission. Over regions where V
e
(r)< 0, the factor e−β
V
e
(r) accounts for bound states of the radiator–perturber pair, but in a classical approximation wherein the discrete bound states are replaced by a continuum; thus any band structure is smeared out. We have for the phase term in Eq. (4)![Mathematical equation: $$ \begin{aligned} \eta (s)= \frac{i}{\hbar }\int ^s_0 \, \mathrm{d}t \; V_{e{^{\prime }} e}[R(t)] , \end{aligned} $$](/articles/aa/full_html/2018/11/aa34067-18/aa34067-18-eq8.gif) (6)
(6)
where ΔV(R), the difference potential, is given by![Mathematical equation: $$ \begin{aligned} \Delta V(R) \equiv V_{e{^{\prime }} e}[R(t)] = V_{e{^{\prime }}}[R(t)] - V_{e}[R(t)], \end{aligned} $$](/articles/aa/full_html/2018/11/aa34067-18/aa34067-18-eq9.gif) (7)
(7)
and represents the difference between the electronic energies of the quasimolecular transition. The potential energy for a state e is![Mathematical equation: $$ \begin{aligned} V_{e}[R(t)] = E_e[ R(t) ]-E_e^{\infty }. \end{aligned} $$](/articles/aa/full_html/2018/11/aa34067-18/aa34067-18-eq10.gif) (8)
(8)
At time t from the point of closest approach![Mathematical equation: $$ \begin{aligned} R(t) = \left[\rho ^2 + (x+\bar{{v}} t)^2 \right]^{1/2}, \end{aligned} $$](/articles/aa/full_html/2018/11/aa34067-18/aa34067-18-eq11.gif) (9)
(9)
with ρ the impact parameter of the perturber trajectory and x the position of the perturber along its trajectory at time t = 0.
3. MgHe diatomic potentials
Paul-Kwiek & Czuchaj (1998) obtained adiabatic potential curves of MgHe obtained by means of pseudo-potentials, l -dependent core polarisation potential (CPP) and single- and double-configuration interaction (SDCI) techniques. The semi-empirical Hartree Fock Damped dispersion ansatz (HFD) methods have been used in Reho et al. (2000) and accurate ab initio calculations for the Mg–He and Ca–He van der Waals potential energy curves of the ground state have been presented in Hinde (2003). Mella et al. (2005) presented ab initio calculations for Mg–He focused on solvation effects of Mg in He clusters.
The most recent calculations of Mg–He singlet potential energies have been achieved by Alekseev (2014) 1, but in a limited range, R ∼ 2.5–20 au, where R denotes the internuclear distance between the radiator and the perturber. The ab initio potentials computed with MOLCAS (Aquilante & De Vico 2010) are described in Hollands et al. (2017).
The potentials we used were computed by ab initio approaches with the MOLPRO package (Werner et al. 2012). As for the triplet states (Allard et al. 2016a), a pseudo-potential with large core was used for Mg (Fuentealba et al. 1983), and core valence correlation effects were taken into account with the operatorial CPP. A large basis set (10s, 9p, 6d, 3f,3g) was optimized for Mg, starting from one involving quite high Rydberg states (Khemiri et al. 2013), together with the rather large He one of Deguilhem et al. (2009). MRCI calculations, with single and double excitations, were performed after a CASSCF with four electrons in six orbitals (CAS 4,6) to obtain both the energies and the transitions dipole moments. A dense grid of internuclear distances has been considered, ranging between 4 and 500 au, in order to cover a broad range from dissociation to the shortest distances that are energetically accessible.
The line profile depends only on the two individual transitions 3s X 1Σ → 3p B 1Σ and 3s X1Σ → 3p A1Π. Figure 3 shows the potentials for the X, A, and B states and the transition dipole moment for the B − X and A − X transitions. For Mg+–He, we used the recent ab initio calculations presented in Allard et al. (2016b).
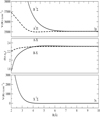 |
Fig. 3. Potential energies for the X, A, and B states of the Mg–He molecule. 3s X1Σ (full line), 3p B 1Σ (full line), 3p A1Π (dashed line), and transition dipole moments B − X (full line), A − X (dashed line). |
In the next section, we evaluate collisional profiles for relevant temperatures and densities that are appropriate for modeling He-rich white dwarf stars.
4. Temperature and density dependence of the Mg lines
Figure 2 shows a typical pressure structure corresponding to the synthetic spectra studied in Sect. 4.2. This was obtained with the atmosphere model code described in Blouin et al. (2018).
4.1. Study of the line wings
The prediction of the shape of the 3s → 3p line requires studying the potential energy difference ΔV(R) in Eq. (7). The unified theory predicts that line satellites will be centered periodically at frequencies corresponding to integer multiples of the extrema of ΔV. Figure 4 shows ΔV(R) for the 3s X1Σ → 3p B1Σ transition, which leads to the formation of satellites on the Mg resonance line. The maximum in ΔV in this case occurs at larger internuclear distances (R ∼ 2.5 Å) than for the Mg+–He molecule. As a consequence, the average number of perturbers in the interaction volume is larger, leading to a higher probability of multiple pertuber effects, and making a second satellite strong enough to appear distinctly as a shoulder in Fig. 5. When the density reaches 5 × 1021 cm−3, the shoulder completely blends with the first line satellite seen in Fig. 6. We have known for a long time, since the pioneering work of McCartan & Hindmarsh (1969), that multiple satellites can be observed experimentally at very high densities. A definitive observation of multiple perturber satellites was reported in Kielkopf & Allard (1979), and the effects have been seen in many cases since then.
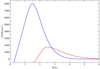 |
Fig. 4. ΔV for the B − X transition of the MgHe line (red curve), compared to the Mg+He line (blue curve), see Fig. 4 of Allard et al. (2016b). |
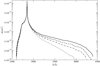 |
Fig. 5. Variation of the MgHe line profile with temperature (from top to bottom, T = 12 000, 8000, 6000, and 4000 K) for n He = 1021 cm−3. |
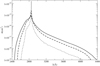 |
Fig. 6. Theoretical absorption cross-sections of the MgHe line. The density of the perturbers is n He = 1022, 5 × 10²¹ and 1021 cm−3, from top to bottom. The temperature is 6000 K. |
Collisional line profiles are evaluated for n He = 1 × 1021 cm−3 from 4000 to 12 000 K. Furthermore, the change of radiative transition moment D(R) in Eq. (5) with atomic separation has a significant effect on the line wing extension according to the effective temperatures. These effects have heretofore not been studied in UV spectra of cool white dwarfs using accurate molecular data. The blue line wings shown in (Fig. 5) are almost unchanged with increasing temperature, whereas the red wings extended very far.
Reggami & Bouledroua (2011) analyzed the line satellite structure quantum-mechanically. They constructed two different sets of potentials. In their Set 1 they used data of Hinde (2003) for the ground state and Mella et al. (2005) and Reho et al. (2000) for the excited states. In their Set 2 they used Paul-Kwiek & Czuchaj (1998) data. On the blue side they obtained satellite structure for T > 1800 K, located around 2760 Å when Set 1 is used. This satellite position is close to ours. For the other set of potentials the position of the satellite is around 2720 Å, and the comparison in Figs. 5 and 6 stresses the importance of accurately determining the atomic interaction potentials when the far wings of these lines are to be evaluated.
4.2. Blanketing effects of the Mg lines
For the Mg–He pair, the maximum ΔVmax is smaller, 1756 cm−1 versus 8100 cm−1 for the Mg+–He pair (Fig. 4). The MgHe line satellite is then closer to the main line than the Mg+He satellite, as shown in Figs. 7 and 9. For a helium density > 5 × 1021 cm−3, the red wings have a shoulder-like structure, and the satellite structures become less prominent. The blue wings fall off very rapidly.
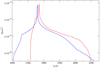 |
Fig. 7. Comparison of the MgHe line (red line) to the sum of the two components of the Mg+He line (blue line) (T = 8000 K and n He = 2 × 1021 cm−3). |
Using the stellar atmosphere code of Blouin et al. (2018), we constructed atmosphere models for a range of effective temperatures and surface gravities typical for cool DZ white dwarfs. We present synthetic spectra tracing the behavior of the Mg resonance line profiles under the low temperatures and high gas pressures prevalent in these atmospheres. Figures 8 and 10 show the relative contributions of the MgI and MgII lines to the synthetic spectra at T eff = 8000 and 6000 K, respectively. They stress the importance of accurately determining line profile calculations to evaluate the far wings of these lines. The red wing of the MgI and MgII lines extends over 1000 Å until the CaII H/K lines at 6000 K. The contribution of the blanketing on the red and blue sides is mostly due to MgII lines, since most Mg is ionized at the photosphere of the models shown in Figs. 8 and 10.
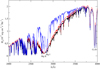 |
Fig. 8. Synthetic spectrum computed at T eff = 8000 K, log Ca/He = −9, log Fe/He = −8.4, log Mg/He = −7.3, and log H/He = −3.5, compared to synthetic spectra computed without the MgII (in blue) and the MgI (in red) line opacity. |
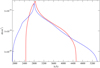 |
Fig. 9. Comparison of the MgHe line (red line) to the sum of the two components of the Mg+He line (blue line). T = 6000 K and n He = 1 × 1022 cm−3. |
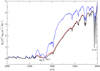 |
Fig. 10. Synthetic spectrum computed at T eff = 6000 K, log Ca/He = −10.5, log Fe/He = −9.3, log Mg/He = −9.2, and log H/He = −3.5, compared to synthetic spectra computed without the MgII (in blue) and the MgI (in red) line opacity. |
4.3. Study of the line parameters
Since in a model atmosphere calculation the resulting line profile is the integration of the flux in all layers from the deepest to the uppermost, it is also important that the line centers be adequately represented. This means that they can be non-Lorentzian at the high densities of the innermost layers and Lorentzian in the upper atmosphere, but with different widths than predicted by the inadequate hydrogenic van der Waals approximation that is generally used for the long-range interaction to calculate line cores.
The impact approximation is widely used to describe the central region of pressure-broadened spectral lines at low densities. The impact theories of pressure broadening (Baranger 1958b; Kolb & Griem 1958) are based on the assumption of sudden collisions (impacts) between the radiator and perturbing atoms, and they are valid when frequency displacements Δω = ω − ω 0 and gas densities are sufficiently small. In impact broadening, the duration of the collision is assumed to be small compared to the interval between collisions, and the results describe the line within a few line widths of the center. One outcome of our unified approach is that we may evaluate the difference between the impact limit and the general unified profile, and establish with certainty the region of validity of an assumed Lorentzian profile. The line parameters of the Lorentzian can be obtained in the impact limit (s → ∞) of the general calculation of the autocorrelation function (Eq. (4)). The phase shifts are then given by Eq. (6) with the integral taken between s = 0 and ∞. In this way, the results described here are applicable to a more general line profile and opacity evaluation for the same perturbers at any given layer in the photosphere.
In the upper atmosphere of the cool white dwarfs under consideration, the helium atom density is on the order of 1021 cm−3 in the region of line core formation. As the line satellites are well separated from the main line, we can check that the impact approximation is still good at this density, with the understanding that it will not give a correct line wing (Fig. 11).
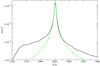 |
Fig. 11. Theoretical absorption cross-sections of the Mg line compared to the Lorentzian profile (green dashed line) obtained in the impact approximation. The density of the perturbers is n He = 1021 cm−3. The temperature is 8000 K. |
This was also true for the H and K lines of the resonance lines of CaII (Fig. 2 of Allard & Alekseev (2014)). When line satellites are close to the parent line, as they are for the 3s-2p line in He2 (Allard et al. 2013) or the Mg b triplet (Allard et al. 2016a), the situation changes drastically and leads to a complex behavior of the dependence of the line shape, and to the conventional line width and shift parameters on He density.
The broadening of the core of Mg lines by helium collisions has never been measured in the laboratory, but other theoretical data have been obtained by Reggami & Bouledroua (2011) and Bottcher et al. (1975). We report in Fig. 12 the values given in Table 8 of Reggami & Bouledroua (2011). They agree very well with the semi-classical calculations obtained using the MRCI potentials. To predict the impact parameters, the intermediate and long-range part of the potential energies need to be accurately determined. The absence of a long-range part of the potentials in MOLCAS data of Alekseev (2014) leads to systematically lower values of the full-width at half-maximum (FWHM).
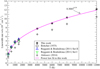 |
Fig. 12. Variation with temperature of the FWHM of the resonance lines of Mg perturbed by He collisions. Bottcher et al. (1975), circle), Reggami & Bouledroua (2011) Set I (green downward-pointing triangle), Reggami & Bouledroua (2011) Set II (blue upward-pointing triangle), Alekseev (2014; see footnote) (plus), this work (star), and a power-law fit (magenta line). The rates are in units of 10−9 s−1 cm−3. |
The dependence of the impact line width on temperature is presented in Fig. 12. The FWHM w is linearly dependent on the He density, and a power law in temperature given by (10)(w is in s−1, n
He in cm−3, and T in K) accurately represents the numerical results as shown in Fig. 12.
(10)(w is in s−1, n
He in cm−3, and T in K) accurately represents the numerical results as shown in Fig. 12.
5. Astrophysical application to WD 2216–657
To test our improved line profiles, we examined the WD 2216–657 (LP 119-34), a DZ star with broad Mg II resonance lines. For our analysis, we used the Gaia DR2 parallax measurement of this object (Gaia Collaboration 2018; Prusti et al. 2016), the V R I and J H K S photometry reported in Subasavage et al. (2017), the visible spectrum obtained by Subasavage et al. (2017), and the International Ultraviolet Explorer (IUE) spectra (Weidemann & Koester 1989; Zeidler-KT et al. 1986).
To fit WD 2216–657, we used the atmosphere code described in Blouin et al. (2018) and the fitting procedure outlined in Dufour et al. (2007). The solid angle, the effective temperature, and the Ca/He abundance ratio were fit simultaneously to the visible spectroscopy, the UV spectroscopy, and the photometry using a χ 2 minimization method. The abundance ratio between the different heavy elements was kept constant during the minimization procedure, but we manually adjusted the abundance of C, Fe, and Mg to fit the many spectral lines found in both the UV and the visible spectra. The surface gravity logg was obtained from the solid angle and the parallax measurement.
Figure 13 shows our best spectroscopic and photometric fit of this object. Our solution is in perfect agreement with the photometric observations and nicely reproduces the C I, Fe II, Mg I, Mg II, and Si I features. Our fitting parameters, given in the bottom panel of Fig. 13, are in close agreement with those previously found by Wolff et al. (2002) (T
eff = 9200 ± 300 K, log C/He = −6.0 ± 0.5, log Ca/He = −9.1, log Fe/He = −7.95 ± 0.70 and log Mg/He = −6.8 ± 0.7). We note, however, that Wolff et al. (2002) concluded that WD 2216–657 has hydrogen in its atmosphere, with  . They reached this conclusion because they needed to include opacity from Lyα broadening to explain the shape of the blue part of the IUE spectrum. As our hydrogen-free models are able to properly reproduce the shorter wavelength part of the IUE spectrum, hydrogen is superfluous for our analysis, and we therefore assume that WD 2216–657 has a hydrogen-free atmosphere. In any case, due to the non-visibility of Hβ, a hydrogen abundance above log H/He ≈ −4.5 is incompatible with the visible spectrum of WD 2216–657.
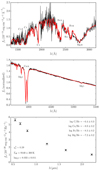 |
Fig. 13. Our best photometric and spectroscopic fit of WD 2216–657. |
Other studies (Subasavage et al. 2008, 2017; Weidemann & Koester 1989) have concluded that WD 2216–657 is hotter than what our results suggest (they found Teff = 10610 ± 570 K, 9770 ± 660 K, and 9600 ± 400 K). However, we found that while effective temperatures above Teff = 9400 K are compatible with the photometric observations, they are rejected by the relative intensities of the Mg I and Mg II lines. In particular, at an effective temperature above 9400 K, the magnesium abundance required to fit the Mg I and Mg II spectral lines implies that the Mg II 4481 line should be visible. As this line is not seen in the visible spectrum, we conclude that the effective temperature of WD 2216–657 must be cooler than 9400 K.
For the purpose of this work, the most important aspect of our analysis of WD 2216–657 is certainly our fit to the Mg II resonance lines. The previous detailed analysis of these lines (Zeidler-KT et al. 1986) had two important problems. First, the Mg abundance obtained from the visible spectrum (log Mg/He = −7.7) was not compatible with the Mg abundance required to fit the Mg II resonance lines (log Mg/He = −6.7). Moreover, Zeidler-KT et al. (1986) were unable to simultaneously fit the core and the wings of the Mg II resonance lines, which indicates a problem with the broadening mechanism assumed for these lines. They attempted to solve this problem by multiplying the van der Waals broadening constant of these lines by an arbitrary factor, but this was still insufficient to remove the core-wings discrepancy. Thanks to our improved line profiles, our analysis of WD 2216–657 is not affected by any of these two problems. The Mg/He abundance ratio that we find is compatible with both the visible and the UV spectra, and our fit to the Mg II resonance lines is compatible with both the core and the wings.
6. Conclusion
We have performed theoretical calculations of the collisional profiles of the resonance lines of Mg and Mg+ perturbed by a hot dense helium plasma using a unified theory of spectral line broadening and high-quality ab initio potentials. While laser-produced plasmas approach the conditions of white dwarf atmospheres, they are transient and difficult to diagnose. Experimental laboratory tests are being done to determine whether traditional precision experiments in an environment necessarily at lower density and temperature than in a white dwarf star can verify the potentials through measurements of the wings and line core broadening in absorption spectra in the accessible ultraviolet and visible regions. The good fit of spectra of Ross 640 and LP 658-2 acquired with the Faint Object Spectrograph on board the Hubble Space Telescope, which was obtained by Blouin et al. (2018), also confirms our opacity data. The spectra reported here are computed with methods that have a long history of validation both in astrophysical and laboratory applications. It is particularly significant that no parameters are adjusted adjusted ad hoc, and that the results are soundly based on first principles used in the underpinning atomic physics and atmosphere codes, enabled by expertise in their use.
Acknowledgments
One of us (NFA) would like to acknowledge V. Alekseev for kindly providing the Mg–He molecular potentials and dipole moments before publication. The authors thank the referee for helpful comments and suggestions that have improved the clarity of the paper. This work used observations made with the NASA/ESA Hubble Space Telescope, and obtained from the Hubble Legacy Archive, which is a collaboration between the Space Telescope Science Institute (STScI/NASA), the Space Telescope European Coordinating Facility (STECF/ESA) and the Canadian Astronomy Data Centre (CADC/NRC/CSA). Support for MAST for non-HST data is provided by the NASA Office of Space Science via grant NNX09AF08G and by other grants and contracts. This work has made use of data from the European Space Agency (ESA) mission Gaia (https://www.cosmos.esa.int/gaia), processed by the Gaia Data Processing and Analysis Consortium (DPAC, https://www.cosmos.esa.int/web/gaia/dpac/consortium). Funding for the DPAC has been provided by national institutions, in particular the institutions participating in the Gaia Multilateral Agreement. This work has made use of the Montreal White Dwarf Database (Dufour et al. 2017).
References
- Alekseev, V. A. 2014, Research Gate Website [Google Scholar]
- Allard, N. F., & Alekseev, V. A. 2014, Adv. Space Res., 54, 1248 [NASA ADS] [CrossRef] [Google Scholar]
- Allard, N. F., & Kielkopf, J. F. 1982, Rev. Mod. Phys., 54, 1103 [NASA ADS] [CrossRef] [Google Scholar]
- Allard, N. F., Koester, D., Feautrier, N., & Spielfiedel, A. 1994, A&AS, 108, 417 [NASA ADS] [Google Scholar]
- Allard, N. F., Royer, A., Kielkopf, J. F., & Feautrier, N. 1999, Phys. Rev. A, 60, 1021 [NASA ADS] [CrossRef] [Google Scholar]
- Allard, N. F., Deguilhem, B., Monari, A., Gadéa, F. X., & Kielkopf, J. F. 2013, A&A, 559, A70 [NASA ADS] [CrossRef] [EDP Sciences] [Google Scholar]
- Allard, N. F., Leininger, T., Gadéa, F. X., Brousseau-Couture, V., & Dufour, P. 2016a, A&A, 588, A142 [NASA ADS] [CrossRef] [EDP Sciences] [Google Scholar]
- Allard, N. F., Guillon, G., Alekseev, V. A., & Kielkopf, J. F. 2016b, A&A, 593, A13 [NASA ADS] [CrossRef] [EDP Sciences] [Google Scholar]
- Anderson, P. W. 1952, Phys. Rev., 86, 809 [NASA ADS] [CrossRef] [Google Scholar]
- Aquilante, F., De Vico, L., Ferré, N., et al. 2010, J. Comput. Chem., 31, 224 [CrossRef] [Google Scholar]
- Baranger, M. 1958a, Phys. Rev., 111, 494 [NASA ADS] [CrossRef] [MathSciNet] [Google Scholar]
- Baranger, M. 1958b, Phys. Rev., 111, 481 [NASA ADS] [CrossRef] [MathSciNet] [Google Scholar]
- Blouin, S., Dufour, P., & Allard, N. F. 2018, ApJ, 863, 184 [NASA ADS] [CrossRef] [Google Scholar]
- Bottcher, C., Docken, K. K., & Dalgarno, A. 1975, J. Phys. B At. Mol. Phys., 8, 1756 [NASA ADS] [CrossRef] [Google Scholar]
- Deguilhem, B., Leininger, T., Gadea, F. X., & Dickinson, A. S. 2009, J. Phys. B: At. Mol. Opt. Phys., 42, 015102 [NASA ADS] [CrossRef] [Google Scholar]
- Dufour, P., Bergeron, P., Liebert, J., et al. 2007, ApJ, 663, 1291 [NASA ADS] [CrossRef] [Google Scholar]
- Dufour, P., Blouin, S., & Coutu, S. 2017, in 20th European White Dwarf Workshop, eds. P. E. Tremblay, B. Gaensicke, & T. Marsh, ASP Conf. Ser, 509, 3 [Google Scholar]
- Fuentealba, P., Stoll, H., Szentpaly, L., Schwerdtfeger, P., & Preuss, H. 1983, J. Phys. B, 16, L323 [NASA ADS] [CrossRef] [Google Scholar]
- Gaia Collaboration (Brown, A.G.A., et al.) 2018, A&A, 616, A1 [NASA ADS] [CrossRef] [EDP Sciences] [Google Scholar]
- Hinde, R. J. 2003, J. Phys. B At. Mol. Phys., 36, 3119 [NASA ADS] [CrossRef] [Google Scholar]
- Hollands, M. A., Koester, D., Alekseev, V., Herbert, E. L., & Gänsicke, B. T. 2017, MNRAS, 467, 4970 [NASA ADS] [Google Scholar]
- Kampen, N. G. V. 1974, Physica, 74, 215 [NASA ADS] [CrossRef] [MathSciNet] [Google Scholar]
- Khemiri, N., Dardouri, R., Oujia, B., & Gadéa, F. X. 2013, J. Phys. Chem., 117, 8915 [CrossRef] [Google Scholar]
- Kielkopf, J. F., & Allard, N. F. 1979, Phys. Rev. Lett., 43, 196 [NASA ADS] [CrossRef] [Google Scholar]
- Koester, D., & Wolff, B. 2000, A&A, 357, 587 [NASA ADS] [Google Scholar]
- Kolb, A. C., & Griem, H. 1958, Phys. Rev., 111, 514 [NASA ADS] [CrossRef] [Google Scholar]
- Kubo, R. 1962a, J. Phys. Soc. Jpn., 17, 1100 [NASA ADS] [CrossRef] [MathSciNet] [Google Scholar]
- Kubo, R. 1962b, J. Math. Phys., 4, 174 [NASA ADS] [CrossRef] [Google Scholar]
- McCartan, D. G., & Hindmarsh, W. R. 1969, J. Phys. B: At. Mol. Opt. Phys., 2, 1396 [NASA ADS] [CrossRef] [Google Scholar]
- Mella, M., Calderoni, G., & Cargnoni, F. 2005, J. Chem. Phys., 123, 054328 [NASA ADS] [CrossRef] [PubMed] [Google Scholar]
- Paul-Kwiek, E., & Czuchaj, E. 1998, Eur. Phys. J. D, 3, 163 [NASA ADS] [CrossRef] [EDP Sciences] [Google Scholar]
- Prusti, T., De Bruijne, J., Brown, A. G., et al. 2016, A&A, 595, A1 [NASA ADS] [CrossRef] [EDP Sciences] [Google Scholar]
- Reggami, L., & Bouledroua, M. 2011, Phys. Rev. A, 83, 032719 [NASA ADS] [CrossRef] [Google Scholar]
- Reho, J., Merker, U., Radcliff, M. R., Lehmann, K. K., & Scoles, G. 2000, J. Chem. Phys., 112, 8409 [NASA ADS] [CrossRef] [Google Scholar]
- Royer, A. 1972, Phys. Rev. A, 6, 1741 [NASA ADS] [CrossRef] [Google Scholar]
- Royer, A. 1974, Can. J. Phys., 52, 1816 [NASA ADS] [CrossRef] [Google Scholar]
- Royer, A. 1980, Phys. Rev. A, 22, 1625 [NASA ADS] [CrossRef] [Google Scholar]
- Sando, K. M., & Wormhoudt, J. G. 1973, Phys. Rev. A, 7, 1889 [NASA ADS] [CrossRef] [Google Scholar]
- Shipman, H. 1990, Data from HST Proposal 2593S - White Dwarf Stars, MAST Archive [Google Scholar]
- Subasavage, J. P., Henry, T. J., Bergeron, P., Dufour, P., & Hambly, N. C. 2008, AJ, 136, 899 [NASA ADS] [CrossRef] [Google Scholar]
- Subasavage, J. P., Jao, W.-C., Henry, T. J., et al. 2017, AJ, 154, 32 [NASA ADS] [CrossRef] [Google Scholar]
- Szudy, J., & Baylis, W. 1975, J. Quant. Spectr. Rad. Transf., 15, 641 [NASA ADS] [CrossRef] [Google Scholar]
- Weidemann, V., & Koester, D. 1989, A&A, 210, 311 [NASA ADS] [Google Scholar]
- Werner, H. J., Knowles, P. J., & Knizia, G. 2012, MOLPRO, Version 2012.1, a Package of ab initio Programs [Google Scholar]
- Wolff, B., Koester, D., & Liebert, J. 2002, A&A, 385, 995 [NASA ADS] [CrossRef] [EDP Sciences] [Google Scholar]
- Zeidler-KT, E.-M., Weidemann, V., & Koester, D. 1986, A&A, 155, 356 [NASA ADS] [Google Scholar]
All Figures
|
Fig. 1. Ultraviolet spectrum of the DZ white dwarf L 745-46A. The distinctive resonance lines of Mg at 2852 Å and Mg+ at 2796/2803 Å are clearly visible (Shipman 1990). |
| In the text | |
|
Fig. 2. He density as a function of Rosseland mean optical depth assuming atmospheric parameters used in synthetic spectra studied in Sect. 4.2. T eff = 8000 K (full line), log Ca/He = −9, log Mg/He = −7.3, log H/He = −3.5. T eff = 6000 K (dashed line), log Ca/He = −10.5, log Mg/He = −7.3, and log H/He = −3.5. |
| In the text | |
|
Fig. 3. Potential energies for the X, A, and B states of the Mg–He molecule. 3s X1Σ (full line), 3p B 1Σ (full line), 3p A1Π (dashed line), and transition dipole moments B − X (full line), A − X (dashed line). |
| In the text | |
|
Fig. 4. ΔV for the B − X transition of the MgHe line (red curve), compared to the Mg+He line (blue curve), see Fig. 4 of Allard et al. (2016b). |
| In the text | |
|
Fig. 5. Variation of the MgHe line profile with temperature (from top to bottom, T = 12 000, 8000, 6000, and 4000 K) for n He = 1021 cm−3. |
| In the text | |
|
Fig. 6. Theoretical absorption cross-sections of the MgHe line. The density of the perturbers is n He = 1022, 5 × 10²¹ and 1021 cm−3, from top to bottom. The temperature is 6000 K. |
| In the text | |
|
Fig. 7. Comparison of the MgHe line (red line) to the sum of the two components of the Mg+He line (blue line) (T = 8000 K and n He = 2 × 1021 cm−3). |
| In the text | |
|
Fig. 8. Synthetic spectrum computed at T eff = 8000 K, log Ca/He = −9, log Fe/He = −8.4, log Mg/He = −7.3, and log H/He = −3.5, compared to synthetic spectra computed without the MgII (in blue) and the MgI (in red) line opacity. |
| In the text | |
|
Fig. 9. Comparison of the MgHe line (red line) to the sum of the two components of the Mg+He line (blue line). T = 6000 K and n He = 1 × 1022 cm−3. |
| In the text | |
|
Fig. 10. Synthetic spectrum computed at T eff = 6000 K, log Ca/He = −10.5, log Fe/He = −9.3, log Mg/He = −9.2, and log H/He = −3.5, compared to synthetic spectra computed without the MgII (in blue) and the MgI (in red) line opacity. |
| In the text | |
|
Fig. 11. Theoretical absorption cross-sections of the Mg line compared to the Lorentzian profile (green dashed line) obtained in the impact approximation. The density of the perturbers is n He = 1021 cm−3. The temperature is 8000 K. |
| In the text | |
|
Fig. 12. Variation with temperature of the FWHM of the resonance lines of Mg perturbed by He collisions. Bottcher et al. (1975), circle), Reggami & Bouledroua (2011) Set I (green downward-pointing triangle), Reggami & Bouledroua (2011) Set II (blue upward-pointing triangle), Alekseev (2014; see footnote) (plus), this work (star), and a power-law fit (magenta line). The rates are in units of 10−9 s−1 cm−3. |
| In the text | |
|
Fig. 13. Our best photometric and spectroscopic fit of WD 2216–657. |
| In the text | |
Current usage metrics show cumulative count of Article Views (full-text article views including HTML views, PDF and ePub downloads, according to the available data) and Abstracts Views on Vision4Press platform.
Data correspond to usage on the plateform after 2015. The current usage metrics is available 48-96 hours after online publication and is updated daily on week days.
Initial download of the metrics may take a while.