| Issue |
A&A
Volume 674, June 2023
|
|
|---|---|---|
| Article Number | A171 | |
| Number of page(s) | 11 | |
| Section | Atomic, molecular, and nuclear data | |
| DOI | https://doi.org/10.1051/0004-6361/202346215 | |
| Published online | 20 June 2023 | |
Temperature and density dependence of line profiles of sodium perturbed by helium★
1
GEPI, Observatoire de Paris, PSL Research University, UMR 8111, CNRS,
Sorbonne Paris Cité, 61, Avenue de l’Observatoire,
75014
Paris, France
e-mail: This email address is being protected from spambots. You need JavaScript enabled to view it.
2
Institut d’Astrophysique de Paris, UMR7095, CNRS, Université Paris VI,
98bis Boulevard Arago,
75014
Paris, France
3
U.S. Army DEVCOM, Aviation and Missile Center, Charles M. Bowden Laboratory,
Redstone Arsenal, AL
35898, USA
4
Laboratoire Interdisciplinaire Carnot de Bourgogne, UMR6303, CNRS, Université de Bourgogne-Franche-Comté,
9, Avenue Alain Savary,
21078
Dijon Cedex, France
Received:
22
February
2023
Accepted:
16
April
2023
Abstract
Context. Ultracool stellar atmospheres and hot exoplanets show absorption by alkali resonance lines severely broadened by collisions with neutral perturbers. In the coolest and densest atmospheres, such as those of T dwarfs, Na I and K I broadened by molecular hydrogen and helium can come to dominate the entire optical spectrum. The effects of Na–He collision broadening are also central to understanding the opacity of cool DZ white dwarf stars.
Aims. In order to be able to construct synthetic spectra of brown dwarfs and cool DZ white dwarfs, where helium density can reach several 1021 cm−3, Na–He line profiles of the resonance lines have been computed over a wide range of densities and temperatures.
Methods. Unified line profiles that are valid from the core to the far wings at high densities are calculated in the semiclassical approach using up-to-date molecular data including electronic spin-orbit coupling from the sodium atom. Far wings are extended to more than 4000 cm−1 from the line center when the helium density can reach 1021 cm−3 at 5000 K.
Results. We present a comprehensive study of Na–He collisional profiles at high density, and temperatures from 5000 K, which is the temperature prevailing in the atmosphere of ultra-cool DZ white dwarf stars, down to 1 K, which is the temperature in liquid helium clusters. Collision broadening and shift parameters within the impact approximation obtained in the semiclassical and quantum theory using our new accurate molecular data are presented.
Key words: opacity / line: profiles / brown dwarfs / white dwarfs
The opacity tables of Na–He are only available at the CDS via anonymous ftp to cdsarc.cds.unistra.fr (130.79.128.5) or via https://cdsarc.cds.unistra.fr/viz-bin/cat/J/A+A/674/A171
This paper is dedicated to the memory of France Allard, who initiated this work.
© The Authors 2023
 Open Access article, published by EDP Sciences, under the terms of the Creative Commons Attribution License (https://creativecommons.org/licenses/by/4.0), which permits unrestricted use, distribution, and reproduction in any medium, provided the original work is properly cited.
This article is published in open access under the Subscribe to Open model. This email address is being protected from spambots. You need JavaScript enabled to view it. to support open access publication.
1 Introduction
The opacities of Na and K play a crucial role in the atmospheres of brown dwarfs and exoplanets. The studies of observed L and T dwarfs by Liebert et al. (2000) and Burrows et al. (2001) clearly showed the importance of extended wings of both sodium and potassium doublets centered at 0.589 µm and 0.77 µm, respectively. They pointed out the need for more accurate line profile calculations than Lorentzian profiles. Clearly understanding the shape of these lines is essential to modeling the transport of radiation from the interior. A first improvement was made by Burrows & Volobuyev (2003) using multiconfiguration self-consistent field Hartree–Fock potentials in the theory of Szudy & Baylis (1975, 1996). In Allard et al. (2003), we presented the first application of the absorption profiles of Na and K resonance lines perturbed by He and H2 using molecular potentials of Pascale (1983) to describe the alkali-He interaction and of Rossi & Pascale (1985) for the alkali-H2 interaction. The line profiles were included as a source of opacity in model atmospheres and synthetic spectra using the Allard et al. (2001) atmosphere program PHOENIX. The results were compared to previous models and demonstrated that these improvements are of fundamental importance for obtaining a better quantitative interpretation of the spectra.
The far wings play a crucial role for the continuum generated far from the line center. It is then necessary to update all the opacity tables provided in the past for the alkali perturbed by helium and molecular hydrogen using the most recent existing ab initio potentials. In particular, using our new potentials, we find that the blue far wing is significantly altered, including the position of the blue satellite, compared to the results given in Allard et al. (2003), while the far red wing remains the same. This paper is a continuation of Allard et al. (2007b, 2019) where new K–H2 and Na–H2 collisional profiles have been presented using accurate ab initio potentials. These profiles are now used in many studies of brown dwarfs (e.g., Burningham et al. 2017; Oreshenko et al. 2020) and exoplanets (e.g., Phillips et al. 2020; Hou Yip et al. 2020; Gonzales et al. 2021; Chubb et al. 2021; Nikolov et al. 2022; Samra et al. 2023).
There are various theoretical approaches for treating the problem of atomic lines broadened by collisions with atomic perturbers. Fully quantum-mechanical methods have been developed which allow practical calculations within the one-perturber approximation (Julienne & Mies 1986; Mies et al. 1986; Herman & Sando 1978; Sando & Herman 1983). The one-perturber approximation neglects the contribution of the core of the line, and is only valid in the wing and in the limit of densities low enough such that multiple perturber effects may be neglected. However, at the high-density range prevailing in the atmospheres of DZ white dwarfs (up to several ×1021 cm−3), multiple perturber effects must be included in the theoretical treatment. An exact methodology for the quantum calculation at high densities, as encountered in stellar atmospheres or laboratory plasmas, is not known. Approximate unified-theory methods to construct density-dependent line shapes from one perturber spectra are available by Fano (1963), Jablonski (1945, 1948), Anderson (1952), Anderson & Talman (1956), Baranger (1958c,b,a), and Szudy &Baylis(1975).
In dense plasmas, as in very cool DZ white dwarfs and liquid helium clusters, the possibility of several atoms interacting strongly is high, and the effects play a role in the wavelength of the line center, such as in the shift of the line, as well as the continuum generated far from the line center. For such a high-perturber density, the collisional effects should be treated by using the autocorrelation formalism in order to take into account simultaneous collisions with more than one perturbing atom. The theory of spectral line shapes, especially the unified approach we have developed and refined, makes possible models of stellar spectra that account for the centers of spectral lines and their extreme wings in one consistent treatment. Complete details and the derivation of the theory are given in Allard et al. (1999). A rapid account of the theory is given in Sect. 2. Using our semiclassical approach, we have computed the cross sections separately for the two fine-structure components of the P state of sodium, namely 2P1/2 (yielding the D1 line by a transition to ground state 2S1/2) and 2P3/2 (D2 line). Calculations were made on the basis of adiabatic Na–He potentials from Dell’Angelo et al. (2012), including atomic Na spin–orbit coupling along the lines described in Cohen & Schneider (1974). For ab initio calculations, it is the selection of basis states and the optimization techniques that may determine the final accuracy (Sect. 3). In Sect. 4, we illustrate the evolution of the absorption spectra of Na–He collisional profiles for the densities and temperatures prevailing in atmosphere of brown and cool white dwarf stars and in laboratory experiments of helium doped with alkali metals. The calculations span the range 1 K to 5000 K. We compare the obtained spectral line parameters to those calculated in the quantum Baranger–Lindholm (BL) theory (Baranger 1958c, Sect. 5).
2 General expression for the spectrum in an adiabatic representation
A unified theory of spectral line broadening has been developed to calculate neutral atom spectra given the interaction and radiative transition moments for relevant states of the radiating atom with other atoms in its environment. Our approach is based on the quantum theory of spectral line shapes of Baranger (1958c,b) developed in an adiabatic representation to include the degeneracy of atomic levels (Royer 1974, 1980; Allard et al. 1994). The spectrum Ι(Δω) can be written as the Fourier transform (FT) of the dipole autocorrelation function Φ(s),
 (1)
(1)
where s is time.
The FT in Eq. (1) is taken such that Ι(Δ ω) is normalized to unity when integrated over all frequencies, and Δ ω is measured relative to the unperturbed line. A pairwise additive assumption allows us to calculate the total profile Ι(Δω), when all the per-turbers interact as the FT of the Nth power of the autocorrelation function ϕ(s) of a unique atom–perturber pair. Therefore,
 (2)
(2)
That is to say, we neglect the interperturber correlations. The radiator can interact with several perturbers simultaneously, but the perturbers do not interact with each other. It is what Royer (1980) calls the totally uncorrelated perturbers approximation. The fundamental result expressing the autocorrelation function for many perturbers in terms of a single perturber quantity ɡ(s) was first obtained by Anderson (1952) and Baranger (1958c) in the classical and quantum cases, respectively. From the point of view of a general classical theory, the solution to the Anderson (1952) model corresponds to the first-order approximation in the gas density obtained by the cumulant expansion method (Royer 1972). The higher-order terms representing correlations between the perturbers are neglected since they are extremely complicated (Royer 1972; Kubo 1962a,b; Kampen 1974). We obtain for a perturber density np
 (3)
(3)
The decay of the autocorrelation function Φ(s) with time s leads to atomic line broadening. It depends on the density of perturbing atoms np and on their interaction with the radiating atom. The molecular potentials and radiative dipole transition moments are input data for a unified spectral line shape evaluation. The dipole autocorrelation function Φ(s) is evaluated for a classical collision path with an average over all possible collisions. For a transition α = (i, f) from an initial state i to a final state f, we have
![Mathematical equation: $\matrix{ {{g_\alpha }\left( s \right) = {1 \over {\sum\nolimits_{e,e\prime } {{\,^{\left( \alpha \right)}}} {{\left| {{d_{ee\prime }}} \right|}^2}}}\sum\limits_{e,e\prime } {^{\left( \alpha \right)}} } \hfill \cr {\,\,\,\,\,\,\,\,\,\,\,\,\,\,\,\,\,\,\,\,\int_0^{ + \infty } {2\pi b{\rm{d}}b\,\,\int_{ - \infty }^{ + \infty } {{\rm{d}}x\,\,{{\tilde d}_{ee\prime }}\left[ {R\left( 0 \right)} \right]} } } \hfill \cr {\,\,\,\,\,\,\,\,\,\,\,\,\,\,\,\,\,\,\,\left[ {{{\rm{e}}^{{\textstyle{i \over }}\,\,\,\int_0^s {{\rm{d}}t\,{V_{e\prime e}}\,\left[ {R\left( t \right)} \right]} }}\,{{\tilde d}^*}{\,_{ee\prime }}\,\left[ {R\left( s \right)} \right] - \tilde dee\prime \,\,\left[ {R\left( 0 \right)} \right]} \right].} \hfill \cr } $](/articles/aa/full_html/2023/06/aa46215-23/aa46215-23-eq4.png) (4)
(4)
In Eq. (4), e and e′ label the energy surfaces on which the interacting atoms approach the initial and final atomic states of the transition as R → ∞. The sum  is over all pairs (e, e′) such that ωe′,e(R) → ωα as R → ∞. We define
  as a modulated dipole (Allard et al. 1999)
![Mathematical equation: $D\left( R \right) \equiv {\tilde d_{ee\prime }}\left[ {R\left( t \right)} \right] = {d_{ee\prime }}\left[ {R\left( t \right)} \right]{{\rm{e}}^{ - {\textstyle{\beta \over 2}}\,{V_e}\left[ {R\left( t \right)} \right]}},$](/articles/aa/full_html/2023/06/aa46215-23/aa46215-23-eq7.png) (5)
(5)
where β is the inverse temperature (1/kT). Here Ve is the ground state potential when we consider absorption profiles, or an excited state for the calculation of a profile in emission. Over regions where Ve(r) < 0, the factor  accounts for bound states of the radiator-perturber pair, but in a classical approximation wherein the discrete bound states are replaced by a continuum; thus any band structure is smeared out.
In the present context, the perturbation of the frequency of the atomic transition during the collision results in a phase shift, n(s), calculated along a classical path R(t) assumed to be rectilinear, is
![Mathematical equation: $\eta \left( s \right) = {1 \over }\,\,\int_0^S {\,\,{\rm{d}}t\,\,{V_{e\prime e}}} \left[ {R\left( t \right)} \right]$](/articles/aa/full_html/2023/06/aa46215-23/aa46215-23-eq9.png) (6)
(6)
where ΔV(R), the difference potential, is given by
![Mathematical equation: ${\rm{\Delta }}V\left( R \right) \equiv {V_{e\prime e}}\left[ {R\left( t \right)} \right] = {V_{e\prime }}\left[ {R\left( t \right)} \right] - {V_e}\left[ {R\left( t \right)} \right],$](/articles/aa/full_html/2023/06/aa46215-23/aa46215-23-eq10.png) (7)
(7)
and it represents the difference between the electronic energies of the quasi-molecular transition. The potential energy for a state e is
![Mathematical equation: ${V_e}\left[ {R\left( t \right)} \right] = {E_e}\left[ {R\left( t \right)} \right] - E_{\rm{e}}^\infty .$](/articles/aa/full_html/2023/06/aa46215-23/aa46215-23-eq11.png) (8)
(8)
At time t from the point of closest approach
![Mathematical equation: $R\left( t \right) = {\left[ {{\rho ^2} + {{\left( {x + \bar \upsilon t} \right)}^2}} \right]^{{1 \mathord{\left/ {\vphantom {1 2}} \right. \kern-\nulldelimiterspace} 2}}},$](/articles/aa/full_html/2023/06/aa46215-23/aa46215-23-eq12.png) (9)
(9)
with ρ being the impact parameter of the perturber trajectory, x the position of the perturber along its trajectory at time t = 0, and  the average relative velocity between the radiating atom and perturber.
3 Na–He diatomic potentials
Pascale (1983) obtained the diatomic adiabatic potentials for ground states and numerous excited states of alkali-metal-He systems by using l-dependent pseudo-potentials with parameters constrained by spectroscopic and scattering data. These potentials, and subsequent ones for other rare gases and alkalis computed similarly, were the prevailing theoretical basis to interpret and model spectral line profiles at the time and remain in use today because they can be flexibly adapted to measurements. However, with vast improvements in computational power and refinements in code and methodology, significant progress in ab initio calculations of Na–He interactions has been achieved as reported by Theodorakopoulos et al. (1987), Nakayama & Yamashita (2001), Enomoto et al. (2004), Mullamphy et al. (2007), and Allouche et al. (2009). Recent work of Dell’Angelo et al. (2012) has been used for this paper.
We computed the ground state (X 2Σ) and the lowest first two excited states’ (A 2Π and B 2Σ) adiabatic potential energy curves (PECs) for the Na-He atom pair, correlating to Na(3s 2S) + He(1S) and Na(3p 2P) + He(1S), respectively, using the state-averaged complete active space self-consistent field multiref-erence configuration interaction (SA-CASSCF-MRCI+Q) high level ab initio method, with additional Davidson cluster correction (Q) for a lack of size consistency. Complexation energies were obtained within the supermolecule approach. Eleven (nine from Na plus two from He) electrons were dynamically included in the calculation, leaving only one inner 1s frozen atomic orbital for sodium. We used extensive correlation-consistent basis sets of Dunning’s type, aug-cc-pV6Z for He and cc-pV5Z for Na, whose accuracy have been checked against known atomic energies (the absolute energy for ground state He and the relative position of levels 3s 2S and 3p 2P for Na). In particular, we have obtained a total ground state energy for He(1S) within 0.3% of the best available ones as of yet (Thakkar & Koga 1994; Freund et al. 1984; Levin & Shertzer 1985; Drake et al. 2002).
The active space used in the CASSCF method has been chosen to provide the highest possible accuracy to the excited states’ electronic energies, most sensitive to it, and it includes molecular orbitals of both σ and π types. The accuracy of the MRCI ground X 2Σ PEC has been checked against (size-extensive) coupled cluster calculations up to triple excitation corrections, CCSD(T), using the same basis sets. Absolute energies obtained by these two methods for the whole range of distances do not differ by more than 0.001%, while complexation energies are essentially indistinguishable.
Electronic energy grid points have been obtained for 220 internuclear distances, ranging from 0.5 a0 to 1000 a0, with a higher density at short range and around the potential well. We have paid particular attention to give a correct description at short bond lengths, as energies in this domain change very sharply, especially for the ground state, and line wing intensities are extremely dependent on them. On the other hand, the long range ab initio data are easily connected to a simple inverse even power expansion series form with a leading term in R−6, expressing dispersion for a neutral-neutral interaction. More computational details can be found in Dell’Angelo et al. (2012).
Finally, the spin–orbit (SO) coupling within the Na–He dimer has been included, while not having been computed ab initio from Breit-Pauli SO terms in the Hamiltonian, nor even in the Douglas-Kroll approximation, alongside electronic energies. Instead, given the still small value of the SO splitting for atomic Na (roughly, ΔSO = 17.2 cm−1), SO mixing of adia-batic PECs has been incorporated from it, assuming a smooth and slow variation as the He atom approaches, along the lines described in Cohen & Schneider (1974), Schneider & Cohen (1974), and Nakayama & Yamashita (2001). This procedure seems entirely reasonable, as shown by the rather acceptable agreement between the results obtained for the KHe dimer (for K alone, ΔSO = 57.7 cm−1) with the SO matrix explicitly computed within a full CI procedure, (Chattopadhyay 2011), and those using the asymptotic atomic alkali value mentioned above (Nakayama & Yamashita 2001). All calculations have been performed with the MOLPRO package (Werner et al. 2006).
Figures 1–2 compare the potential data of Dell’Angelo et al. (2012) to those of Pascale (1983) (dashed blue line). The main difference occurs at short distances in the repulsive walls of the B potential; we can see the effect on the potential differences in Fig. 4 and, consequently, on the blue wing of this component (Fig. 5). The potential curves of the A 2Π1/2,3/2 states are very close and the red wings remain unchanged. Moreover, the fine structure is small and does not affect the extension of the red wings. For the sake of clarity, we have further reported, in Fig. 5, only the red wing of the D1 component obtained with the potential data of Dell’Angelo et al. (2012).
The potentials computed by Nakayama & Yamashita (2001) with a smaller basis set are overplotted (dotted line) in Figs. 1 and 3. They are in excellent agreement for the Χ2Σ+ and Α2Π states, which are most relevant in the study of Na attached to He nanodroplets. The barrier in the 2Π1/2 that is influential on the line profile is exactly identical in the two approaches, as shown in Fig. 3.
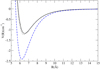 |
Fig. 1 Potential curve for the 3s X 2Σ1/2 state of Na–He Dell’Angelo et al. (2012). The Na–He potentials of Nakayama & Yamashita (2001, dotted line) and Pascale (1983, dashed blue line) are superimposed. |
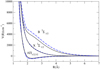 |
Fig. 2 Potential curves of the Na–He molecule for ab initio potentials of Dell’Angelo et al. (2012, solid line) compared to pseudo-potentials of Pascale (1983, dashed blue line). |
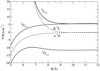 |
Fig. 3 Details of the intermediate range of potential curves for the asymptotic Na 3p state with (solid line) and without (dashed line) spin–orbit coupling. The Na–He energies are given relative to the center of gravity of the 3p state from the ab initio potentials calculated by Dell’Angelo et al. (2012). The prior work of Nakayama & Yamashita (2001) is superimposed (dotted line). |
4 Temperature and density dependence of the Na–He line profiles
The spectra of alkali metal atoms perturbed by rare gases have been extensively investigated in experimental and theoretical work by Allard & Kielkopf (1982). In Allard et al. (2003), we presented absorption profiles of Na resonance lines perturbed by He using pseudo-potentials of Pascale (1983) to describe the interaction. At low densities, the binary model, for an optically active atom in collision with one perturber, is valid for the whole profile, except for the central part of the line. Several quantum mechanical calculations of absorption coefficients for far line wing spectra of sodium resonance lines broadened by helium were carried out by Zhu et al. (2006) and by Alioua et al. (2008) using Theodorakopoulos et al. (1987) and Allouche et al. (2009) ab initio potentials, respectively. More recently, Kielkopf et al. (2017) reported on work that compares unified line shape calculations based on ab initio potentials with experiments to determine the wings of the sodium and potassium resonance lines broadened by H2, He, and other rare gases.
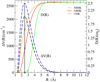 |
Fig. 4 ΔV(R) Dell’Angelo et al. (2012, dashed black line) compared to Pascale (1983, dashed blue line) and the temperature dependence of modulated dipole D(R) (solid line) corresponding to the 3s X → 3p B P3/2 transition of the Na D2 line. |
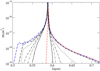 |
Fig. 5 Variation of the absorption cross section of the D2 component with temperature (from top to bottom: T = 3000, 1000, 400, 250, and 150 K, and nHe = 1020 cm−3). The corresponding profile for T = 3000 K using pseudo-potentials of Pascale (1983) is overplotted (dashed blue line). The D1 component for T = 3000 K using ab initio potentials of Dell’Angelo et al. (2012) is also overplotted (dashed red line). |
4.1 High temperatures
Two excited molecular levels B 2Σ1/2 and A 2Π3/2 contribute to the D2 line and produce opposite wings. While A states radiate on the red wing, B states radiate on the blue wing. We subsequently restrict our analysis to the blue wing of the D2 line as the red wings of the doublet are unchanged compared to our previous results reported in Allard et al. (2003). The unified theory (Anderson 1952; Allard 1978; Royer 1978) predicts that there will be line satellites centered periodically at frequencies corresponding to integer multiples of the extrema of the difference potential ΔV(R):
![Mathematical equation: ${\rm{\Delta }}V\left( R \right) \equiv {V_{e\prime e}}\left[ {R\left( t \right)} \right] = {V_{e\prime }}\left[ {R\left( t \right)} \right] - {V_e}\left[ {R\left( t \right)} \right],$](/articles/aa/full_html/2023/06/aa46215-23/aa46215-23-eq14.png) (10)
(10)
which represents the difference between the electronic energies of a quasi-molecular e–e′ transition (Allard & Kielkopf 1982). The difference potential maximum as shown in Fig. 4 is 2600 cm−1 when using pseudo-potentials of Pascale (1983) and 2100 cm−1 when using the ab initio potentials of Dell’Angelo et al. (2012) and Nakayama & Yamashita (2001). They give rise to satellites positioned at Δħω = ΔVmax (Allard 1978). Because of the large maximum in ΔV, the line satellite is very well separated from the main line in the blue wing. The presence of line satellite features is very sensitive to the temperature due to the fast variation of the modulated dipole moment D(R) (Eq. (5)) with temperature in the internuclear region where the line satellite is formed (Fig. 4). In Fig. 5 we show the absorption cross section for the resonance line of Na for a He density of 1020 cm−3 and temperatures from 150 to 3000 K, constituting the temperature range of brown dwarfs. The density and temperature range used in Fig. 5 span a pressure range of 2.1–41.4 bar. The NaHe line satellite is apparent for T ≥ 1000 K; it disappears for decreasing T when the transition moment D(R) gets very small. There is formation of a NaHe quasi-molecule at 0.53 µm, which is in agreement with theoretical results obtained by Zhu et al. (2006), Kielkopf & Allard (2008), and Alioua et al. (2008).
At this moderate pressure, the line profile intensities are related to the perturbations caused by a single binary collision event. However, the density of helium can reach 1021 cm−3 in cool DZ white dwarfs, and for this density multiple perturber effects can appear in the blue wing of the D2 line (Fig. 6). We can notice the presence of a bump due to NaHe2 at about 0.48 µm, when the helium density, nHe = 1021 cm−3, is sufficiently high to observe multiple perturber effects (Allard et al. 2012). Figure A.1 shows the extension of the line wings at T = 5000 K and how the unified theoretical approach is a major improvement compared to the unrealistic use of a Lorentzian so far in the wings.
The strength of the line satellite at about 0.53 µm increases with temperature (Fig. 5) and mostly remains at the same position, whereas the strength and extension of the red wings both increase with temperature. There is a total blend of the line satellite in the core of the line when the density reaches 5 × 1021 cm−3 (Fig. 6), leading to the decreasing of the maximum of σ of the D2 component.
We note that Na I line profiles have been observed in extremely cool, metal-rich white dwarfs. The observations of the oldest and colder white dwarfs following the studies of Oppenheimer et al. (2001) and Harris et al. (2003) have revealed two stars showing very unusual wide and deep absorption at 5000–6000 Å. Homeier et al. (2007) investigated effects on the Na doublet of high-perturber densities occurring for metal-rich white dwarfs with a helium-dominated atmosphere. They found that the density of neutral atomic helium in these two very cool white dwarfs, showing very strong Na absorption, could reach several 1021 to 1022 cm−3. Accurate pressure-broadened profiles that are valid at high densities of He are required to be incorporated into spectral models. Previous Na–He opacity tables used by Homeier et al. (2007) were constructed, allowing line profiles up to nHe = 1019 cm−3 to be obtained. Moreover, the line profiles needed to be calculated using up-to-date molecular data, which affect the blue satellite position, the NaHe line satellite is closer to the main line than obtained with Pascale (1983, Fig. 5). A new analysis of these stars has been realized by Blouin et al. (2019) who demonstrate that the NaHe satellite at 0.53 µm (Fig. 7) is the large feature observed in the spectrum of WD2356-209.
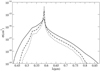 |
Fig. 6 Variation of the absorption cross section of the D2 component with He density (T = 5000 K, nHe = 5 × 10²¹ (solid line), 2 × 10²¹ (dashed line), and 1021 (dotted line) cm−3). |
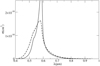 |
Fig. 7 Variation of the absorption cross section of the Na D2 line with helium density (T = 5000 K, nHe = 5 × 10²¹ solid line, and 1022 cm−3 dashed line). |
4.2 Low temperatures
At extremely low temperatures, experimental measurements and theoretical calculations of helium doped with alkali metals have been the subject of active study (see Mateo et al. 2011; Hernando et al. 2010, and references therein). Large liquid He clusters produced in a supersonic jet were doped with alkali atoms (Li, Na, and K) and characterized by means of laser-induced fluorescence (Stienkemeier et al. 1996). The first physical interpretation of the spectra was done by Nakayama & Yamashita (2001). Using a diatomics-in-molecules (DIM) type of calculation for describing the interaction potential between Na and He atoms, they performed quantum path integral Monte Carlo (PIMC) simulations to obtain the He density profile around Na in the ground state and also the absorption spectra of Ak-Hen via the Franck-Condon (FC) approximation (Ak = Li, Na, and K). They employed the semiclassical FC line shape theory for electronic transitions in a condensed phase system. In Allard et al. (2013), we compared our collisional approach to PIMC calculations of Nakayama & Yamashita (2001) using the same ab initio Na-He molecular potentials. Their Na–He potentials and those of Dell’Angelo et al. (2012) are superimposed in Figs. 1 and 3, and they are in excellent agreement. We have shown in Allard et al. (2013) that both theoretical approaches successfully reproduced the overall shape of the experimental spectra and they explained distinctive features through a discussion of the potential difference and number of He atoms interacting with the Na atom in the region of the collision volume.
At very low temperatures, the multiple perturber effects appear in the red wing of the D1 component. Figure 8 shows D(R) together with the corresponding ΔV(R) for the bound-free transition 3s X 2Σ+ → 3p A Π1/2. At 1 K, D(R) is zero for R < 5 Å and is maximum for R = 6.4 Å, close to the position of the maximum of ΔV. At these low temperatures, T < 2 K, the long-range potentials appear to be extremely important. The long time and distance scales result in novel features such as quasi-molecular satellites due to the high probability of a bound-free transition. This increase of D(R) can be explained by the shallow 1.22 cm−1 well at 6.6 Å in the ground state potential. As shown in Fig. 1, this results from a short range repulsion and a weakly attractive interaction at an intermediate range.
Because ΔV for the transition 3s X 2Σ+ → 3p A Π1/2 is very small, there is no resolved peak due to the line satellite; however, the shoulder, at 2.8 cm−1 in the core of the line, is its signature. Figure 9 clearly shows an asymmetrical shape of the D1 component due to the bound-free transition. A similar shape was obtained by Allard et al. (2016) for the triplet 3p–4s Mg lines perturbed by He, and the blue asymmetry is a consequence of low maxima in the corresponding Mg-He potential energy difference curves at short and intermediate internuclear distances.
Increasing the He density results in a shift of the D1 line toward the position of the extremum of ΔV (Fig. 9). The intensity variation is evidence of the presence of high-order effects, and we observe a blend of these structures. The complex behavior observed experimentally (Fig. 10 of Allard et al. 2013) reflects the fact that the radiating alkali atom experiences multiple encounters with He atoms and our collisional analysis gives a good physical understanding of the phenomena. In our unified approach, we use averages of independent Na-He pair collision processes (Eq. (3)), emphasizing the collisional process rather than the collective quantum description (Nakayama & Yamashita 2001) of the interaction of Na with the He cluster (which may be important for very small He atom numbers). However, our collisional approach goes beyond the FC approximation and provides a better description close to the line center. The main limitation in the simulations obtained in the quantum PIMC theoretical approach derives from the fact that the FC treatment is valid in the line wing and does not take into account the line core that is still present when red shoulders exist as in the Na-He absorption spectra shown in Stienkemeier et al. (1996) and Bünermann et al. (2007). Laboratory observations remain a crucial tool for testing the potentials and assumptions of line shape theory. The binding energy of the Χ2Σ+ state and the interaction energies of the excited states at long range are close to the limit of the accuracy of ab initio calculations. In the next section, we examine the dependence of the line parameters on the temperature.
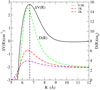 |
Fig. 8 ΔV and variation with temperatures of D(R), the Na–He modulated dipole for the D1 component due to the transition 3s X 2Σ+ → 3p A 2Π1/2. The vertical line is at the maximum of ΔV(R). |
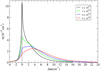 |
Fig. 9 Variation with He atom density of the D1 component at T = 1 K. We note that nHe varies from 2−5 × 1020 cm−3 (extracted from Allard et al. 2013). |
5 Line core parameters
5.1 Semiclassical calculations
An atomic line broadened by collisions in a low-density gas has a Lorentzian profile near the line center which can be related to the FT of a radiative wave in which short duration collisions produce sudden phase changes. In the theory of an impact-broadened line shape, the phase shifts are given by Eq. (6) with the integral taken between S = 0 and ∞. The Lorentzian profile can be defined by two line parameters, the width and the shift of the main line. These quantities can be obtained in the impact limit (S → ∞) of the general calculation of the autocorrelation function (Eq. (4)). In the following discussion, we refer to this line width w as measured by half the full width at half the maximum intensity, what is customarily termed HWHM.
In Allard et al. (2007a), spectral line widths of the light alkalies perturbed by He and H2 were presented for conditions prevailing in brown dwarf atmospheres. We used pseudo-potentials in a semiclassical unified theory of the spectral line broadening (Allard et al. 1999) to compute line core parameters. For the specific study of the D1 (0.5896 µm) and D2 (0.5890 µm) components, we needed to take the spin-orbit coupling of the alkali into account. This was done using an atom-in-molecule intermediate spin-orbit coupling scheme, analogous to the one derived by Cohen & Schneider (1974). The asymptotic degeneracy of the A2Π and B2Σ molecular states is partially split by the coupling, resulting in a clear energetic distinction between 2Π1/2 and 2Π3/2 states. We used the molecular-structure calculations performed by Pascale (1983) for the adiabatic potentials of alkali-metal-He systems, and by Rossi & Pascale (1985) for the molecular potentials of alkali-H2 systems.
For He density nHe below 1020 cm−3, the core of the line is described adequately by a Lorentzian. The new determination of line width using Dell'Angelo et al. (2012) potentials in a wide range of temperatures are presented in Figs. 10 and D.1. The line widths ω (HWHM) are linearly dependent on He density, and a power law in temperature is given for the2 P1/2 component by
 (11)
(11)
and for the 2P3/2 component by
 (12)
(12)
These expressions may be used to compute the line widths for temperatures of stellar atmospheres from 150 to at least 10 000 K. When it is assumed that the main interaction between two atoms is the long-range van der Waals interaction of two dipoles, the Lindholm–Foley theory gives the usual formulae for the line width and shift. The van der Waals damping constant is calculated according to the impact theory of the collision broadening.
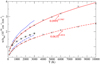 |
Fig. 10 Variation with temperature of the broadening rate (w/nHe) of the D2 (solid line) and D1 (dashed line) resonance lines of Na perturbed by He collisions using the potentials of Dell’Angelo et al. (2012, red curves), Pascale (1983, blue curves), van der Waals potentials (black dotted). The rates are in units of 10−20 cm−1/cm−3. |
5.2 Quantum calculations
We performed a fully quantum-mechanical calculation of the line core parameters in order to check their consistency with parameters obtained from semiclassical theory, presented in Sect. 5.1, and to make a direct comparison with the Na-He quantum calculations of Mullamphy et al. (2007) and Peach et al. (2020). In the previous section, we have shown how the resulting line widths are strongly dependent on the Na-He interaction potentials. Our new fully quantum calculations of the line core parameters in the BL theory (Baranger 1958c) use the Dell'Angelo et al. (2012) potentials. We have noted previously that the potentials used in this work include spin-orbit coupling. For direct comparison of the quantum calculations to the semi-classical calculations of Sect. 5.1, which use the average relative thermal velocity ū, our quantum calculations use the corresponding relative average wavenumber,  , to represent temperature; this quantity is given by
 (13)
(13)
where µ is the reduced mass of the radiating atom and perturber.
Our calculations use the quantum scattering theory of elastic collisions in a spherically symmetric potential (Merzbacher 1998). For a given potential energy curve, at each k within the temperature range T = 300–3000 K, we solved the radial equations and computed the scattering phase shifts,  , for partial waves with orbital angular momentum quantum numbers l = 0−lmax. The choice of lmax is discussed below. Phase shifts were computed for potential energy curves of the upper states, Απ1/2, Απ3/2, and BΣ1/2, and the lower state, Χσ1/2.
The BL equations (Baranger 1958c) connect the scattering phase shifts,  , to the real and imaginary parts of npɡ(S) ≈ (ω + id)S (Allard & Kielkopf 1982; Peach et al. 2020), which are the line core width and shift at a given perturber density, np. The approximation above is valid when line core asymmetry is negligible. Convergence criteria for the ω and d values make use of the relation 1max ≈ ka for a potential energy curve of a finite range, a (Merzbacher 1998). For the Na D1 and D2 lines, the electronic states perturbed by helium all have potential energy curves with nearly the same range, a ≈ 30 a.u. Therefore, for these states we used
 (14)
(14)
In addition to setting lmax for a given state and temperature, convergence of the line core parameters also requires the radial equations to be solved outward to a sufficient internuclear distance, Rmax, to obtain accurate partial wave phase shifts in the asymptotic limit. Examining the convergence of the broadening and shift rates, ω/nHe and d/nHe, we found Rmax = 250 a.u. gives convergence of the rates to the number of significant digits shown in Tables B.1 and C.1.
Quantum calculations of line core parameters are in excellent agreement with those predicted from semiclassical calculations, over the temperature range 300–3000 K. Figure 11 shows the broadening and shift rates versus temperature for the Na–He D1 and D2 lines, which were computed using the semiclassical calculation (stars), and using a fully quantum calculation (dots). In the absence of performing a Boltzmann average over k, and instead using  at the given temperature, oscillations in the quantum calculations are evident and expected – the scattering of a single coherent plane wave was computed, rather than obtaining a weighted sum of coefficients over a distribution of plane waves.
Broadening and shift rates for Na–He, based on fully quantum close-coupling calculations and ab initio potentials, were reported by Mullamphy et al. (2007). In Table 1 we compare the D1 and D2 line broadening rates from our quantum calculations with theirs, near T = 500 K, for which they tabulated the Na–He results. Table 1 also compares the theoretical results with experimental results. Near T = 500 K, we find our theoretical ω/nHe for the D2 line to be in good agreement with the results obtained by Mullamphy et al. (2007), and also in good agreement with the experiment. However, our results for the broadening rates of the D1 line are smaller than those obtained by Mullamphy et al. (2007) and also with the experiments. We do not make a similar comparison of our shift rates, d/nHe, for the D1 and D2 lines with the tabulated values from Mullamphy et al. (2007) since d/nHe ≈ 0 near T = 500 K. Other previous theoretical and experimental results are reported in Table 3 of Allard et al. (2007a).
Mullamphy et al. (2007) found their widths to increase as Tα, with α taking the values 0.4389 and 0.3892 for the D1 and D2 lines, respectively. The same power-law fit to the results of our quantum calculations give α to be 0.4116 ± 0.0111 and 0.3976 ± 0.0041. Fitted values of α agree, to within the fitting uncertainties, with those obtained from our semiclassical calculations and presented in Sect. 5.1.
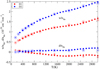 |
Fig. 11 Variation with temperature of the broadening rate (ω/nHe) and of the shift rate (d/nHe) of the D1 (red) and D2 (blue) resonance lines of Na perturbed by He collisions: BL(circles), semiclassical (stars). The rates are in units of 10−20 cm−1/cm−3. |
Comparison of experimental and theoretical broadening rates ω/nHe (10−20 cm−1/cm−3) of the Na resonance lines.
5.3 Contribution of the different components
In Tables B.1 and C.1, we report our computed broadening rates and shift rates obtained in the semiclassical theory compared to the quantum calculation for the different transitions. Figure D.1 shows their dependence on temperature. The D1 line is due to a simple isolated A Π1/2 state, whereas the D2 line comes from the A Π3/2 and B Σ1/2 adiabatic states arising from the 3p P3/2 atomic state. The broadening of the B Σ1/2−Χ Σ1/2 transition is most sensitive to potential at intermediate to short-range separations (R < 5 Å). This result confirms the study by Roueff & van Regemorter (1969) and Lortet & Roueff (1969) of the collisions with light atoms whose polarizability is small. It was shown by them that the width of spectral lines due to collisions with hydrogen atoms does not arise from the van der Waals dispersion forces, but from a shorter range interaction.
The combined contribution of the A Π3/2−Χ Σ1/2 and B Σ1/2−Χ Σ1/2 transitions leads to a larger width for the D2 line, as seen in Fig. 11. We may compare the results of our ab ini-tio calculations for the broadening rate versus temperature of the D1 and D2 lines with those obtained by Mullamphy et al. (2007). The power-law fits for our semiclassical and quantum calculations were seen to agree to within the fitting uncertainties. Therefore, we compared the broadening rates from Eqs. (11) and (12) with the corresponding power-law fits obtained by Mullamphy et al. (2007) and given, in their Table 4, for the D1 and D2 resonance lines of Na perturbed by He. The comparison of the theoretical broadening rates, shown in Fig. 12, reveals that, at higher temperature, our D2 line-broadening rate is slightly higher than the result obtained by Mullamphy et al. (2007), while our D1 line-broadening rate is significantly lower than the Mullamphy et al. (2007) result.
We may also compare our quantum calculations of broadening and shift rates, shown in Fig 11, with those of Peach et al. (2020) by combining the D1 and D2 rates at a given temperature into a single rate for 3P–3S, since Peach et al. (2020) give the rates versus temperature only for the unresolved doublet. The appropriate combination of D1 and D2 rates, based on the relative line strengths for the two transitions, is
 (15)
(15)
where r is the rate ω/np or d/np. Figure 13 compares our quantum calculated rates with those of Peach et al. (2020) at selected temperatures. The differences between our broadening rates for the D1 and D2 lines and those of Mullamphy et al. (2007), shown in Table 1 and Fig 12, and between our broadening and shift rates for the unresolved doublet with those of Peach et al. (2020), shown in Fig. 13, are attributed to differences in the potential energy curves used in the respective calculations.
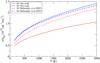 |
Fig. 12 Comparison of theoretical broadening rates (ω/nHe) for the D1 (red) and D2 (blue) resonance lines, using the power-law fitted temperature dependence from the present work (solid), Eqs. (11)–(12), with the power laws obtained by Mullamphy et al. (2007) (dashed). The rates are in units of 10−20 cm−1/cm−3. |
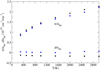 |
Fig. 13 Comparison of the broadening rate (ω/nHe) and of the shift rate (d/nHe) for the unresolved 3P–3S doublet according to quantum calculations of the current work (blue circles) and as reported by Peach et al. (2020, dark squares). The rates are in units of 10−20 cm−1/cm−3. |
6 Conclusions
Ultracool stellar atmospheres show absorption by alkali resonance lines severely broadened by collisions with neutral per-turbers. In the coolest and densest atmospheres, such as those of T dwarfs, Na I and K I broadened by molecular hydrogen and helium can come to dominate the entire optical spectrum. The effects of collision broadening by He are also central to understanding the opacity of cool DZ white dwarf stars which have high-pressure atmospheres. We have carried out a detailed analysis of the Na–He line profiles used for astrophysical applications for cool DZ white dwarf spectra which show extreme absorption by Na. In order to be able to construct synthetic spectra of brown dwarfs and cool DZ white dwarfs, when helium density can become as high as 1021 cm−3, line profiles were computed in a wide range of densities and temperatures. All line shape characteristics depend on the accuracy of the ab ini-tio potentials and of the suitable line shape theory. As part of a more general or unified concept of spectral line formation, quasi-molecular line satellites, which appear in the line wing of alkali resonance lines perturbed by helium or molecular hydrogen, are the binary-collision manifestation of a ubiquitous phenomenon, the many-body nature of spectral lines from dense gases. Collision-broadened lines show features that arise from the changed structure of the radiating atom in the presence of another atom. As such, their presence is sensitive to the conditions of the radiating system and reveal the composition, temperature, and pressure of the source.
New Na–He opacity tables were constructed. The complete tables are available on request. They will be archived at the CDS, with an explanation of their use and a program to produce line profiles for the D1 and D2 components to nHe = 1021 cm−3 from Teff = 150 K to 2500 K and to nHe = 1022 cm−3 from Teff = 3000 K to 10 000 K.
Acknowledgements
We thank the referee for insightful comments.
Appendix A Multiple perturber effects: Formation of NaHen quasi-molecular satellites
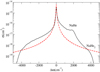 |
Fig. A.1 Absorption cross section of the Na D2 component at T =5000 K, nHe=1 × 10²¹ (solid line) compared to the corresponding Lorentzian profile (dashed line)). |
Appendix B Line broadening rate
Computed broadening rates ω/nHe (1020 cm−1/cm−3) of Na resonance lines perturbed by He collisions. Values are given from both semiclassical (sc) and quantum (BL) calculations.
Appendix C Line shift rate
Computed shift rates d/nHe (10−20 cm−1/cm−3) of Na resonance lines perturbed by He collisions. Values are given from both semiclassical (sc) and quantum (BL) calculations.
Appendix D Line parameters
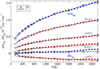 |
Fig. D.1 Comparison of the broadening rate (ω/nHe) and of the shift rate (d/nHe) of the D2 line compared to the contribution of the different transitions B Σ1/2-X and A Π3/2-Χ: BL (circles) and semiclassical (stars). The rates are in units of 10−20 cm−1/cm−3. |
References
- Alioua, K., Bouledroua, M., Allouche, A. R., & Aubert-Frécon, M. 2008, J. Phys. B: At. Mol. Opt. Phys., 41, 175102 [NASA ADS] [CrossRef] [Google Scholar]
- Allard, N. F. 1978, J. Phys. B: At. Mol. Opt. Phys., 11, 1383 [NASA ADS] [CrossRef] [Google Scholar]
- Allard, N. F., & Kielkopf, J. F. 1982, Rev. Mod. Phys., 54, 1103 [Google Scholar]
- Allard, N. F., Koester, D., Feautrier, N., & Spielfiedel, A. 1994, A&A Suppl., 108, 417 [NASA ADS] [Google Scholar]
- Allard, N. F., Royer, A., Kielkopf, J. F., & Feautrier, N. 1999, Phys. Rev. A, 60, 1021 [Google Scholar]
- Allard, F., Hauschildt, P. H., Alexander, D. R., Tamanai, A., & Schweitzer, A. 2001, ApJ, 556, 357 [Google Scholar]
- Allard, N. F., Allard, F., Hauschildt, P. H., Kielkopf, J. F., & Machin, L. 2003, A&A, 411, L473 [NASA ADS] [CrossRef] [EDP Sciences] [Google Scholar]
- Allard, N. F., Kielkopf, J. F., & Allard, F. 2007a, EPJ D, 44, 507 [Google Scholar]
- Allard, N. F., Spiegelman, F., & Kielkopf, J. F. 2007b, A&A, 465, 1085 [NASA ADS] [CrossRef] [EDP Sciences] [Google Scholar]
- Allard, N. F., Nakayama, A., Spiegelman, F., Kielkopf, J. F., & Stienkemeier, F. 2012, J. Phys. Conf. Ser., 397, 012067 [CrossRef] [Google Scholar]
- Allard, N. F., Nakayama, A., Spiegelman, F., Kielkopf, J. F., & Stienkemeier, F. 2013, Eur. Phys. J. D, 67, 52 [NASA ADS] [CrossRef] [Google Scholar]
- Allard, N. F., Leininger, T., Gadéa, F. X., Brousseau-Couture, V., & Dufour, P. 2016, A&A, 588, A142 [NASA ADS] [CrossRef] [EDP Sciences] [Google Scholar]
- Allard, N. F., Spiegelman, F., Leininger, T., & Molliere, P. 2019, A&A, 628, A120 [NASA ADS] [CrossRef] [EDP Sciences] [Google Scholar]
- Allouche, A. R., Alioua, K., Bouledroua, M., & Aubert-Frécon, M. 2009, Chem. Phys, 355, 85 [NASA ADS] [CrossRef] [Google Scholar]
- Anderson, P. W. 1952, Phys. Rev., 86, 809 [Google Scholar]
- Anderson, P. W., & Talman, J. D. 1956, Tech. Rep. 3117 (Murray Hill, NJ: Bell System) [Google Scholar]
- Baranger, M. 1958a, Phys. Rev., 112, 855 [NASA ADS] [CrossRef] [Google Scholar]
- Baranger, M. 1958b, Phys. Rev., 111, 494 [NASA ADS] [CrossRef] [Google Scholar]
- Baranger, M. 1958c, Phys. Rev., 111, 481 [NASA ADS] [CrossRef] [Google Scholar]
- Blouin, S., Dufour, P., Allard, N. F., et al. 2019, ApJ, 872, 188 [NASA ADS] [CrossRef] [Google Scholar]
- Bünermann, O., Droppelmann, G., Hernando, A., Mayol, R., & Stienkemeier, F.A. 2007, J. Phys. Chem.A, 111, 12684 [CrossRef] [Google Scholar]
- Burningham, B., Marley, M. S., Line, M. R., et al. 2017, MNRAS, 470, 1177 [NASA ADS] [CrossRef] [Google Scholar]
- Burrows, A., & Volobuyev, M. 2003, ApJ, 583, 985 [Google Scholar]
- Burrows, A., Hubbard, W. B., Lunine, J. I., & Liebert, J. 2001, Rev. Mod. Phys., 73, 719 [Google Scholar]
- Chattopadhyay, A. 2011, J. Phys. B: At. Mol. Opt. Phys., 44, 165101 [NASA ADS] [CrossRef] [Google Scholar]
- Chubb, K. L., Rocchetto, M., Yurchenko, S. N., et al. 2021, A&A, 646, A21 [NASA ADS] [CrossRef] [EDP Sciences] [Google Scholar]
- Cohen, J. S., & Schneider, B. 1974, J. Chem. Phys., 61, 3230 [Google Scholar]
- Dell’Angelo, D., Guillon, G., & Viel, A. 2012, J. Chem. Phys., 136, 114308 [CrossRef] [Google Scholar]
- Drake, G. W. F., Cassar, M. M., & Nistor, R. A. 2002, Phys. Rev. A, 65, 054501 [NASA ADS] [CrossRef] [Google Scholar]
- Enomoto, K., Hirano, K., Kumakura, M., Takahashi, Y., & Yabuzaki, T. 2004, Phys. Rev. A, 69, 012501 [NASA ADS] [CrossRef] [Google Scholar]
- Fano, F. 1963, Phys. Rev., 131, 259 [NASA ADS] [CrossRef] [Google Scholar]
- Freund, D. E., Huxtable, B. D., & Morgan, J. D. 1984, Phys. Rev. A, 29, 980 [NASA ADS] [CrossRef] [Google Scholar]
- Gonzales, E. C., Burningham, B., Faherty, J. K., et al. 2021, ApJ, 923, 19 [NASA ADS] [CrossRef] [Google Scholar]
- Harris, H. C., Liebert, J., Kleinman, S. J., et al. 2003, ApJ, 126, 1023 [CrossRef] [Google Scholar]
- Herman, P. S., & Sando, K. M. 1978, J. Chem. Phys., 68, 1152 [NASA ADS] [Google Scholar]
- Hernando, A., Barranco, M., Mayol, R., et al. 2010, J. Low Temp. Phys., 158, 105 [NASA ADS] [CrossRef] [Google Scholar]
- Homeier, D., Allard, N., Johnas, C. M. S., Hauschildt, P. H., & Allard, F. 2007, in Astronomical Society of the Pacific Conference Series, 372, 15th European Workshop on White Dwarfs, eds. R. Napiwotzki, & M. R. Burleigh, 277 [Google Scholar]
- Hou Yip, K., Changeat, Q., Edwards, B., et al. 2020, in European Planetary Science Congress, EPSC2020-67 [Google Scholar]
- Jablonski, A. 1945, Phys. Rev., 68, 78 [NASA ADS] [CrossRef] [Google Scholar]
- Jablonski, A. 1948, Phys. Rev., 73, 258 [NASA ADS] [CrossRef] [Google Scholar]
- Julienne, P. S., & Mies, F. H. 1986, Phys. Rev. A, 34, 3792 [NASA ADS] [CrossRef] [Google Scholar]
- Kampen, N. G. V. 1974, Physica, 74, 215 [NASA ADS] [CrossRef] [Google Scholar]
- Kielkopf, J. F. 1980, J. Phys. B: At. Mol. Opt. Phys., 13, 3813 [NASA ADS] [CrossRef] [Google Scholar]
- Kielkopf, J. F., & Allard, N. F. 2008, in 19th International Conference on Spec- trai Line Valladolid, Spain, June 16-20, 2008 (New York: AIP Conference Proceeding) [Google Scholar]
- Kielkopf, J. F., Allard, N. F., Alekseev, V. A., et al. 2017, J. Phys. Conf. Ser., 810, 012023 [NASA ADS] [CrossRef] [Google Scholar]
- Kubo, R. 1962a, J. Phys. Soc. Japan, 17, 1100 [NASA ADS] [CrossRef] [Google Scholar]
- Kubo, R. 1962b, J. Math. Phys., 4, 174 [Google Scholar]
- Levin, F. S., & Shertzer, J. 1985, Phys. Rev. A, 32, 3285 [NASA ADS] [CrossRef] [Google Scholar]
- Liebert, J., Reid, I., Burrows, A., et al. 2000, ApJ, 533, L155 [NASA ADS] [CrossRef] [Google Scholar]
- Lortet, M. C., & Roueff, E. 1969, A&A, 3, 462 [NASA ADS] [Google Scholar]
- Mateo, D., Hernando, A., Barranco, M., Mayol, R., & Pi, M. 2011, Phys. Rev. B, 83, 174505 [NASA ADS] [CrossRef] [Google Scholar]
- McCartan, D. G., & Farr, J. M. 1976, J. Phys. B: At. Mol. Opt. Phys., 9, 985 [NASA ADS] [CrossRef] [Google Scholar]
- Merzbacher, E. 1998, Quantum Mechanics, 3rd edn. (Wiley) [Google Scholar]
- Mies, F. H., Julienne, P. S., Band, Y. B., & Singer, S. J. 1986, J. Phys. B: At. Mol. Opt. Phys., 19, 3249 [NASA ADS] [CrossRef] [Google Scholar]
- Mullamphy, D. F. T., Peach, G., Venturi, V., Whittingham, I. B., & Gibson, S. J. 2007, J. Phys. B: At. Mol. Opt. Phys., 40, 1141 [NASA ADS] [CrossRef] [Google Scholar]
- Nakayama, A., & Yamashita, K. 2001, J. Chem. Phys., 114, 780 [NASA ADS] [CrossRef] [Google Scholar]
- Nikolov, N. K., Sing, D. K., Spake, J. J., et al. 2022, MNRAS, 515, 3037 [NASA ADS] [CrossRef] [Google Scholar]
- Oppenheimer, B. R., Saumon, D., Hodgkin, S. T., et al. 2001, ApJ, 550, 448 [NASA ADS] [CrossRef] [Google Scholar]
- Oreshenko, M., Kitzmann, D., Márquez-Neila, P., et al. 2020, AJ, 159, 6 [Google Scholar]
- Pascale, J. 1983, Phys. Rev. A, 28, 632 [NASA ADS] [CrossRef] [Google Scholar]
- Peach, G., Yurchenko, S., Chubb, K., et al. 2020, Contrib. Astron. Observ. Skalnate Pleso, 50, 193 [NASA ADS] [Google Scholar]
- Phillips, M. W., Tremblin, P., Baraffe, I., et al. 2020, A&A, 637, A38 [NASA ADS] [CrossRef] [EDP Sciences] [Google Scholar]
- Rossi, F., & Pascale, J. 1985, Phys. Rev. A, 32, 2657 [CrossRef] [Google Scholar]
- Roueff, E., & van Regemorter, H. 1969, A&A, 1, 69 [NASA ADS] [Google Scholar]
- Royer, A. 1972, Phys. Rev. A, 6, 1741 [NASA ADS] [CrossRef] [Google Scholar]
- Royer, A. 1974, Can. J. Phys., 52, 1816 [NASA ADS] [CrossRef] [Google Scholar]
- Royer, A. 1978, Acta Phys. Pol. A, 54, 805 [Google Scholar]
- Royer, A. 1980, Phys. Rev. A, 22, 1625 [NASA ADS] [CrossRef] [Google Scholar]
- Samra, D., Helling, C., Chubb, K. L., et al. 2023, A&A, 669, A142 [NASA ADS] [CrossRef] [EDP Sciences] [Google Scholar]
- Sando, K. M., & Herman, P. S. 1983, in Spectral Line Shapes, 2 (New York: Walter de Gruyter), 497 [NASA ADS] [Google Scholar]
- Schneider, B., & Cohen, J. S. 1974, J. Chem. Phys., 61, 3240 [NASA ADS] [CrossRef] [Google Scholar]
- Stienkemeier, F., Higgins, J., Callegari, C., et al. 1996, Z. Physik D At. Mol. Clusters, 38, 253 [NASA ADS] [CrossRef] [Google Scholar]
- Szudy, J., & Baylis, W. 1975, JQSRT, 15, 641 [CrossRef] [Google Scholar]
- Szudy, J., & Baylis, W. 1996, Phys. Rep., 266, 127 [NASA ADS] [CrossRef] [Google Scholar]
- Thakkar, A. J., & Koga, T. 1994, Phys. Rev. A, 50, 854 [NASA ADS] [CrossRef] [Google Scholar]
- Theodorakopoulos, G., Petsalakis, I. D., Nicolaides, C. A., & R.J. Buenker. 1987, J. Phys. B, 20, 2339 [NASA ADS] [CrossRef] [Google Scholar]
- Werner, H. J., Knowles, P. J., Lindh, R., Manby, F. R., & Schutz, M. 2006, WIREs Comput Mol Sci, 2, 242 [Google Scholar]
- Zhu, C., Babb, J. F., & Dalgarno, A. 2006, Phys. Rev. A, 73, 012506 [NASA ADS] [CrossRef] [Google Scholar]
All Tables
Comparison of experimental and theoretical broadening rates ω/nHe (10−20 cm−1/cm−3) of the Na resonance lines.
Computed broadening rates ω/nHe (1020 cm−1/cm−3) of Na resonance lines perturbed by He collisions. Values are given from both semiclassical (sc) and quantum (BL) calculations.
Computed shift rates d/nHe (10−20 cm−1/cm−3) of Na resonance lines perturbed by He collisions. Values are given from both semiclassical (sc) and quantum (BL) calculations.
All Figures
|
Fig. 1 Potential curve for the 3s X 2Σ1/2 state of Na–He Dell’Angelo et al. (2012). The Na–He potentials of Nakayama & Yamashita (2001, dotted line) and Pascale (1983, dashed blue line) are superimposed. |
| In the text | |
|
Fig. 2 Potential curves of the Na–He molecule for ab initio potentials of Dell’Angelo et al. (2012, solid line) compared to pseudo-potentials of Pascale (1983, dashed blue line). |
| In the text | |
|
Fig. 3 Details of the intermediate range of potential curves for the asymptotic Na 3p state with (solid line) and without (dashed line) spin–orbit coupling. The Na–He energies are given relative to the center of gravity of the 3p state from the ab initio potentials calculated by Dell’Angelo et al. (2012). The prior work of Nakayama & Yamashita (2001) is superimposed (dotted line). |
| In the text | |
|
Fig. 4 ΔV(R) Dell’Angelo et al. (2012, dashed black line) compared to Pascale (1983, dashed blue line) and the temperature dependence of modulated dipole D(R) (solid line) corresponding to the 3s X → 3p B P3/2 transition of the Na D2 line. |
| In the text | |
|
Fig. 5 Variation of the absorption cross section of the D2 component with temperature (from top to bottom: T = 3000, 1000, 400, 250, and 150 K, and nHe = 1020 cm−3). The corresponding profile for T = 3000 K using pseudo-potentials of Pascale (1983) is overplotted (dashed blue line). The D1 component for T = 3000 K using ab initio potentials of Dell’Angelo et al. (2012) is also overplotted (dashed red line). |
| In the text | |
|
Fig. 6 Variation of the absorption cross section of the D2 component with He density (T = 5000 K, nHe = 5 × 10²¹ (solid line), 2 × 10²¹ (dashed line), and 1021 (dotted line) cm−3). |
| In the text | |
|
Fig. 7 Variation of the absorption cross section of the Na D2 line with helium density (T = 5000 K, nHe = 5 × 10²¹ solid line, and 1022 cm−3 dashed line). |
| In the text | |
|
Fig. 8 ΔV and variation with temperatures of D(R), the Na–He modulated dipole for the D1 component due to the transition 3s X 2Σ+ → 3p A 2Π1/2. The vertical line is at the maximum of ΔV(R). |
| In the text | |
|
Fig. 9 Variation with He atom density of the D1 component at T = 1 K. We note that nHe varies from 2−5 × 1020 cm−3 (extracted from Allard et al. 2013). |
| In the text | |
|
Fig. 10 Variation with temperature of the broadening rate (w/nHe) of the D2 (solid line) and D1 (dashed line) resonance lines of Na perturbed by He collisions using the potentials of Dell’Angelo et al. (2012, red curves), Pascale (1983, blue curves), van der Waals potentials (black dotted). The rates are in units of 10−20 cm−1/cm−3. |
| In the text | |
|
Fig. 11 Variation with temperature of the broadening rate (ω/nHe) and of the shift rate (d/nHe) of the D1 (red) and D2 (blue) resonance lines of Na perturbed by He collisions: BL(circles), semiclassical (stars). The rates are in units of 10−20 cm−1/cm−3. |
| In the text | |
|
Fig. 12 Comparison of theoretical broadening rates (ω/nHe) for the D1 (red) and D2 (blue) resonance lines, using the power-law fitted temperature dependence from the present work (solid), Eqs. (11)–(12), with the power laws obtained by Mullamphy et al. (2007) (dashed). The rates are in units of 10−20 cm−1/cm−3. |
| In the text | |
|
Fig. 13 Comparison of the broadening rate (ω/nHe) and of the shift rate (d/nHe) for the unresolved 3P–3S doublet according to quantum calculations of the current work (blue circles) and as reported by Peach et al. (2020, dark squares). The rates are in units of 10−20 cm−1/cm−3. |
| In the text | |
|
Fig. A.1 Absorption cross section of the Na D2 component at T =5000 K, nHe=1 × 10²¹ (solid line) compared to the corresponding Lorentzian profile (dashed line)). |
| In the text | |
|
Fig. D.1 Comparison of the broadening rate (ω/nHe) and of the shift rate (d/nHe) of the D2 line compared to the contribution of the different transitions B Σ1/2-X and A Π3/2-Χ: BL (circles) and semiclassical (stars). The rates are in units of 10−20 cm−1/cm−3. |
| In the text | |
Current usage metrics show cumulative count of Article Views (full-text article views including HTML views, PDF and ePub downloads, according to the available data) and Abstracts Views on Vision4Press platform.
Data correspond to usage on the plateform after 2015. The current usage metrics is available 48-96 hours after online publication and is updated daily on week days.
Initial download of the metrics may take a while.