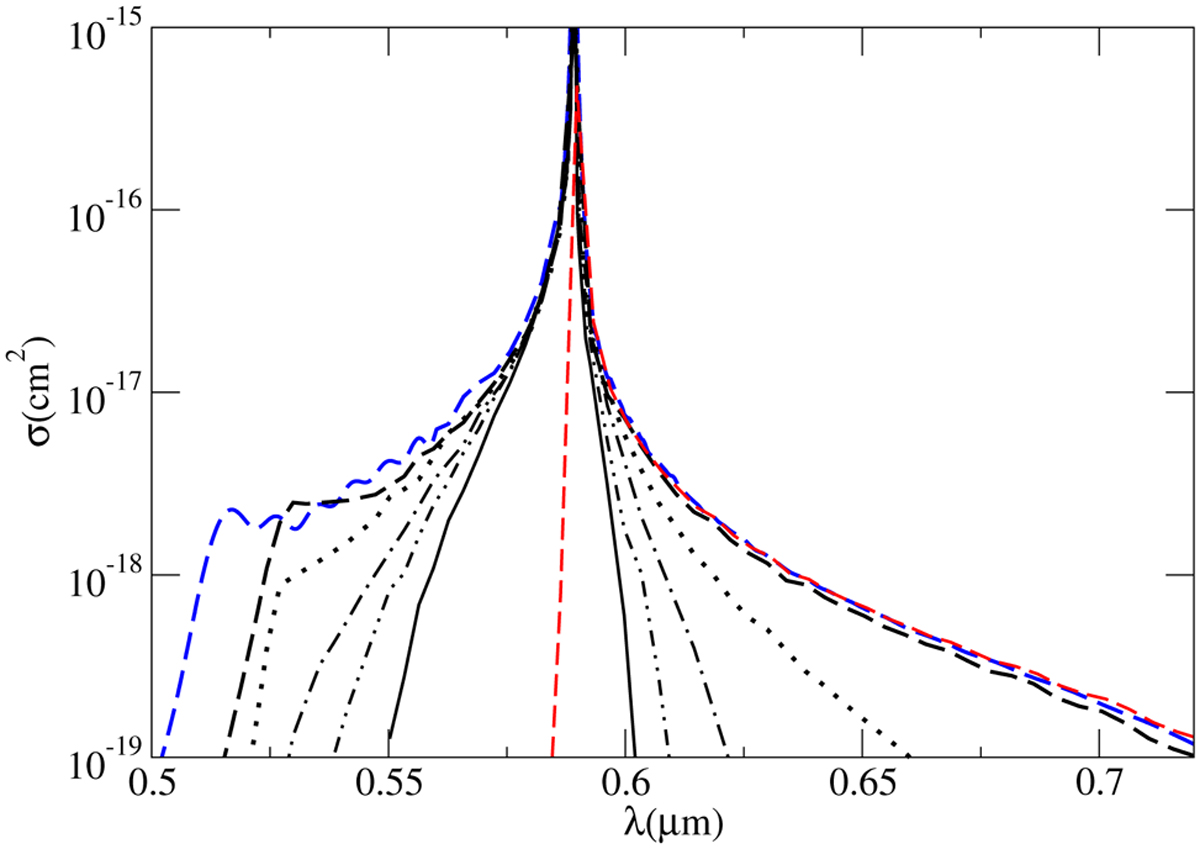
Fig. 5
Download original image
Variation of the absorption cross section of the D2 component with temperature (from top to bottom: T = 3000, 1000, 400, 250, and 150 K, and nHe = 1020 cm−3). The corresponding profile for T = 3000 K using pseudo-potentials of Pascale (1983) is overplotted (dashed blue line). The D1 component for T = 3000 K using ab initio potentials of Dell’Angelo et al. (2012) is also overplotted (dashed red line).
Current usage metrics show cumulative count of Article Views (full-text article views including HTML views, PDF and ePub downloads, according to the available data) and Abstracts Views on Vision4Press platform.
Data correspond to usage on the plateform after 2015. The current usage metrics is available 48-96 hours after online publication and is updated daily on week days.
Initial download of the metrics may take a while.