| Issue |
A&A
Volume 618, October 2018
|
|
|---|---|---|
| Article Number | L7 | |
| Number of page(s) | 5 | |
| Section | Letters to the Editor | |
| DOI | https://doi.org/10.1051/0004-6361/201834135 | |
| Published online | 23 October 2018 | |
Letter to the Editor
Raman-scattered laser guide-star photons to monitor the scatter of astronomical telescope mirrors
1
European Southern Observatory (ESO), Av. Alonso de Córdova 3107, 763 0355 Vitacura, Santiago, Chile
e-mail: frederic.vogt@alumni.anu.edu.au
2
European Southern Observatory (ESO), Karl-Schwarzschild-Str. 2, 85748 Garching, Germany
3
University of Birmingham School of Physics and Astronomy, Edgbaston, Birmingham, UK
4
Instituto de Física y Astronomía, Universidad de Valparaíso, Avda. Gran Bretaña 1111, Valparaíso, Chile
Received:
24
August
2018
Accepted:
28
September
2018
The first observations of laser guide-star photons that are Raman-scattered by air molecules above the Very Large Telescope (VLT) were reported in June 2017. The initial detection came from the Multi-Unit Spectroscopic Explorer (MUSE) optical integral field spectrograph, following the installation of the 4 Laser Guide Star Facility (4LGSF) on Unit Telescope 4 (UT4) of the VLT. In this Letter, we delve further into the symbiotic relationship between the 4LGSF laser guide-star system, the UT4 telescope, and MUSE by monitoring the spectral contamination of MUSE observations by Raman photons over a 27-month period. This dataset reveals that dust particles deposited on the primary and tertiary mirrors of UT4, which are responsible for a reflectivity loss of ∼8% at 6000 Å, contribute (60 ± 5)% to the laser line fluxes detected by MUSE. The flux of Raman lines, which contaminates scientific observations that are acquired with optical spectrographs, thus provides a new, non-invasive means to monitor the evolving scatter properties of the mirrors of astronomical telescopes that are equipped with laser guide-star systems.
Key words: molecular processes / scattering / atmospheric effects / instrumentation: adaptive optics / telescopes / instrumentation: spectrographs
© ESO 2018
1. Introduction
Optical photons propagating through the atmosphere may experience a range of scattering and diffusion mechanisms: some, such as Rayleigh and Mie scattering, are elastic processes. Raman scattering, on the other hand, is an inelastic process, through which a photon looses energy by exciting the ro-vibrational modes of molecules (Herzberg 1950; Herzberg 1945; Telle et al. 2007). The physics of Raman scattering has been used for many years to study the content and structure of the atmosphere (Leonard 1967; Cooney 1968; 1970; 1972; Melfi et al. 1969; Melfi 1972; Penney & Lapp 1976; Keckhut et al. 1990; Whiteman et al. 1992; Heaps & Burris 1996; Behrendt et al. 2002). In the astronomical context, Raman scattering associated with the use of a laser guide-star system was only recently reported, for the first time, with the Multi-Unit Spectroscopic Explorer (MUSE; Bacon et al. 2010) integral field spectrograph at the Very Large Telescope (VLT) on Cerro Paranal (Vogt et al. 2017), in the wake of the installation of the 4 Laser Guide Star Facility (4LGSF; Bonaccini Calia et al. 2014a). Since then, Raman scattering of laser guide-star photons has also been observed with the Gran Telescopio Canarias at the Observatorio del Roque de los Muchachos in La Palma (Lombardi et al. 2017), with the Gemini South telescope on Cerro Pachón in Chile (Marin et al. 2018), and with the Subaru telescope on Mauna Kea in Hawaii (Kawaguchi et al. 2018).
In normal operations, neither the laser spots created in the sodium layer at ∼90 km altitude nor the bright uplink laser beams, visible through Rayleigh, Mie, and Raman scattering, fall within the MUSE Wide Field Mode (WFM) field of view of 1′ × 1′ (see Fig. 2 in Vogt et al. 2017). We also note that in the WFM asterism, the uplink laser beams are diverging, and never pass directly above the primary mirror. Although pictures of the 4LGSF in operation tend to visually suggest otherwise, the laser guide-stars are located ∼62′′(≡ 27 m at 90 km of altitude) away from the center of the MUSE field of view, to be compared with the location of the laser launch telescopes, 5.51 m away from the center of the primary mirror. These facts imply the existence of one (or more) mechanism(s) that is (are) responsible for bringing the laser photons, scattered while on their way up to the sodium layer, into the scientific field of view of MUSE.
In this Letter, we identify one of these mechanisms, scattering off dust particles on the primary and tertiary mirrors of UT4, and demonstrate that it is responsible for (60 ± 5)% of the Raman-scattered photons measured by MUSE in WFM, when the reflectivity of the primary mirror is reduced by ∼8% at 6000 Å. We do so through dedicated monitoring observations of the laser lines in MUSE WFM observations, which form the direct continuation of the series of experiments presented by Vogt et al. (2017). In the remainder of this Letter, all wavelengths are quoted in air, unless explicitly mentioned otherwise. When we refer to laser photons, we mean photons that were originally emitted by the laser guide-star system, regardless of whether they were subsequently Rayleigh-scattered, Mie-scattered, Raman-scattered, or absorbed and re-emitted by a sodium atom.
2. Observations and data reduction
The MUSE observations that we consider here consist of several single 60 s, 120 s, 180 s, or 300 s exposures. During each exposure, the telescope is tracking and guiding on an empty field: “empty” in the sense that the field is chosen to contain no entry in the USNO-B1 catalog (complete down to V = 21 mag; Monet et al. 2003). For each MUSE exposure, the guide-star asterism is the nominal WFM-AO one: a square in which the laser guide-stars are located 62″ away from the field center. These observations were first acquired in the last commissioning run dedicated to the 4LGSF system (stand-alone), and were subsequently performed after each installation of a new component of the Adaptive Optics Facility (AOF; Arsenault et al. 2013), including the Deformable Secondary Mirror (DSM; Arsenault et al. 2006; Briguglio et al. 2014) and GALACSI (Stuik et al. 2006; La Penna et al. 2016). Sequences were also acquired after the recoating of the primary and tertiary mirror of UT4 in mid-2017, and in mid-2018 following the installation of NanoBlack™ foil (initially over a first and subsequently over all the telescope spiders) to mitigate the so-called low-wind effect for MUSE narrow field mode observations (Milli et al. 2018).
We stress here that the same observation procedure was followed each time. In particular, the 4LGSF system was in all cases operated manually, in a stand-alone mode that makes MUSE entirely oblivious to it. The DSM was operated in static (no-AO) mode, even after the installation of the GALACSI AO module. The only exceptions were a) one MUSE exposure within the 2017-04-15 sequence acquired with the AO loop closed for comparison purposes (no difference in the flux of the Raman lines was observed), and b) the observations acquired on 2017-08-15. These observations were acquired in the afternoon, with the telescope in parked position, and the dome closed. In this specific case, no active optics correction could be applied to the primary mirror, and the exact size (and shape) of the 4LGSF asterism is uncertain.
All the individual exposures were fetched from the ESO archive, and reduced using the MUSE pipeline 2.2.0 (Weilbacher et al. 2015) within the REFLEX V2.8.5 environment (Freudling et al. 2013). We did not perform any telluric subtraction or any sky subtraction. All the data were processed using a unique set of master calibrations from late December 2017, which implied the assembly of a custom-build REFLEX workflow to do so. The set of master calibrations include a master bias, a master lamp flat, a master twilight flat, a master wavelength calibration, a master line spread function, a master geometry frame, and a master instrument response.
The following reasons motivate our decision to employ a unique set of master calibrations (including a master response function) for the data reduction, rather than a mixed set. First, all the MUSE observations presented in this Letter were acquired during commissioning or technical nights, and were not all calibrated with the same level of precision. For example, illumination corrections (useful to account for the temperature fluctuations within the instrument throughout a night) or flux standard stars were or could not be acquired in all cases. Second, the availability of daily calibrations varies from sequence to sequence. Third, the transmission of the telescope improved with the recoating of its primary and tertiary mirrors (M1 and M3) in August 2017, but since dust particles on these mirror are responsible for a large part of the contamination of the MUSE exposures by laser photons (see below), the flux of laser lines decreased post-recoating.
All these reasons led to hard-to-quantify variations in the quality of local calibrations for each observing sequence. Given the overall stability demonstrated by the MUSE instrument over the years, and because all our observing nights were subject to clear or photometric conditions (with the exception of 2018-07-19 and 2018-09-13, which had thin cirrus), we thus opted for a single set of master calibrations. We estimate that this choice can lead to a mismatch in the derived line fluxes at a 5% level for exposures acquired on a given night, and at an additional 5% level for exposures acquired on different nights. We note that these error levels are always smaller than the signals we discuss in the next section.
3. Results
For every MUSE exposure, we extracted the integrated spectra from a central circular region of the reduced datacube, 30″ in diameter. We then measured the associated flux of the main laser line (at 5889.959 Å, the residual signal visible through the MUSE notch filter; Vogt et al. 2017), of the N2(ν 1 ← 0) Raman vibrational line at 6827.17 Å, and of the O2(ν 1 ← 0) Raman vibrational line at 6484.39 Å. The latter two lines consist of the entire Q branch (Herzberg 1950), which is spectrally unresolved by MUSE. For simplicity, we refer to them as the N2 and O2 Raman lines in the remainder of this article. The line fluxes were derived from the least-squares fit of a model composed of a single Gaussian component (for the laser lines), a constant background level, and single Gaussian components for the near-by sky lines, over spectral windows of 90 Å, 50 Å, and 35 Å wide for the 5889.959 Å, N2 , and O2 lines, respectively. We fixed the dispersion to 1.2 Å for all the lines, and the wavelength of the sky lines to 6828.45 Å, 6833.65 Å, and 6841.24 Å (near the N2 Raman line) and 6484.39 Å, 6465.3 Å, 6470.6 Å, and 6477.5 Å (near the O2 Raman line). This approach ensures robust and consistent results, even for the frames that have a lower signal-to-noise ratio (S/N) in the laser lines. The chosen integration aperture of 30″ in diameter ensures that the N2 and O2 lines are always detected with S/N ≥ 25. Representative examples of the fitting outcome for the O2 and N2 lines are presented in Fig. 1 for data acquired on 2017-04-16.
The derived O2 line fluxes FO2(ν1 ← 0) for all observations, normalized to the measurement of (33.7 ± 0.9)×10−16 erg s−1 cm−2 acquired on 2017-04-16, are presented as a function of time in Fig. 2. Each symbol, color-coded as a function of the airmass of the observation, corresponds to a single exposure. The error bars (often smaller than the symbols) indicate the 3σ fitting uncertainty only, and do not include the error associated with using a uniform set of master calibrations. For simplicity, we focused our attention on the O2 Raman line as a proxy for all the laser lines because a) it is detected with a higher S/N than the main laser line at 5889.959 Å (seen through the notch filter), and b) its fitting is not strongly affected by underlying skylines, unlike the N2 Raman line (see Fig. 1). We also note that the behavior of the main laser line flux at 5889.959 Å and the N2 Raman line is qualitatively identical to that of the O2 Raman line.
The asterism size associated with the observations performed on 2017-08-15 is uncertain: it most certainly was not a perfect square. The very nature of this observation, performed when the dome was closed, prevented us from confirming the asterism shape and size using the laser-pointing camera (Bonaccini Calia et al. 2014b; Centrone et al. 2016). We can only be certain that the laser-launch telescopes must have been pointing somewhere within their allowed mechanical range of 440″. This range is equivalent to a maximum positional uncertainty of ∼6 cm at 30 m of height, implying that within the volume of the UT4 dome, the position of the laser uplink beams during the closed-dome observations is still very consistent with the open-dome cases.
The close-dome exposure reveals that the intensity of the main 5889.959 Å laser line seen by MUSE is 1800 ± 120 % stronger than when the dome is open. This is expected: as illustrated in Fig. 3, the laser beams directly hit the reflective metallic surface of the dome structure in this configuration, leading to a very high amount of reflections of laser photons within the dome volume. Despite these numerous reflections on the dome surfaces, the integrated travel path of the laser photons in the air inside the dome is not sufficient to reach the open-dome flux level of the N2 and O2 Raman lines: as illustrated in Fig. 2, the intensity of the Raman lines in the closed-dome exposure is 6.0 ± 0.5 % of the maximum, pre-recoating, open-dome exposure. This closed-dome test thus clearly indicates that the majority of the laser photons detected by MUSE in normal operations originate from outside of the dome environment.
Next, we turn our attention to the open-dome observations. We find no correlation between the flux of the laser lines and the air pressure on the ground, the relative humidity at 30 m above ground, the precipitable water vapor, or the density of 0.5 μm and 5 μm dust particles at 20 m above ground at the time of the observations. Exposures acquired pre- and post-DSM installation are largely consistent with one another, indicating that replacing the original secondary mirror of UT4 with the new DSM did not affect the mechanism(s) responsible for bringing laser photons inside of the MUSE WFM field of view.
The same cannot be said for the recoating of M1 and M3 that took place in late August 2017. The recoating process led to a decrease of (60 ± 5)% in intensity of the laser lines seen by MUSE with respect to pre-recoating levels.
The primary and tertiary mirrors of UT4 are normally recoated every 18 months (Giordano 2004), but this recoating was the first since August 2009. This delay was driven by a general maintenance need of the Paranal recoating plant, together with a problem with the grain size of the sputtering target. The plant returned to full operations in mid-2016. Between August 2009 and August 2017, M1 and M3 underwent monthly CO2 cleanings, and one full manual wash in September 2013. Following its 2017 recoating, the reflectivity of the primary mirror at 6240 Å increased from 81% to 90%, whereas its scatter decreased from 15.3% to 0.3%, measured using a CT-7 reflectometer-scatterometer in several zones of 6 mm in diameter. The positive effect of the recoating is also confirmed by the throughput improvement seen by MUSE measured from the observations of spectrophotometric standard stars, as summarized in Table 1.
We explain the decrease in intensity of the laser lines in MUSE exposures post-recoating with the removal of dust particles from the surface of M1 and M3. A fraction of the Rayleigh-, Mie- and Raman-scattered laser photons generated in the laser up-link beams, primarily in the initial, densest 35 km of the atmosphere, naturally fall onto the surface of these mirrors: initially, with an angle such that they do not find themselves heading toward the MUSE WFM field of view. Dust particles on the surface of M1 and M3 can act as a scattering source, however, imparting an angular kick to the laser photons that redirects some of them into the scientific field of view (Elson et al. 1979; Spyak & Wolfe 1992a,b; Holzlöhner 2017). As the scattering occurs on the surface of mirrors in the optical path, no amount of baffling downstream from M3 can stop the scattered laser photons from reaching the MUSE detectors: this is consistent with the lack of difference in the Raman line fluxes pre- and post-GALACSI installation.
The fact that the scattering properties of the primary mirror of UT4 decreased to < 1% post-recoating indicates that the laser photons still detected by MUSE immediately after the recoating must enter its field of view through a distinct set of mechanisms that remain formally unidentified at the time of publication of this Letter. The microroughness of the mirror surface, which ought to dominate the clean-mirror scatter at optical wavelengths (Spyak & Wolfe 1992b), is one of the plausible culprits. For any given state of the primary mirror, we note that the intensity of the laser lines detected by MUSE is also airmass dependent: their flux increases by (30 ± 5)% at an airmass of 2, when compared to an airmass of 1 (see Fig. 2).
In the 13 months following the recoating, the intensity of the laser lines detected by MUSE has increased by ∼2 ± 1 % per month (with respect to the maximum line flux measured prior to the recoating), in spite of the monthly CO2 cleanings. This is not surprising, since CO2 cleaning (Zito 1990) is known a) to have difficulties removing 50–100 μm particles (Kimura et al. 1995), and b) to be somewhat less efficient when performed with a baseline longer than 1–2 weeks (Toomey & Hall 1994). Our measurements imply that a pre-recoating Raman contamination level of MUSE exposures might be reached in a total of 30 ± 7 months. This is somewhat shorter than the four years separating the 2017 recoating from the preceding full manual wash of 2013. The atmospheric aerosol content on Cerro Paranal, however, is known to be subject to strong seasonal variations (Giordano & Sarazin 1994), and the increase in mirror scatter is likely not a linear process. Measurements of the Raman line intensities in MUSE WFM-AO observations with a higher temporal frequency than presented in this Letter is thus essential to enable more accurate long-term predictions of the M1 and M3 scatter.
Altogether, our dedicated set of MUSE observations acquired alongside the 4LGSF system over a 27-month period reveal the clear impact of dust on the primary and tertiary mirrors of UT4. The Raman lines in MUSE WFM-AO observations, unaffected by the notch filter, appear as an excellent non-invasive means to characterize the evolution of the scattering properties of M1 and M3 over time in a qualitative sense. These lines are now being fit within the updated MUSE data reduction pipeline for AO observations, initially as part of the correction of the sky background. As such, they can be monitored on any night when MUSE WFM-AO observations are acquired. In practice, this corresponds to a monitoring frequency of a sub-hourly cadence on a quasi-nightly basis, given the robustness of the entire AOF installation in terms of operations. This frequency could, for example, allow assessing the efficiency of the regular CO2 cleanings, and could facilitate the implementation of a condition-based mirror washing or recoating. This cost-free (time-wise) and non-invasive approach to monitoring the scatter of telescope mirrors may also prove to be of use for other facilities with a laser guide-star system that feeds an optical spectrograph: for example, the Extremely Large Telescope, which is to be equipped with up to eight 22 Watt Na lasers to feed corrected wavefronts to the HARMONI optical-infrared integral field spectrograph (Thatte et al. 2010, 2014).
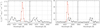 |
Fig. 1. Left: comparison of the spectral fit of the O2 Raman line region from two consecutive MUSE exposures, with and without laser propagation. The black dots trace the spectral flux density F λ integrated within the central 30″ of the MUSE field of view. The dark gray line denotes the sky and background components (only) of the fit. The full fit (which includes the Raman line) is shown in red. For the observations acquired with no laser propagation, the flux of the Raman lines is fixed at 0. Right: idem, but for the spectral region around the N2 Raman line. |
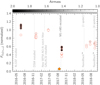 |
Fig. 2. Integrated O2 line fluxes FO2(ν1 ← 0) extracted from MUSE observations of empty sky fields, acquired with the nominal WFM asterism of laser guide-stars (62″ in radius), normalized to the pre-recoating flux level. Each symbol, color-coded as a function of the airmass of the observation, corresponds to a single exposure. The time lines of specific events affecting UT4 are all indicated. The yellow diamond corresponds to the exposure acquired with the telescope in parked position, and the four 22 Watt lasers propagating in the closed dome on 2017-08-15 (see Fig. 3). |
 |
Fig. 3. Picture of the interior of UT4 acquired on 2017-08-15, when the dome was closed, the telescope parked, and all four lasers from the 4LGSF propagated. LGS1 and LGS4 are visible in the picture; their beam hits the cylindrical structure of an air-conditioning duct on the dome roof. The overall glow in the picture is evidence of the high amount of scattering of laser photons by the dome surface. All upper and lower lights in the dome were switched off during the test. |
Improvement in the total throughput of MUSE (instrument+telescope) following the recoating of the primary and tertiary mirror of UT4 in August 2017.
Acknowledgments
We are grateful to Angela Cortes, François Rigaut, and Céline d’Orgeville for enlightening discussions, to Claudia Reyes Saez for her support in operating the 4LGSF in stand-alone mode, to Philippe Duhoux and Stefan Stroebele for their support during the observations acquired in September 2017, and to Lodovico Coccato for his help in setting up a custom REFLEX workflow to reduce MUSE data using master calibration files. We thank the anonymous referee for their constructive feedback. This research has made use of FCMAKER (Vogt 2018a,b), a PYTHON module to create ESO-compliant finding charts for OBs on p2. FCMAKER relies on MATPLOTLIB (Hunter 2007), ASTROPY, a community-developed core PYTHON package for Astronomy (Astropy Collaboration 2013), ASTROQUERY, a package hosted at https://astroquery.readthedocs.io which provides a set of tools for querying astronomical web forms and databases (Ginsburg et al. 2017), ASTROPLAN (Morris et al. 2018), APLPY, an open-sourcevplotting package for PYTHON (Robitaille & Bressert 2012), and MONTAGE, funded by the National Science Foundation under Grant Number ACI-1440620 and previously funded by the National Aeronautics and Space Administration’s Earth Science Technology Office, Computation Technologies Project, under Cooperative Agreement Number NCC5-626 between NASA and the California Institute of Technology. FCMAKER uses the VizieR catalogue access tool, CDS, Strasbourg, France. The original description of the VizieR service was published in Ochsenbein et al. (2000). FCMAKER makes use of data from the European Space Agency (ESA) mission Gaia (https://www.cosmos.esa.int/gaia), processed by the Gaia Data Processing and Analysis Consortium (DPAC, https://www.cosmos.esa.int/web/gaia/dpac/consortium). Funding for the DPAC has been provided by national institutions, in particular the institutions participating in the Gaia Multilateral Agreement. In particular, FCMAKER uses data from the Gaia (Gaia Collaboration 2016) Data Release 2 (Gaia Collaboration 2018). FCMAKER also uses data from the Second Digitized Sky Survey (DSS 2). The “Second Epoch Survey” of the southern sky was produced by the Anglo-Australian Observatory (AAO) using the UK Schmidt Telescope. Plates from this survey have been digitized and compressed by the STScI. The digitized images are copyright (c) 1993–1995 by the Anglo-Australian Telescope Board. The “Equatorial Red Atlas” of the southern sky was produced using the UK Schmidt Telescope. Plates from this survey have been digitized and compressed by the STScI. The digitized images are copyright (c) 1992–1995, jointly by the UK SERC/PPARC (Particle Physics and Astronomy Research Council, formerly Science and Engineering Research Council) and the Anglo-Australian Telescope Board. The compressed files of the “Palomar Observatory - Space Telescope Science Institute Digital Sky Survey” of the northern sky, based on scans of the Second Palomar Sky Survey, are copyright (c) 1993–1995 by the California Institute of Technology. All DSS2 material not subject to one of the above copyright provisions is copyright (c) 1995 by the Association of Universities for Research in Astronomy, Inc., produced under Contract No. NAS 5-26555 with the National Aeronautics and Space Administration. This research has also made use of MPFIT, a Python script that uses the Levenberg-Marquardt technique (Moré 1978) to solve least-squares problems, based on an original FORTRAN code that is part of the MINPACK-1 package, of the ALADIN interactive sky atlas (Bonnarel et al. 2000), of SAOIMAGE DS9 (Joye & Mandel 2003) developed by Smithsonian Astrophysical Observatory, of NASA’s Astrophysics Data System, and of the services of the ESO Science Archive Facility. Based on observations made with ESO Telescopes at the La Silla Paranal Observatory. All the observations described in this article are freely available online from the ESO Data Archive. Y. L. J. acknowledges support from CONICYT PAI (Concurso Nacional de Inserción en la Academia 2017) No. 79170132.
References
- Arsenault, R., Hubin, N., Stroebele, S., et al. 2006, The Messenger, 123, 11 [NASA ADS] [Google Scholar]
- Arsenault, R., Madec, P. Y., Paufique, J., et al. 2013, Proc. Third AO4ELT Conf., 118 [Google Scholar]
- Astropy Collaboration (Robitaille, T. P., et al.) 2013, A&A, 558, A33 [NASA ADS] [CrossRef] [EDP Sciences] [Google Scholar]
- Bacon, R., Accardo, M., Adjali, L., et al. 2010, in Ground-Based and Airborne Instrumentation for Astronomy III, Proc. SPIE, 7735, 773508 [Google Scholar]
- Behrendt, A., Nakamura, T., Onishi, M., Baumgart, R., & Tsuda, T. 2002, Appl. Opt., 41, 7657 [NASA ADS] [CrossRef] [PubMed] [Google Scholar]
- Bonaccini Calia, D., Centrone, M., Pedichini, F., et al. 2014a, in Adaptive Optics Systems IV, Proc. SPIE, 9148, 91483P [CrossRef] [Google Scholar]
- Bonaccini Calia, D., Hackenberg, W., Holzlöhner, R., Lewis, S., & Pfrommer, T. 2014b, Adv. Opt. Technol., 3, 345 [Google Scholar]
- Bonnarel, F., Fernique, P., Bienaymé, O., et al. 2000, A&AS, 143, 33 [NASA ADS] [CrossRef] [EDP Sciences] [Google Scholar]
- Briguglio, R., Biasi, R., Xompero, M., et al. 2014, in Adaptive Optics Systems IV, Proc. SPIE, 9148, 914845 [CrossRef] [Google Scholar]
- Centrone, M., Bonaccini Calia, D., Pedichini, F., et al. 2016, Proc. SPIE, 9909, 99095L [CrossRef] [Google Scholar]
- Cooney, J. 1968, Appl. Phys. Lett., 12, 40 [NASA ADS] [CrossRef] [Google Scholar]
- Cooney, J. 1970, J. Appl. Meteorol., 9, 182 [NASA ADS] [CrossRef] [Google Scholar]
- Cooney, J. 1972, J. Appl. Meteorol., 11, 108 [NASA ADS] [CrossRef] [Google Scholar]
- Elson, J. M., Bennett, H. E., & Bennett, J. M. 1979, Appl. Opt. Opt. Eng., 7, 191 (Elsevier) [CrossRef] [Google Scholar]
- Freudling, W., Romaniello, M., Bramich, D. M., et al. 2013, A&A, 559, A96 [NASA ADS] [CrossRef] [EDP Sciences] [Google Scholar]
- Gaia Collaboration (Prusti, T., et al.) 2016, A&A, 595, A1 [NASA ADS] [CrossRef] [EDP Sciences] [Google Scholar]
- Gaia Collaboration (Brown, A. G. A., et al.) 2018, A&A, 616, A1 [NASA ADS] [CrossRef] [EDP Sciences] [Google Scholar]
- Ginsburg, A., Parikh, M., Woillez, J., et al. 2017, Astrophysics Source Code Library [record ascl:1708.004] [Google Scholar]
- Giordano, P. 2004, in Optical Fabrication, Metrology, and Material Advancements for Telescopes, Proc. SPIE, 5494, 566 [NASA ADS] [CrossRef] [Google Scholar]
- Giordano, P., & Sarazin, M. S. 1994, in Advanced Technology Optical Telescopes V, Proc. SPIE, 2199, 977 [NASA ADS] [CrossRef] [Google Scholar]
- Heaps, W. S., & Burris, J. 1996, Appl. Opt., 35, 7128 [NASA ADS] [CrossRef] [Google Scholar]
- Herzberg, G. 1945, Molecular Spectra and Molecular Structure. Vol. 2: Infrared and Raman Spectra of Polyatomic Molecules (New York: Van Nostrand Reinhold) [Google Scholar]
- Herzberg, G. 1950, Molecular Spectra and Molecular Structure. Vol. 1: Spectra of Diatomic Molecules, 2nd edn. (New York: Van Nostrand Reinhold) [Google Scholar]
- Holzlöhner, R. 2017, AO4ELT5 Proc. (Canary Islands, Spain: Tenerife) [Google Scholar]
- Hunter, J. D. 2007, Comput. Sci. Eng., 9, 90 [Google Scholar]
- Joye, W. A., & Mandel, E. 2003, in Astronomical Data Analysis Software and Systems XII, ASP Conf. Ser., 295, 489 [NASA ADS] [Google Scholar]
- Kawaguchi, T., Ozaki, S., Sugai, H., et al. 2018, PASJ, in press [arXiv: 1807.06594] [Google Scholar]
- Keckhut, P., Chanin, M. L., & Hauchecorne, A. 1990, Appl. Opt., 29, 5182 [NASA ADS] [CrossRef] [PubMed] [Google Scholar]
- Kimura, W., Kim, G., & Balick, B. 1995, PASP, 107, 888 [NASA ADS] [CrossRef] [Google Scholar]
- La Penna, P., Aller Carpentier, E., Argomedo, J., et al. 2016, in Proc. SPIE, 9909, 99092Z [CrossRef] [Google Scholar]
- Leonard, D. A. 1967, Nature, 216, 142 [NASA ADS] [CrossRef] [Google Scholar]
- Lombardi, G., Bonaccini Calia, D., Centrone, M., et al. 2017, AO4ELT5 Proc. (Canary Islands, Spain: Tenerife) [Google Scholar]
- Marin, E., Sivo, G., Andersen, M., et al. 2018, in Proc. SPIE, 10703, 107033S [Google Scholar]
- Melfi, S. H. 1972, Appl. Opt., 11, 1605 [NASA ADS] [CrossRef] [PubMed] [Google Scholar]
- Melfi, S. H., Lawrence, J., & McCormick, M. 1969, Appl. Phys. Lett., 15, 295 [NASA ADS] [CrossRef] [Google Scholar]
- Milli, J., Kasper, M., Bourget, P., et al. 2018, Proc. SPIE, 10703, 107032A [Google Scholar]
- Monet, D. G., Levine, S. E., Canzian, B., et al. 2003, AJ, 125, 984 [NASA ADS] [CrossRef] [Google Scholar]
- Moré, J. J. 1978, in Numerical Analysis: Proceedings of the Biennial Conference (Berlin, Heidelberg: Springer), 105 [Google Scholar]
- Morris, B. M., Tollerud, E., Sipőcz, B., et al. 2018, AJ, 155, 128 [NASA ADS] [CrossRef] [Google Scholar]
- Ochsenbein, F., Bauer, P., & Marcout, J. 2000, A&AS, 143, 23 [NASA ADS] [CrossRef] [EDP Sciences] [Google Scholar]
- Penney, C. M., & Lapp, M. 1976, J. Opt. Soc. Am., 66, 422 [NASA ADS] [CrossRef] [Google Scholar]
- Robitaille, T., & Bressert, E. 2012, Astrophysics Source Code Library [record ascl:1208.017] [Google Scholar]
- Spyak, P. R., & Wolfe, W. L. 1992a, Opt. Eng., 31, 1757 [NASA ADS] [CrossRef] [Google Scholar]
- Spyak, P. R., & Wolfe, W. L. 1992b, Opt. Eng., 31, 1775 [NASA ADS] [CrossRef] [Google Scholar]
- Stuik, R., Bacon, R., Conzelmann, R., et al. 2006, New Astron., 49, 618 [NASA ADS] [CrossRef] [Google Scholar]
- Telle, H. H., González Ureña, A., & Donovan, R. J. 2007, Laser Chemistry: Spectroscopy, Dynamics and Applications (New York, NY: John Wiley & Sons, Ltd), 119 [Google Scholar]
- Thatte, N., Tecza, M., Clarke, F., et al. 2010, in Ground-Based and Airborne Instrumentation for Astronomy III, Proc. SPIE, 7735, 77352I [Google Scholar]
- Thatte, N. A., Clarke, F., Bryson, I., et al. 2014, in Ground-Based and Airborne Instrumentation for Astronomy V, Proc. SPIE, 9147, 914725 [Google Scholar]
- Toomey, D. W., & Hall, D. N. B. 1994, Proc. SPIE, 2199, 714 [NASA ADS] [CrossRef] [Google Scholar]
- Vogt, F. P. A. 2018a, Astron. Comput., 25, 81 [NASA ADS] [CrossRef] [Google Scholar]
- Vogt, F. P. A. 2018b, Astrophysics Source Code Library [record ascl:1806.027] [Google Scholar]
- Vogt, F. P. A., Bonaccini Calia, D., Hackenberg, W., et al. 2017, Phys. Rev. X, 7, 021044 [Google Scholar]
- Weilbacher, P. M., Monreal-Ibero, A., Kollatschny, W., et al. 2015, A&A, 582, A114 [NASA ADS] [CrossRef] [EDP Sciences] [Google Scholar]
- Whiteman, D. N., Melfi, S. H., & Ferrare, R. A. 1992, Appl. Opt., 31, 3068 [NASA ADS] [CrossRef] [PubMed] [Google Scholar]
- Zito, R. R. 1990, in Advanced Technology Optical Telescopes IV, Tucson, AZ, Unites States, Proc. SPIE, 1236, 952 [NASA ADS] [CrossRef] [Google Scholar]
All Tables
Improvement in the total throughput of MUSE (instrument+telescope) following the recoating of the primary and tertiary mirror of UT4 in August 2017.
All Figures
|
Fig. 1. Left: comparison of the spectral fit of the O2 Raman line region from two consecutive MUSE exposures, with and without laser propagation. The black dots trace the spectral flux density F λ integrated within the central 30″ of the MUSE field of view. The dark gray line denotes the sky and background components (only) of the fit. The full fit (which includes the Raman line) is shown in red. For the observations acquired with no laser propagation, the flux of the Raman lines is fixed at 0. Right: idem, but for the spectral region around the N2 Raman line. |
| In the text | |
|
Fig. 2. Integrated O2 line fluxes FO2(ν1 ← 0) extracted from MUSE observations of empty sky fields, acquired with the nominal WFM asterism of laser guide-stars (62″ in radius), normalized to the pre-recoating flux level. Each symbol, color-coded as a function of the airmass of the observation, corresponds to a single exposure. The time lines of specific events affecting UT4 are all indicated. The yellow diamond corresponds to the exposure acquired with the telescope in parked position, and the four 22 Watt lasers propagating in the closed dome on 2017-08-15 (see Fig. 3). |
| In the text | |
|
Fig. 3. Picture of the interior of UT4 acquired on 2017-08-15, when the dome was closed, the telescope parked, and all four lasers from the 4LGSF propagated. LGS1 and LGS4 are visible in the picture; their beam hits the cylindrical structure of an air-conditioning duct on the dome roof. The overall glow in the picture is evidence of the high amount of scattering of laser photons by the dome surface. All upper and lower lights in the dome were switched off during the test. |
| In the text | |
Current usage metrics show cumulative count of Article Views (full-text article views including HTML views, PDF and ePub downloads, according to the available data) and Abstracts Views on Vision4Press platform.
Data correspond to usage on the plateform after 2015. The current usage metrics is available 48-96 hours after online publication and is updated daily on week days.
Initial download of the metrics may take a while.