Fig. 1.
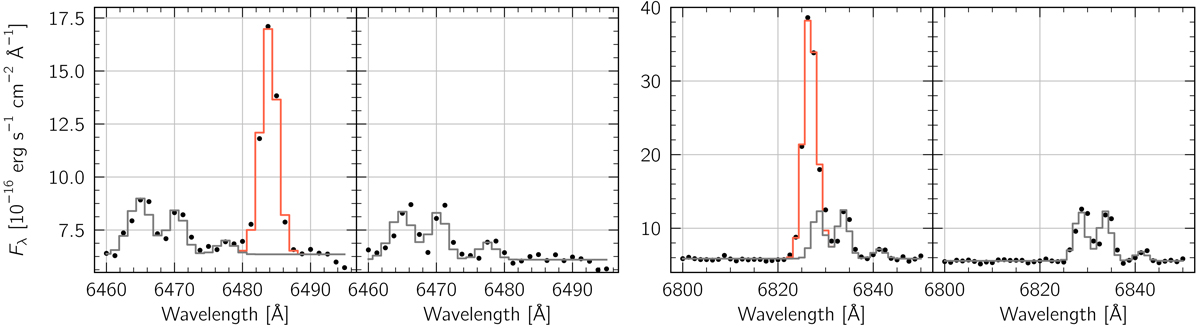
Left: comparison of the spectral fit of the O2 Raman line region from two consecutive MUSE exposures, with and without laser propagation. The black dots trace the spectral flux density F λ integrated within the central 30″ of the MUSE field of view. The dark gray line denotes the sky and background components (only) of the fit. The full fit (which includes the Raman line) is shown in red. For the observations acquired with no laser propagation, the flux of the Raman lines is fixed at 0. Right: idem, but for the spectral region around the N2 Raman line.
Current usage metrics show cumulative count of Article Views (full-text article views including HTML views, PDF and ePub downloads, according to the available data) and Abstracts Views on Vision4Press platform.
Data correspond to usage on the plateform after 2015. The current usage metrics is available 48-96 hours after online publication and is updated daily on week days.
Initial download of the metrics may take a while.