Fig. 9.
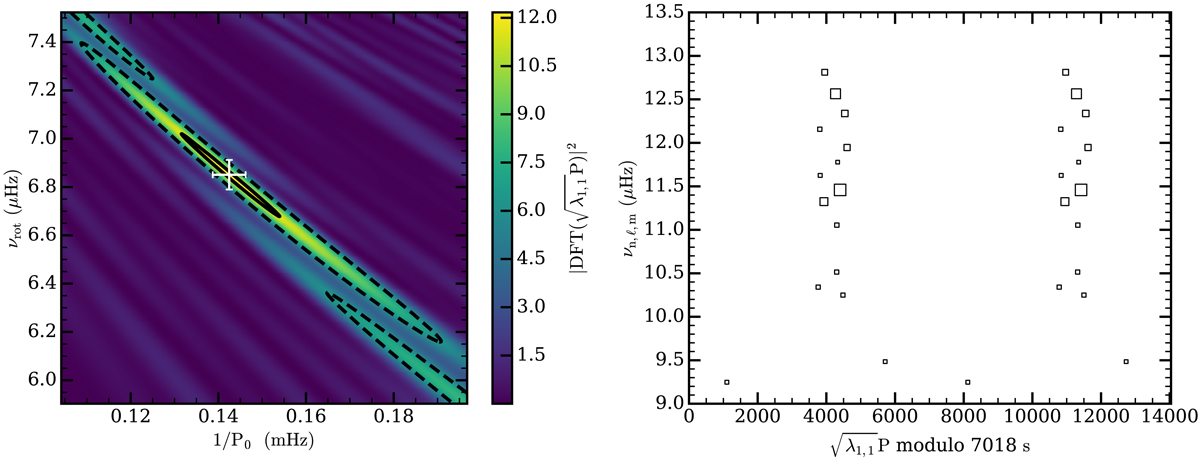
Left panel: DFT map resulting from the analysis of the group of peaks in the 9–14 μHz interval of KIC3459297 periodogram, assuming they are prograde dipole modes (ℓ = 1,m = 1). The white cross is located at the maximum of PSD. Error bars were calculated as explained in Sect. 2.5 and do not include systematic errors. Solid and dashed lines are the contours at 95% and 50% of the maximum of PSD. Right panel: period échelle diagram of the stretched spectrum, plotted twice for clarity. Marker size is representative of their amplitude in the Lomb-Scargle periodogram.
Current usage metrics show cumulative count of Article Views (full-text article views including HTML views, PDF and ePub downloads, according to the available data) and Abstracts Views on Vision4Press platform.
Data correspond to usage on the plateform after 2015. The current usage metrics is available 48-96 hours after online publication and is updated daily on week days.
Initial download of the metrics may take a while.