Fig. 8.
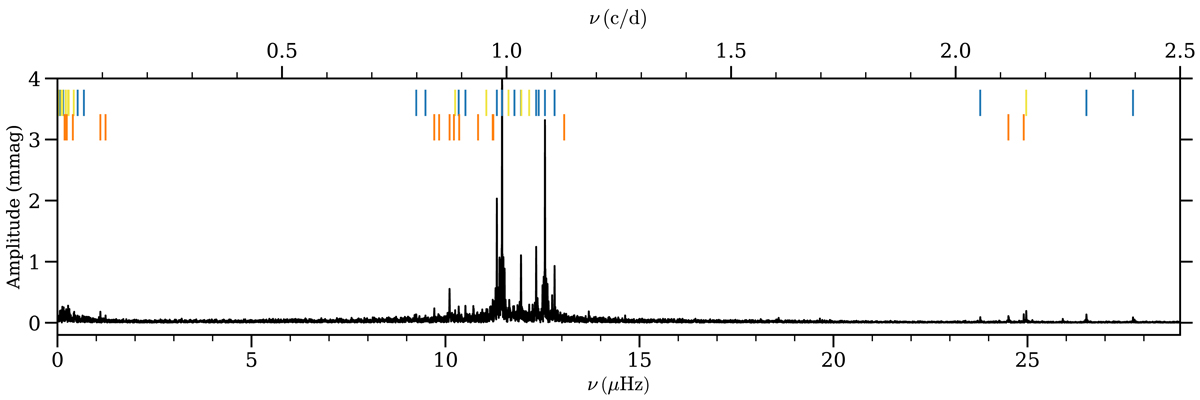
Lomb-Scargle periodogram of KIC3459297 computed from the Kepler light curve. Blue bars indicate independent peak frequencies for which the amplitude extracted and that of the original data agrees within 25%. Yellow bars are independent frequencies that are subsequently added to the frequency list (see text in Sect. 4.3). Orange bars are identified combination frequencies.
Current usage metrics show cumulative count of Article Views (full-text article views including HTML views, PDF and ePub downloads, according to the available data) and Abstracts Views on Vision4Press platform.
Data correspond to usage on the plateform after 2015. The current usage metrics is available 48-96 hours after online publication and is updated daily on week days.
Initial download of the metrics may take a while.