Fig. 5.
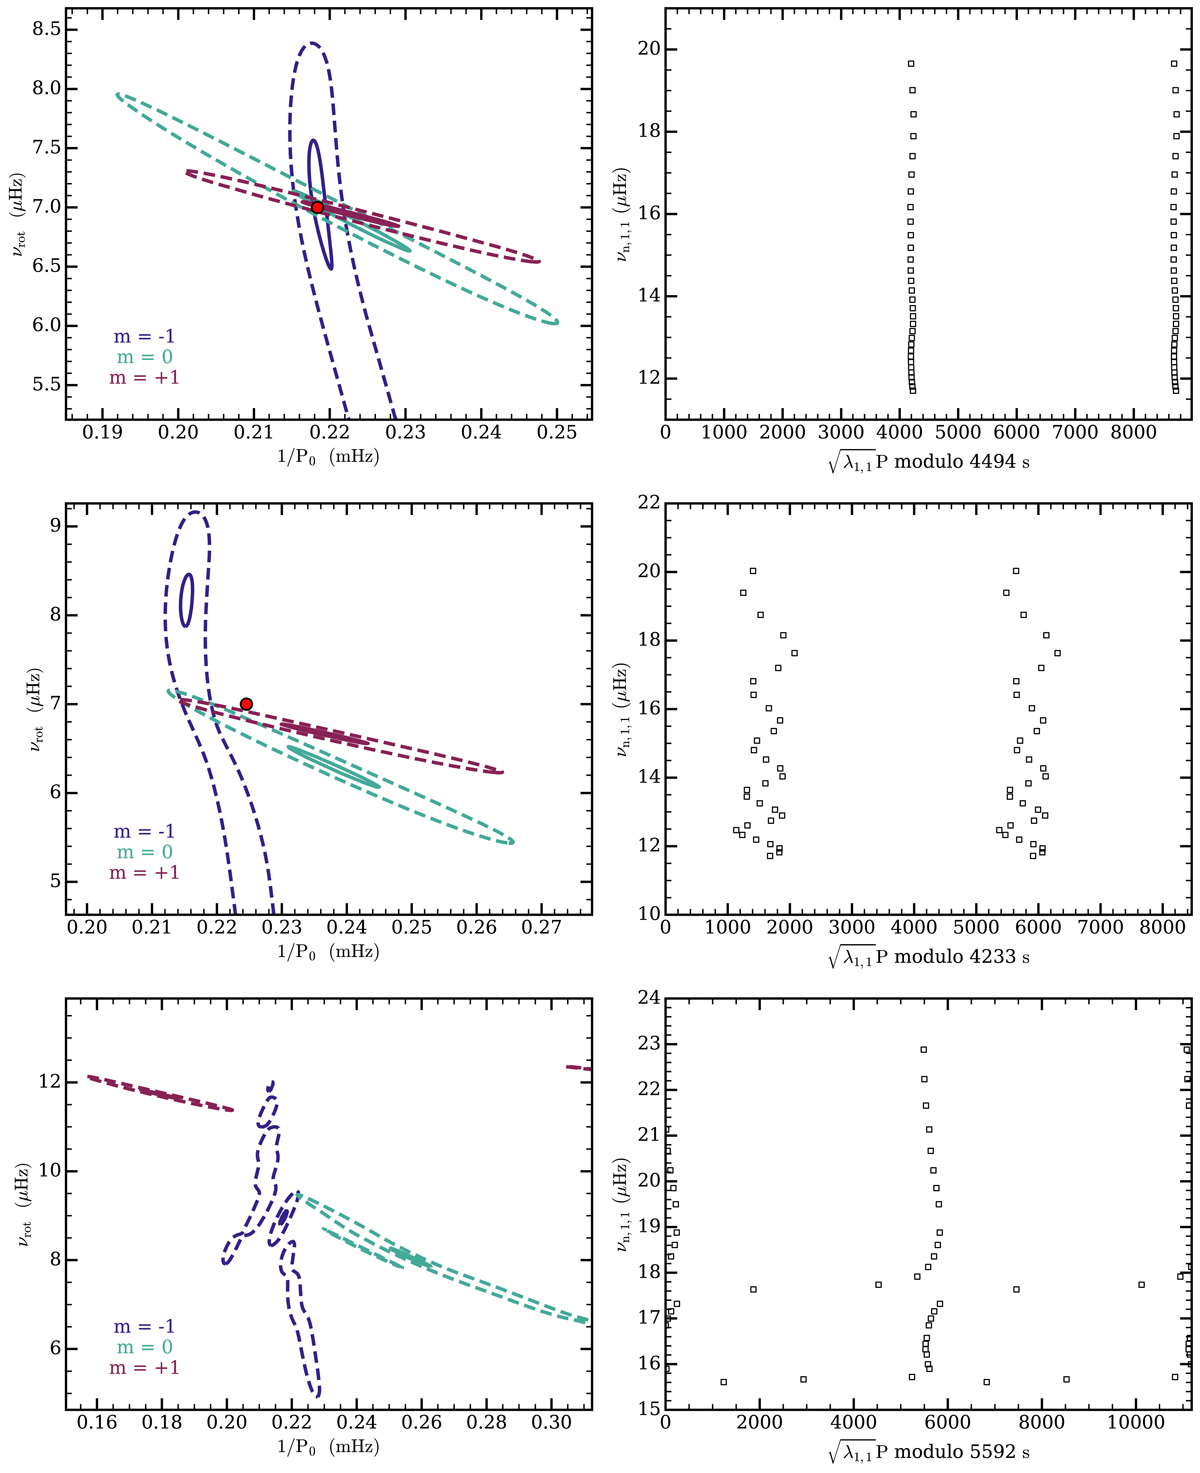
Left panels: contour maps at 95% (solid) and 50% (dashed) of the maximum of power spectral density for Model A in solid-body rotation (top), Model B in solid-body rotation (middle), and Model A in differential rotation (bottom). Colours are indicative of the type of modes (ℓ,m) on which was applied the method. Red dots indicates the input value of νrot and 1/P0 as measured from the models, when relevant. Right panels: example of stretched period échelle diagrams for prograde modes, which are plotted twice for clarity.
Current usage metrics show cumulative count of Article Views (full-text article views including HTML views, PDF and ePub downloads, according to the available data) and Abstracts Views on Vision4Press platform.
Data correspond to usage on the plateform after 2015. The current usage metrics is available 48-96 hours after online publication and is updated daily on week days.
Initial download of the metrics may take a while.