Open Access
Fig. 3.
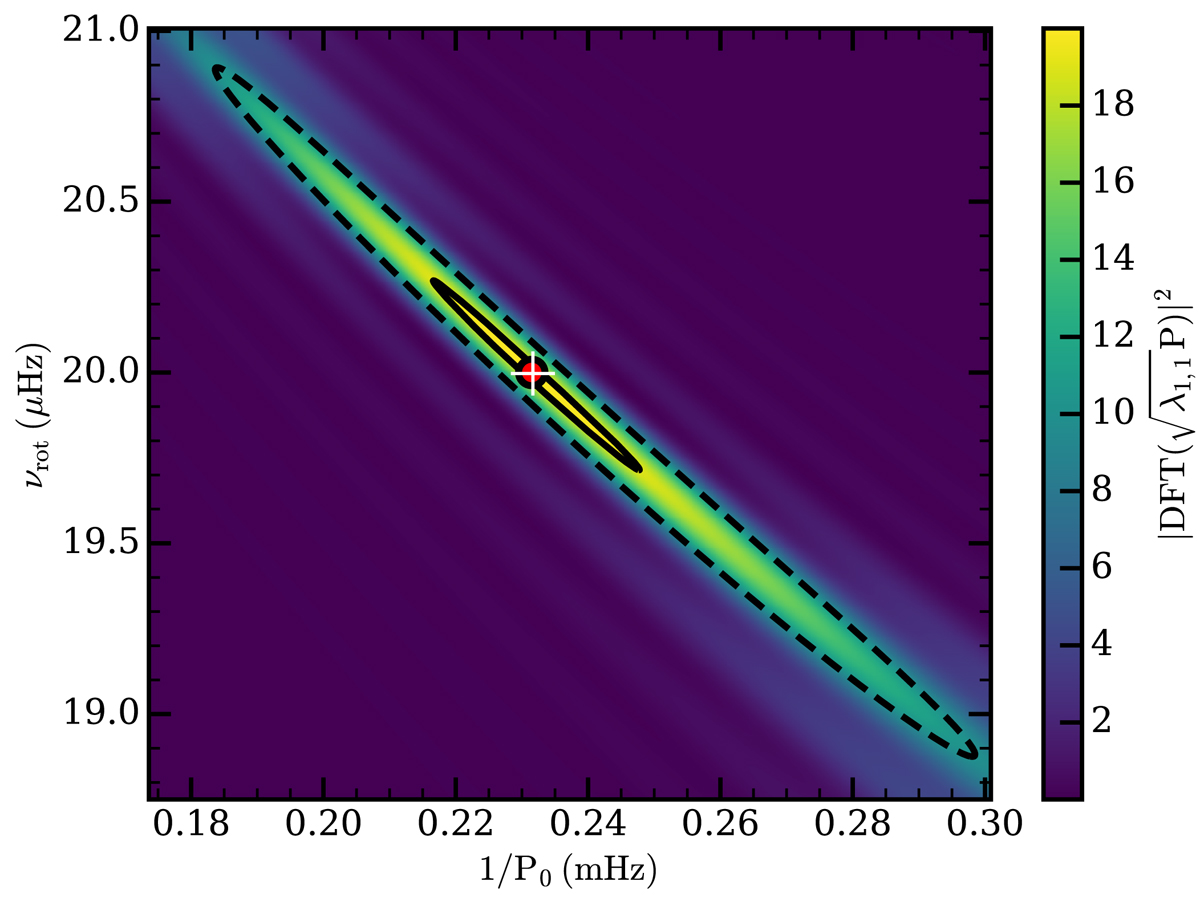
DFT map obtained for the synthetic prograde mode series of Fig. 2. The red dot represents the true parameter values. The white cross indicates the maximum of PSD. Solid and dashed lines are the contours at 95% and 50% of the maximum of PSD, respectively.
Current usage metrics show cumulative count of Article Views (full-text article views including HTML views, PDF and ePub downloads, according to the available data) and Abstracts Views on Vision4Press platform.
Data correspond to usage on the plateform after 2015. The current usage metrics is available 48-96 hours after online publication and is updated daily on week days.
Initial download of the metrics may take a while.