| Issue |
A&A
Volume 618, October 2018
|
|
|---|---|---|
| Article Number | A103 | |
| Number of page(s) | 15 | |
| Section | Planets and planetary systems | |
| DOI | https://doi.org/10.1051/0004-6361/201832732 | |
| Published online | 17 October 2018 | |
The SOPHIE search for northern extrasolar planets★,★★
XIII. Two planets around M-dwarfs Gl617A and Gl96
1
Laboratoire d’Astrophysique de Marseille, UMR 7326, CNRS, Aix-Marseille Université,
13388 Marseille Cedex 13, France
e-mail: This email address is being protected from spambots. You need JavaScript enabled to view it.
2
Facultad de Ciencias Exactas y Naturales, Universidad de Buenos Aires,
Buenos Aires, Argentina
3
Instituto de Astronomía y Física del Espacio (IAFE), CONICET – Universidad de Buenos Aires, Buenos Aires, Argentina
4
CNRS, IPAG, Université Grenoble Alpes,
38000 Grenoble, France
5
Departamento de Astronomía, Universidad de Concepción,
Casilla 160-C,
Concepción, Chile
6
Observatoire Astronomique de lUniversité de Gen,
51 Chemin des Maillettes,
1290 Versoix, Switzerland
7
ASD/IMCCE,
CNRS-UMR8028,
Observatoire de Paris, PSL, UPMC,
77 Avenue Denfert-Rochereau,
75014 Paris,
France
8
Observatoire de Haute-Provence, CNRS, Institut Pythéas UMS 3470, Aix-Marseille Université,
04870 Saint-Michel-lObservatoire, France
9
Institut dAstrophysique de Paris, UMR7095 CNRS, Université Pierre & Marie Curie, 98bis Boulevard Arago,
75014 Paris, France
10
Instituto de Astrofísica e Ciências do Espaço, CAUP, Universidade do Porto, Rua das Estrelas,
4150-762 Porto, Portugal
11
Departamento de Física e Astronomia, Faculdade de Ciências, Universidade do Porto, Rua do Campo Alegre,
4169-007 Porto, Portugal
12
Canada-France-Hawaii Telescope Corporation,
65-1238 Mamalahoa Hwy,
Kamuela,
HI 96743, USA
13
Leiden Observatory, Leiden University,
Postbus 9513,
2300 RA Leiden, The Netherlands
Received:
30
January
2018
Accepted:
27
June
2018
Abstract
We report the detection of two exoplanets and a further tentative candidate around the M-dwarf stars Gl96 and Gl617A, based on radial velocity measurements obtained with the SOPHIE spectrograph at the Observatoire de Haute-Provence. Both stars were observed in the context of the SOPHIE exoplanet consortium’s dedicated M-dwarf subprogramme, which aims to detect exoplanets around nearby M-dwarf stars through a systematic survey. For Gl96 we present the discovery of a new exoplanet at 73.9 d with a minimum mass of 19.66 earth masses. Gl96 b has an eccentricity of 0.44, placing it among the most eccentric planets orbiting M stars. For Gl617A we independently confirm a recently reported exoplanet at 86.7 d with a minimum mass of 31.29 earth masses. Both Gl96 b and Gl617A b are potentially within the habitable zone, although the high eccentricity of Gl96 b may take it too close to the star at periapsis.
Key words: techniques: radial velocities / planetary systems / stars: late-type / stars: individual: Gl617A / stars: individual: Gl96
Based on observations collected with the SOPHIE spectrograph on the 1.93 m telescope at the Observatoire de Haute-Provence (CNRS), France, by the SOPHIE Consortium.
Full Tables A.1 and A.2 (RV tables) are only available at the CDS via anonymous ftp to cdsarc.u-strasbg.fr (130.79.128.5) or via http://cdsarc.u-strasbg.fr/viz-bin/qcat?J/A+A/618/A103
© ESO 2018
 Open Access article, published by EDP Sciences, under the terms of the Creative Commons Attribution License (http://creativecommons.org/licenses/by/4.0), which permits unrestricted use, distribution, and reproduction in any medium, provided the original work is properly cited.
1 Introduction
M-dwarf stars are both interesting and promising targets for exoplanet hunts. They are the most common stars in the Galaxy, and studies suggest their planet occurrence rates are high (e.g. Bonfils et al. 2013; Dressing & Charbonneau 2015). Moreover, they are interesting candidates for habitable planet searches. Their relatively small masses (0.07−0.6 M⊙; Reid & Hawley 2005) mean that small planets will still induce detectable signals, while their faintness compared to G-type stars means the habitable zone is located closer to the stars. Hence, low-mass short-period habitable planets are easier to detect for M-dwarfs than for sun-like stars. Some examples are Gl 667C c, the first habitable-zone Earth-size planet around an M-dwarf (Delfosse et al. 2013); LHS 1140 b, one of the most recently detected planets, which orbits the brightest M-dwarf with a transiting planet in the habitable zone (Dittmann et al. 2017); TRAPPIST-1 e, f, g, three potentially habitable telluric planets in a seven-planet system (Gillon et al. 2017); GJ 273, with two super-Earths one of which is in the habitable zone (Astudillo-Defru et al. 2017c); and K2-18b, a transiting habitable-zone planet whose mass was characterised by RV follow-up, revealing a density that may correspond to a rocky planet with extended atmosphere or to a water world (Foreman-Mackey et al. 2015; Cloutier et al. 2017).
Currently, 146 exoplanets around main sequence M-dwarf stars are known, compared to 997 planets around FGK stars1. However, this number is expected to grow as several current or near-future projects have M-dwarf stars as part of their (or their sole) primary targets, e.g. SPIRou (Artigau et al. 2014), TESS (NASA mission, launch 2018; Ricker 2016), TRAPPIST (e.g. Gillon et al. 2017), CARMENES (e.g. Quirrenbach et al. 2014, 2016), HADES (e.g. Affer et al. 2016), NIRPS (Bouchy et al. 2017), and ExTrA (Bonfils et al. 2015). Given the relatively low number of detected exoplanets around M-dwarfs, each new detection provides valuable information on the population that can be used to refine observing strategies.
Since 2006, the SOPHIE exoplanet consortium has been carrying out several planet-hunting programmes using the SOPHIE spectrograph at the Observatoire de Haute-Provence (Bouchy et al. 2009a). Subprogramme 3, or SP3, consists of a systematic survey of nearby M-dwarfs whose aims are to detect habitable SuperEarths and Neptunes, to constrain the statistics of planets around M-dwarfs, and to find potentially transiting companions. A complete description of the SP3 is beyond the scope of this paper; the programme will be presented in detail in a forthcoming paper.
In this work we report the results of the SP3 study of two M-dwarfs, Gl96 and Gl617A. Section 2 presents the observations. In Sect. 3 we describe the analysis of the data. Our results are presented in Sect. 4, together with an analysis of the HIPPARCOS photometry of these stars in Sect. 5, and are discussed in Sect. 6.
2 Observations
The M-dwarf stars Gl96 and Gl617A were observed with the SOPHIE spectrograph as part of the SOPHIE consortium search for exoplanets around M-dwarfs. SOPHIE is a fibre-fed, environmentally stabilised, cross-dispersed echelle spectrograph mounted on the 193 cm telescope at the Observatoire de Haute-Provence (Perruchot et al. 2008). In 2011, SOPHIE was upgraded by inserting an octagonal-section fibre in the fibre link (Perruchot et al. 2011; Bouchy et al. 2013). The upgraded spectrograph is known as SOPHIE+.
The observations presented here were performed after the 2011 upgrade, using the high-resolution (HR) mode of the spectrograph for a resolving power of λ∕δλ ≈ 75 000. The SOPHIE spectrograph provides two modes for fibre B: thosimult mode, in which a simultaneous ThAr calibration is performed and is used to trace the spectrograph drift during the night, and objAB mode, in which fibre B is used to monitor the sky brightness. The choice of modes for the SP3 targets depends on the brightness of the stars (with a limit at V = 9). Gl96, which is above this limit, was observed in the objAB mode to control for possible moonlight contamination and to avoid any potential ThAr contamination. A calibration lamp spectrum was obtained immediately before each observation to monitor potential drifts. Gl617A, which is brighter, was observed in the thosimult mode since it is bright enough that the contamination by moonlight can be neglected and contamination from the ThAr spectrum on fibre B is negligible.
Observations were gathered between 2011 and 2017. In total, 79 spectra were obtained for Gl96 with SOPHIE+, with a median exposure time of 1800 s and a median S/N at 550 nm of 82.7. A total of 163 spectra were obtained for Gl617A, with a median exposure time of 900 s and a median S/N at 550 nm of 84.1.
The SOPHIE pipeline (Bouchy et al. 2009a) was used to reduce and extract the spectra. The spectra were then cross-correlated with an M3 stellar spectral mask in order to obtain the cross-correlation functions (CCFs), from which radial velocities (RV), FWHM, contrast, and bisectors were measured. The mask was built from the median of a large number of spectra of Gl581 obtained with HARPS (La Silla, ESO) and degraded to the SOPHIE spectral resolution.
For Gl617A, we removed nine spectra with S∕N < 35. For Gl96, we removed a total of eight observations: two spectra following the same S/N criteria as for Gl617A, and six spectra due to moon contamination.
3 Data analysis
Radial velocities for stabilised spectrographs with ThAr-derived wavelength calibration are usually obtained by the CCF method, in which the spectra are correlated with a weighted binary mask (see Queloz 1995 and Pepe et al. 2002 for full descriptions of the method). Although the CCF method is very effective for FGK stars, which have strong spectral lines and a well-defined continuum, this is not the case for M-dwarfs, where numerous overlapping molecular bands complicate the continuum determination. For these stars, the use of these binary masks which target only clearly defined lines under-utilises the Doppler information present in the spectrum. Therefore, other methods have been developed to better exploit this information, such as template-matching using a true stellar template (as done by the HARPS-TERRA code of Anglada-Escudé & Butler 2012). Template-matching also allows a more precise removal of the telluric lines, and of any parts of the spectra that are not compliant with the template or that have no spectral information. In this work, we make use of an algorithm developed by Astudillo-Defru for this purpose (Astudillo-Defru et al. 2015, 2017c); it constructs stellar and telluric templates from the observed spectra, discards the telluric-contaminated zones, and derives the radial velocity by χ2 minimisation, using the RV determined by the CCF method as a first guess. We applied this method to all the SOPHIE+ spectra.
Before employing the template-matching procedure, we performed a correction for the charge transfer inefficiency (CTI) effect, following the characterisation of Bouchy et al. (2009b). Once the RVs were determined, we added a further correction for the instrumental drift using the simultaneous ThAr calibration (for Gl617A) or an interpolation between ThAr calibrations performed before and after the exposure (for Gl96).
The SOPHIE+ spectrograph also presents long-term variations of the zero-point, an effect described in Courcol et al. (2015). In order to correct for these variations, the authors iteratively construct a master RV time series from RV constant stars. This master series is used to correct the measurements of a given target by subtracting the velocity in the master series, interpolated at the dates of observation. We followed the procedure described in Courcol et al. (2015) to construct an analogous master for the SP3 programme, using the ensemble of SP3 targets with at least ten SOPHIE+ observations plus the four “super-constants” from the SP1 programme (defined by Courcol et al. 2015) as a starting point. We chose to use primarily SP3 targets when constructing our master correction in order to mitigate any potential bias or offset due to differing spectral types. The final master employs 14 stars: the SP1 (G-type) constants HD185144, HD9407, HD22154, and HD89269A; three M-dwarfs which are systematically observed for all observation seasons and considered as our SP3 constants, Gl411, Gl514, and Gl686; and the additional SP3 stars G239-25, Gl133, Gl15A, Gl436, Gl521, Gl694, and Gl728 (all additional stars used for the constant correction have a corrected rms after the first iteration lower than 3 m s−1, as defined by Courcol et al. 2015). We also tested a master constructed using only the SP3 targets, but found the resulting RVs had higher dispersion (around 1.5 m s−1 higher on average). Figure 1 shows the master used for the zero-point drift correction and the RVs from which it was derived.
The zero-point drift correction clearly reflects several instrument modifications: a jump at 55872 (6 Nov. 2011) corresponding to a ThAr calibration lamp change; a jump at 56274 (12 Dec. 2012) following the installation of octagonal fibres after the double scrambler; a second ThAr lamp-change related jump at 56690 (01 Feb. 2014); a jump at 56730 (13 Mar. 2014) after the installation of a new calibration unit; a jump at 56941 (10 Oct. 2014) due to a change in the current of the ThAr calibration lamp; and a jump at 57435 (16 Feb. 2016) corresponding to the installation of a new thermal regulation. These events are indicated in Fig. 1. An additional long-term drift is also seen.
The first two events described were also noted by Courcol et al. (2015). We do not, however, find the jump at 56775 which the authors correlated at the time to the recoating of the secondary mirror (including when we regarded a test master constructed using only the template-matching derived RVs of the SP1 super-constants employed by Courcol et al. 2015). We have identified the actual cause of the jump at 56775 as an instability of the wavelength solution on blue spectral orders, whose weight changed after mirror recoating. As this effect is not present in the template-matching procedure, the jump no longer appears.
The full corrected radial velocity sets for Gl96 and Gl617A are given in Tables A.1 and A.2, respectively (available at the CDS).
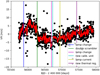 |
Fig. 1 Zero-point drift correction (red line) and radial velocities of the 14 stars used to construct it (black dots). The vertical lines indicate identified jumps and their causes (see Sect. 3 for details). The zero-point correction spans 6 years; it has a dispersion of 3.15 m s−1, and a peak-to-peak variation of 16.9 m s−1. |
3.1 Activity indicators
In order to study the stellar activity of our targets, we calculated several indicators. Two of the most widely used spectral indicators of chromospheric activity are the Hα index, which measures the flux in the Hα line, and the index, which is based on the flux in the Ca II H and K emission lines. We computed the Hα index following the definitions of Boisse et al. (2009). For the Ca lines, we followed Boisse et al. (2010) to obtain the S-index scaled to Mount Wilson values. The
  index was originally defined by Noyes et al. (1984), using a photometric correction based on the B-V index. However, in that work the conversion from the S-index to
  was not calibrated for redder M-dwarfs, and the B-V index is not ideal for M-dwarfs which are too faint in the B band. Therefore, we used the calibrations of Astudillo-Defru et al. (2017a) for M-dwarfs to calculate the
  index employing V-K colours.
Gomes da Silva et al. (2011) carried out a study of activity indices for M-dwarfs. They found that in addition to the Hα and  indices, the Na I D1 and D2 lines correlate well with stellar activity in these stars. Therefore, we also calculated the NaI index as defined by the authors. The CCF bisector is also known to correlate with stellar activity for short rotational periods. We obtained the bisector for our observations from the SOPHIE pipeline.
Stellar parameters.
3.2 Stellar parameters
The stellar parameters are listed in Table 1. Spectral types were obtained from Gaidos et al. (2014); masses from Delfosse et al. (2000); metallicities and luminosities from Gaidos & Mann (2014); and temperatures from Mann et al. (2015) when available and from Gaidos & Mann (2014) when they were not. Magnitudes and colour indices were taken from Zacharias et al. (2012), except for the K magnitude which is from Cutri et al. (2003). For Gl617A, a Gaia DR1 parallax is available, while for Gl96 we take the HIPPARCOS parallax. The mean and standard deviation of  were calculated from the SOPHIE spectra. We used the
 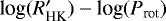 relation from Astudillo-Defru et al. (2017a) to estimate the rotation period from the mean
  , with error bars calculated by propagation.
3.3 Radial velocity analysis
To analyse the radial velocities, we employed the Data and Analysis Center for Exoplanets (DACE) web platform2, which is based at the University of Geneva. This platform allows the generation of generalised Lomb–Scargle periodograms and the calculation of false alarm probabilities (FAP). Signals can be fit by Keplerian models (DACE employs theformalism of Delisle et al. 2016 for this purpose), and polynomial drifts and stellar jitter can be added. DACE also provides a Markov chain Monte Carlo (MCMC) analysis facility, described in Díaz et al. (2014, 2016b).
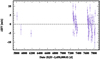 |
Fig. 2 Time series of the radial velocities calculated with template-matching for Gl96 from the SOPHIE+ measurements. |
4 Results
4.1 Gl96
The RVs calculated with template-matching from the SOPHIE+ observations of Gl96 were analysed using DACE. The time series and periodogram of the Gl96 RVs are shown in Figs. 2 and 3, respectively. Figure 3 also shows the periodogram of the zero-point correction applied, and of the data prior to this correction. In Fig. 4 we show periodograms of the activity indicators Hα,  , NaI, and the CCF bisector.
The RV periodogram shows a peak at 75d below 1% FAP, which bootstrap resampling places below 0.05% FAP. There is no corresponding peak for any of the activity indicators, nor does the zero-point drift correction applied show any signal at this period. Additionally, the signal also appears in the uncorrected time series periodogram. We also applied an l1 periodogram, as defined by Hara et al. (2017); this technique searches for a number of signals simultaneously using compressed sensing techniques. As such, it is much less prone to aliases and other problems arising in the traditional periodogram. The resulting periodogram is shown in Fig. 6, where the signal at 74 days can clearly be seen to dominate the data; the FAP of this signal is conservatively estimated (using an analytical formula from Baluev 2008) as log10 (FAP) = −2.6072. The remaining signals are consistent with the stellar rotation period and half this period, suggesting they originate in stellar activity.
We fit this signal by a Keplerian model with DACE. The highest peak in the residuals, at 29d, is only below 50% FAP, while a second peak at 14d at similar FAP corresponds to half this period (Fig. 5). Additionally, the highest peak is close to the peaks seen at 28–29d, well below 1% FAP in the periodograms of the Hα and  indices. Furthermore, these periods are consistent with the estimated stellar rotation period of 29.6 ± 2.8d (see Sect. 3.2). Therefore, we cannot justify treating it as a potential second planet.
We used DACE to carry out an MCMC analysis of the single-planet model for Gl96 in order to better constrain the parameters. The results are summarised in Table 2. Figure 8 shows the phase-folded data points. The best-fit solution results in a rather highly eccentric orbit. In order to analyse whether contamination from stellar-activity driven RV variations influences the results, we tested two approaches: the addition of a Keplerian fit to the 29d peak, and a red-noise model. The two-Keplerian model did not modify the planetary parameters greatly; in particular, the resulting eccentricity is of 0.46 , which is indistinguishable from the one-Keplerian result within the error bars. The red noise was modelled using a Gaussian process with a quasi-periodic kernel (for details of the model, see e.g. Astudillo-Defru et al. 2017b). We included the rotational period of the star in the model by using an informative prior on the corresponding hyper-parameter. The posterior distribution of this parameter is narrower, and we find Prot = 28.4 ± 1.4 days, where the uncertainties correspond to the 1σ credible interval. For the planet eccentricity, the maximum a posteriori estimate is 0.50, in agreement with the model without red noise. The inclusion of correlated noise, on the other hand, seems to allow for lower values of the eccentricity: the 95% highest density interval extends between 0.0 and 0.68 (Fig. 7), showing that in the presence of red noise the eccentricity is effectively unconstrained.
To quantify the significance of the detection, we estimated the posterior odds ratio (POR) for several competing models. If we assume equal prior probability for all models, the POR reduces to the ratio of marginal likelihoods, i.e. the Bayes factor (BF). We used the estimation introduced by Perrakis et al. (2014), based on importance sampling, to compute the marginal likelihoods for a model without a Keplerian (k0), a model with a quadratic long-term trend (k0d2), and a model with a single Keplerian (k1). All three models included an additional white noise component whose amplitude was an additional nuisance parameter. The results are shown in Fig. 9 as a function of the sample size used for the estimation. As expected, the Perrakis estimator is biased, but for sample sizes larger than around 3000, the bias is negligible. We find logarithmic Bayes factors log (BFk1;k0) = 5.21 ± 0.06 and log (BFk1;k0d2) = 7.91 ± 0.06 for the comparison between k1 and k0, and k1 and k0d2, respectively, where the reported values are the empirical means and standard deviations obtained by repeating the calculation for each model 5000 times, and drawing 1000 random pairs. The resulting distributions are very approximately normal. The analysis shows therefore that the posterior probability of a model with a single Keplerian is much higher than any of the competing models. This is so in spite of the strong penalisation the Bayes factor gives to more complex models.
One of the goals of the SP3 programme is to detect habitable planets around M-dwarf stars. The habitable zone calculator3 based on the work of Kopparapu et al. (2013b) places Gl96 b inward of the conservative HZ, though within the optimistic one; however, due to its high eccentricity it would probably move inward of the optimistic HZ at periapsis (Fig. 10). To better quantify the habitability of this eccentric planet, we follow the method employed by Díaz et al. (2016a), who calculated the mean incident flux over an orbit as defined by Williams & Pollard (2002), and compared it with the limits given by Kopparapu et al. (2013a). For Gl96 b, the mean incident flux is ⟨ F⟩ ∕F⊕ = 1.168, placing it between the recent Venus and runaway greenhouse limits.
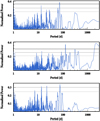 |
Fig. 3 Periodogram of (top panel) the radial velocities calculated with template-matching for Gl96 from the SOPHIE+ measurements, corrected from the zero-point drift; (middle panel) the time series of the master correction for the zero-point drift applied; (bottom panel) the uncorrected radial velocities for Gl96 (prior to the application of the master correction). The horizontal lines correspond to 50%, 10%, and 1% FAP, respectively. |
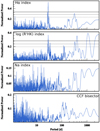 |
Fig. 4 Periodograms of activity indicators for Gl96 – from top to bottom panels: Hα
index, |

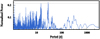 |
Fig. 5 Periodogram of the residuals of a Keplerian fit with P = 75d to the radial velocities calculated with template-matching for Gl96 from the SOPHIE+ measurements. The horizontal line corresponds to 50% FAP level. |
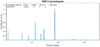 |
Fig. 6 l1 periodogram of the SOPHIE RVs for Gl96. The signal at 74 days is clearly predominant, while the other two peaks are probably related to activity. |
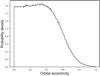 |
Fig. 7 Posterior probability of the orbital eccentricity of Gl96 b under the model including correlated noise. |
Best-fit solution for the planetary system orbiting Gl96.
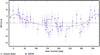 |
Fig. 8 Phase-folded radial velocities of Gl96 for a one-planet model with P = 74.7d. |
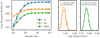 |
Fig. 9 Left panel: marginal likelihood estimated by the Perrakis method vs. sample size for three models: a single Keplerian plus white noise (k1; blue), a quadratic drift plus white noise (k0d2; green), and pure white noise (k0; orange). The one-Keplerian model is clearly favoured by the data. The error bars correspond to the 95% confidence interval. Right panel: histogram of 1000 Monte Carlo realisations of the Bayes factor between model k1 and k0 (orange) and k0d2 (green); the solid curves are normal distributions with the mean and variance equal to those of the Monte Carlo sample. |
4.2 Gl617A
A planet at 86.54 d around this star was recently announced by the CARMENES team (Reiners et al. 2018). In this section, we present an independent detection of this planet from our SOPHIE data, and describe a further potential candidate at 500 d.
We analysed the RVs calculated by template-matching from the SOPHIE+ observations of Gl617A with the DACE platform. The time series and periodogram of the Gl617A RVs are shown in Figs. 11 and 12, respectively. Figure 12 also shows the periodograms of the zero-point correction applied and of the uncorrected data (i.e. the Gl617A RVsprior to the application of this correction).
In Fig. 13 we show periodograms of the activity indicators Hα,  , NaI, and the CCF bisector. The Hα index exhibits a periodicity at around 21.8 days, probably related to the rotational period of the star, as well as long-period peaks. The
  and NaI periodograms present only very long-period peaks, in the 500–1000 day range. The CCF bisector shows a small peak at 10.9 days, which is close to half the rotation period and therefore is probably due to stellar activity.
The RV periodogram shows a very strong signal at 86d well below 1% FAP, which bootstrap resampling places below 0.01% FAP, and which is not present in any of the activity indicators or in the periodogram of the zero-point correction applied. We employed DACE to fit it with a Keplerian model. Figure 14 shows the periodogram of the residuals. There are two signals below 10% FAP: one at 21d and one at around 500d, and one further signal below 50% FAP at 29d.The 21d signal is probably due to stellar activity, as it coincides with a signal below 1% FAP in the Hα periodogram, and is close to the estimated rotation period (Table 1), although there is no signal at 21d in the other activity indicators. The 29d signal is removed by the addition of a quadratic drift, suggesting it may be an artefact of the window function (although the period may also point to moon contamination; as this star is observed with simultaneous wavelength calibration, we do not have a measure of the sky).
The long-period signal is intriguing; the addition of a linear or quadratic drift does not affect it, whereas a test Keplerian model removes it completely and results in a low-eccentricity Keplerian fit. While the periodograms of the Hα,  , and NaI indices show long-period peaks, they are not well fitted by the model obtained from the RVs. More concerning is the periodogram of the master correction, which shows a peak at 500 days; nevertheless, we note that the long-period signal is also present in the uncorrected RVs (see Fig. 12). However, we stress that this signal is of only moderate significance. We therefore present it as a tentative detection to be confirmed, not a definite planet.
As was done for Gl96, we also applied an l1 periodogram, which is shown in Fig. 15; the signal at 86 days dominates the data, with log10(FAP) = −17.1869. The remaining signals at 21d and ~500d are consistent with the discussion above.
In order to explore the parameter space more thoroughly, we employed the MCMC sampler implemented in DACE. We tested two models: a one-Keplerian model at 86d, and a two-Keplerian model with initial periods at 86d and 500d, both including a quadratic drift. The resulting best-fit solutions are summarised in Table 3.
The planet at 86d is consistent in both models, with practically all parameters indistinguishable within the error bars between thetwo best-fit solutions. The two-Keplerian model actually provides a better fit to the data, with a lower σ(O−C) and BIC. Figures 16 and 17 show the phase-folded RVs for Gl617A b and Gl617A c, respectively,using the parameters derived from the two-Keplerian model. In the one-Keplerian model, the drift is significant; removing it slightly decreases the amplitude and increases the eccentricity of the Keplerian fit. In the two-Keplerian model, however, the drift is only marginally significant. This is coherent with the fact that in the one-Keplerian model, the drift may attempt to absorb the long-period signal that is fitted by a Keplerian in the second model.
We compared the parameters obtained by our analysis with those recently presented by Reiners et al. (2018). The orbital period and semi-major axis are compatible within error bars; however, we find a somewhat larger mass and distinctly larger eccentricity from our data. The mass reported by Reiners et al. (2018) of M⋅ sini = 24.7 MEarth is compatible with our calculated mass at 2σ. This is true for both the one-Keplerian and the two-Keplerian models, with the eccentricity higher for the one-Keplerian model (see Table 3).
As was done for Gl96, we employed the habitable zone calculator to estimate the location of the HZ for Gl617A. The orbits calculated by the MCMC analysis place Gl617A b at 0.32 AU, closer to the star than the conservative inner limit, but within the optimistic HZ (Fig. 18). This differs from the results of Reiners et al. (2018). As Gl617A b is moderately eccentric, we also calculate the mean incident flux (as was done for Gl96 b) in order to better quantify its habitability. The mean incident flux
is ⟨ F⟩∕F⊕ = 1.053, placing it between the recent Venus and runaway greenhouse limits as defined by Kopparapu et al. (2013a).
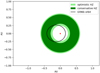 |
Fig. 10 Calculated orbit for Gl96 b with respect to the optimistic and conservative habitable zones, as defined by Kopparapu et al. (2013b). |
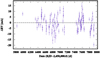 |
Fig. 11 Time series of the radial velocities calculated with template-matching for Gl617A from the SOPHIE+ measurements. |
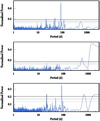 |
Fig. 12 Periodograms: radial velocities calculated with template-matching for Gl617A from the SOPHIE+ measurements, corrected for the zero-point drift (top panel); middle panel: master correction for the zero-point drift applied; bottom panel: uncorrected radial velocities for Gl617A (prior to the application of the master correction). The horizontal lines correspond to 50%, 10%, and 1% FAP, respectively. |
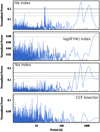 |
Fig. 13 Periodograms of activity indicators for Gl617A. From top to bottom panels: Hα index, |

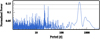 |
Fig. 14 Periodogram of the residuals of a Keplerian fit with P = 86d to the radial velocities calculated with template-matching for Gl617A from the SOPHIE+ measurements. The horizontal lines correspond to 50% and 10% FAP, respectively. |
Best-fit solutions for the planetary system orbiting Gl617A: one-Keplerian and two-Keplerian models plus drift.
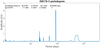 |
Fig. 15 l1periodogram of the SOPHIE RVs for Gl617A. The signal at 86 days is clearly predominant, while that at 21 days is probably related to activity. The ~500d signal is discussed in the text. |
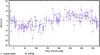 |
Fig. 16 Phase-folded radial velocities of Gl617A for a P = 86d planet, using the parameters derived from the two-Keplerian model. |
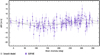 |
Fig. 17 Phase-folded radial velocities of Gl617A for a P = 497d planet, using the parameters derived from the two-Keplerian model. |
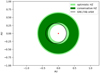 |
Fig. 18 Calculated orbit for Gl617A b with respect to the optimistic and conservative habitable zones, as defined by Kopparapu et al. (2013b). |
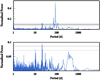 |
Fig. 19 Periodograms: combined SOPHIE, CARMENES, and KECK radial velocities of Gl617A (top panel); bottom panel: residuals of a Keplerian fit with P = 86d to the data. The horizontal lines correspond to 50%, 10%, and (top panel only) 1% FAP, respectively. |
Combination with CARMENES and KECK data
We combined our observations of Gl617A with the CARMENES data presented by Reiners et al. (2018) and the KECK data of Butler et al. (2017). Figure 19 shows the resulting periodogram, with a strong signal at 86d, to which we fit a Keplerian model using DACE; and the periodogram of the residuals of this fit. The only strong signal is at 21d, and presumably corresponds to the stellar activity as discussed previously. The 500d signal that is present in the SOPHIE data is not in evidence in the combined observations, suggesting that it may be spurious.
The posterior distribution of the model parameters was sampled using an MCMC algorithm implemented in DACE. A one-Keplerian model with a quadratic drift was used. The resulting best-fit solution is summarised in Table 4, and the phase-folded combined data is shown in Fig. 20.
We compared the parameters resulting from the analysis of the combined data with those we obtained from SOPHIE data alone, and with those presented by Reiners et al. (2018). In all three cases, the orbital periods are compatible at the 1σ level (though slightly larger for the SOPHIEand combined data). M⋅sini is also compatible at the 1σ level between SOPHIE data alone and the combined data, but Reiners et al. (2018) present a slightly smaller value of M⋅ sini = 24.7 MEarth, only compatible with the others at the 2σ level. The eccentricity is also different; the value derived from the SOPHIE data alone is larger, while those from the combined data and from Reiners et al. (2018) are compatible at 1σ. The amplitude of the signal thus differs, being largest for the SOPHIE data alone and smallest in the Reiners et al. (2018) analysis; this is consistent with the fact that for fixed e, K grows with M⋅ sini, and for fixed M⋅sini K grows with e (see e.g. Seager 2010).
Recently, Feng et al. (2018) published an analysis of this system in a Research Note of the AAS, also employing the CARMENES, HIRES, and SOPHIE data. Their use of our SOPHIE data, however, is biased; they do not take into account the CTI effect and zero-point drift described in Sect. 3 that we correct for in this work.
Best-fit solution for the planetary system orbiting Gl617A, from SOPHIE, CARMENES, and KECK combined data.
5 Photometry
Stellar activity can be reflected not only in the radial velocity but also in the photometric observations of a star, where we also hope to findsignals linked to the rotation period. In order to analyse whether this is the case for our targets, we obtained the HIPPARCOS photometry for both from ESA (1997).
For Gl96, we retrieved 121 measurements over a time span of three years. Figure 21 shows the photometric data points and the corresponding periodogram. No signals below 50% FAP can be found in the periodogram. There is a small peak at 29d, the period found in the RV, Hα, and  periodograms that is presumed to be related to activity, but it is not particularly relevant in the periodogram of photometric measurements which is dominated by a forest of peaks at around 2d. This set of peaks is probably linked to the sampling; as can be seen in the upper panel of Fig. 21, this star appears to have been observed in groups of several measurements within two days, with the groups set weeks or months apart.
For Gl617A, we retrieved 103 measurements over a time span of 2.5 yr. The photometric data points and the corresponding periodogram are shown in Fig. 22. No signals below 50% FAP can be found in the periodogram. Nevertheless, it is worth remarking that the two highest peaks are at 10.4d and 20d; these values are very close to the 21d period seen in the RV and Hα periodograms and half this period.
For both stars, we note that the HIPPARCOS photometry has a relatively high RMS (2.62% for Gl96, 1.97% for Gl617A). Activity signals at the level attained by our RV measurements would fall well below this, so any photometric activity tracers may be absorbedin the uncertainty of the data.
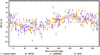 |
Fig. 20 Phase-folded radial velocities of Gl617A for a P = 86d planet, using the combined SOPHIE, CARMENES, and KECK data. |
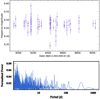 |
Fig. 21 HIPPARCOS photometry for Gl96 (top panel) and its corresponding periodogram (bottom panel). |
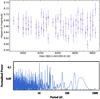 |
Fig. 22 HIPPARCOS photometry for Gl617A (top panel) and its corresponding periodogram (bottom panel). |
6 Discussion and conclusions
We have presented the detection of a new Neptune-like exoplanet orbiting the M-dwarf Gl96 and the independent detection of a second Neptune-like exoplanet orbiting the M-dwarf Gl617A for which we refine the planetary parameters, using the SOPHIE+ spectrograph on a 1.93m telescope. The planets have minimum masses of 29 and 31 Earth masses and orbital periods of 74 and 87 days, respectively, and are located close to the inner limit of the HZ. For Gl96 we find no evidence of further planetary companions. Gl617A shows an intriguing signal of moderate significance at ~500d in the periodogram that is best fit by a Keplerian model. For Gl617A, we also analysed the combination of our data with that from CARMENES (Reiners et al. 2018) and KECK (Butler et al. 2017). The 87d signal is clear in the combined data, though the resulting planetary parameters differ slightly from those obtained by the SOPHIE data alone. The 500d signal, however, is no longer significant, which suggests that it is probably spurious. We may also suspect the influence of a magnetic cycle here; complementary observations in polarimetry with SPIRou should help to resolve the question.
As mentioned in Sect. 1, 146 exoplanets around M-dwarf stars are presently known, of which 75 were detected by radial velocities and 33 by transits. The two planets presented here fall in the intermediate- to long-period range, and the intermediate- to high-mass range of this sample, as shown in Fig. 23 (median period = 13.5 d, median mass = 14.3 MEarth). Gl96 b is one of the most eccentric known planets around M-dwarf stars (mean e = 0.12), surpassed only by Wolf 1061 d (Wright et al. 2016) and GJ 317 c (Johnson et al. 2007), with eccentricities of 0.55 and 0.81, respectively.
Both host stars are metal-rich, as noted in Table 1. This is consistent with a trend found for M-dwarfs hosting planets to be preferentially metal-rich (e.g. Courcol et al. 2016, Hobson et al. 2018). Additionally, the masses determined for the planets are compatible with the upper mass boundary determined for Neptune-like planets around M-dwarfs by Courcol et al. (2016), which corresponds to around 35 Earth masses for the metallicities of these stars.
Low-mass planets orbiting M-dwarfs are mainly found in multi-planet systems. Follow-up observations with SPIRou in spectropolarimetry will permit us to disentangle the stellar activity and planetary signals, refine the mass, and identify possible additional rocky planets.
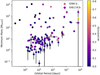 |
Fig. 23 Orbital period vs. minimum mass for planets around M-dwarfs detected by radial velocities or transits. Each point represents a planet, with Gl96 b indicated by a pentagon and Gl617A b by a diamond. The colours indicate the orbital eccentricity. |
Acknowledgements
We warmly thank the OHP staff for their support on the observations. X.D., X.B., I.B., and T.F. received funding from the French Programme National de Physique Stellaire (PNPS) and the Programme National de Planétologie (PNP) of CNRS (INSU). N.S. and O.D. were supported by Fundação para a Ciência e a Tecnologia (FCT, Portugal) through national funds and by FEDER through COMPETE2020 in the context of the projects and grants reference UID/FIS/04434/2013 & POCI-01-0145-FEDER-007672, PTDC/FIS-AST/1526/2014 & POCI-01-0145-FEDER-016886, and IF/00169/2012/CP0150/CT0002. This publication makes use of the Data & Analysis Center for Exoplanets (DACE), which is a facility based at the University of Geneva (CH) dedicated to extrasolar planets data visualisation, exchange, and analysis. DACE is a platform of the Swiss National Centre of Competence in Research (NCCR) PlanetS, federating the Swiss expertise in Exoplanet research. The DACE platform is available at https://dace.unige.ch. We thank the anonymous referees for their comments which helped to improve this article.
Appendix A Radial velocities
In this appendix, we present for each star the full set of radial velocities derived by template-matching, with the short-term instrumental drift and long-term zero-point corrections applied.
Radial velocities for Gl96 derived by template-matching, with the short-term instrumental drift and long-term zero-point corrections applied.
Radial velocities for Gl617A derived by template-matching, with the short-term instrumental drift and long-term zero-point corrections applied.
Appendix B MCMC analysis – full probed parameters
We present the full set of parameters probed by the DACE MCMC analysis for Gl96 and Gl617A, and the derived physical parameters.
Parameters probed by the MCMC used to fit the RV measurements of Gl96.
Physical parameters derived from the MCMC chains used to fit the RV measurements of Gl96.
Parameters probed by the MCMC used to fit the RV measurements of Gl617A – 1-Keplerian model plus quadratic drift.
Physical parameters derived from the MCMC chains used to fit the RV measurements of Gl617A – 1-Keplerian model plus quadratic drift.
Parameters probed by the MCMC used to fit the RV measurements of Gl617A – 2-Keplerian model plus quadratic drift.
Physical parameters derived from the MCMC chains used to fit the RV measurements of Gl617-A – 2-Keplerian model plus quadratic drift.
Parameters probed by the MCMC used to fit the combined SOPHIE, CARMENES, and KECK RV measurements of Gl617A.
Physical parameters derived from the MCMC chains used to fit the combined SOPHIE, CARMENES, and KECK RV measurements of Gl617A.
References
- Affer, L., Micela, G., Damasso, M., et al. 2016, A&A, 593, A117 [NASA ADS] [CrossRef] [EDP Sciences] [Google Scholar]
- Anglada-Escudé, G., & Butler, R. P. 2012, ApJS, 200, 15 [NASA ADS] [CrossRef] [Google Scholar]
- Artigau, É., Kouach, D., Donati, J.-F., et al. 2014, in Ground-based and Airborne Instrumentation for Astronomy V, Proc. SPIE, 9147, 914715 [Google Scholar]
- Astudillo-Defru, N., Bonfils, X., Delfosse, X., et al. 2015, A&A, 575, A119 [NASA ADS] [CrossRef] [EDP Sciences] [Google Scholar]
- Astudillo-Defru, N., Delfosse, X., Bonfils, X., et al. 2017a, A&A, 600, A13 [NASA ADS] [CrossRef] [EDP Sciences] [Google Scholar]
- Astudillo-Defru, N., Díaz, R. F., Bonfils, X., et al. 2017b, A&A, 605, L11 [Google Scholar]
- Astudillo-Defru, N., Forveille, T., Bonfils, X., et al. 2017c, A&A, 602, A88 [NASA ADS] [CrossRef] [EDP Sciences] [Google Scholar]
- Baluev, R. V. 2008, MNRAS, 385, 1279 [NASA ADS] [CrossRef] [Google Scholar]
- Boisse, I., Moutou, C., Vidal-Madjar, A., et al. 2009, A&A, 495, 959 [NASA ADS] [CrossRef] [EDP Sciences] [Google Scholar]
- Boisse, I., Eggenberger, A., Santos, N. C., et al. 2010, A&A, 523, A88 [NASA ADS] [CrossRef] [EDP Sciences] [Google Scholar]
- Bonfils, X., Delfosse, X., Udry, S., et al. 2013, A&A, 549, A109 [NASA ADS] [CrossRef] [EDP Sciences] [Google Scholar]
- Bonfils, X., Almenara, J. M., Jocou, L., et al. 2015, in Techniques and Instrumentation for Detection of Exoplanets VII, Proc. SPIE, 9605, 96051L [CrossRef] [Google Scholar]
- Bouchy, F., Hébrard, G., Udry, S., et al. 2009a, A&A, 505, 853 [NASA ADS] [CrossRef] [EDP Sciences] [Google Scholar]
- Bouchy, F., Isambert, J., Lovis, C., et al. 2009b, EAS Pub. Ser., ed. P. Kern, 37, 247 [CrossRef] [EDP Sciences] [Google Scholar]
- Bouchy, F., Díaz, R. F., Hébrard, G., et al. 2013, A&A, 549, A49 [NASA ADS] [CrossRef] [EDP Sciences] [Google Scholar]
- Bouchy, F., Doyon, R., Artigau, É., et al. 2017, The Messenger, 169, 21 [NASA ADS] [Google Scholar]
- Butler, R. P., Vogt, S. S., Laughlin, G., et al. 2017, AJ, 153, 208 [NASA ADS] [CrossRef] [Google Scholar]
- Cloutier, R., Astudillo-Defru, N., Doyon, R., et al. 2017, A&A, 608, A35 [NASA ADS] [CrossRef] [EDP Sciences] [Google Scholar]
- Courcol, B., Bouchy, F., Pepe, F., et al. 2015, A&A, 581, A38 [NASA ADS] [CrossRef] [EDP Sciences] [Google Scholar]
- Courcol, B., Bouchy, F., & Deleuil, M. 2016, MNRAS, 461, 1841 [NASA ADS] [CrossRef] [Google Scholar]
- Cutri, R. M., Skrutskie, M. F., van Dyk, S., et al. 2003, VizieR Online Data Catalog: II/246 [Google Scholar]
- Delfosse, X., Forveille, T., Ségransan, D., et al. 2000, A&A, 364, 217 [NASA ADS] [Google Scholar]
- Delfosse, X., Bonfils, X., Forveille, T., et al. 2013, A&A, 553, A8 [NASA ADS] [CrossRef] [EDP Sciences] [Google Scholar]
- Delisle, J.-B., Ségransan, D., Buchschacher, N., & Alesina, F. 2016, A&A, 590, A134 [NASA ADS] [CrossRef] [EDP Sciences] [Google Scholar]
- Díaz, R. F., Almenara, J. M., Santerne, A., et al. 2014, MNRAS, 441, 983 [NASA ADS] [CrossRef] [Google Scholar]
- Díaz, R. F., Rey, J., Demangeon, O., et al. 2016a, A&A, 591, A146 [NASA ADS] [CrossRef] [EDP Sciences] [Google Scholar]
- Díaz, R. F., Ségransan, D., Udry, S., et al. 2016b, A&A, 585, A134 [NASA ADS] [CrossRef] [EDP Sciences] [Google Scholar]
- Dittmann, J. A., Irwin, J. M., Charbonneau, D., et al. 2017, Nature, 544, 333 [NASA ADS] [CrossRef] [Google Scholar]
- Dressing, C. D., & Charbonneau, D. 2015, ApJ, 807, 45 [NASA ADS] [CrossRef] [Google Scholar]
- ESA 1997, The HIPPARCOS and Tycho Catalogues. Astrometric and Photometric Star Catalogues Derived from the ESA HIPPARCOS Space Astrometry Mission, ESA SP, 1200 [Google Scholar]
- Feng, F., Jones, H. R. A., & Tuomi, M. 2018, Res. Notes Am. Astron. Soc., 2, 23 [NASA ADS] [CrossRef] [Google Scholar]
- Foreman-Mackey, D., Montet, B. T., Hogg, D. W., et al. 2015, ApJ, 806, 215 [NASA ADS] [CrossRef] [Google Scholar]
- Gaia Collaboration (Brown, A. G. A.,> et al.) 2016, A&A, 595, A2 [NASA ADS] [CrossRef] [EDP Sciences] [Google Scholar]
- Gaidos, E., & Mann, A. W. 2014, ApJ, 791, 54 [NASA ADS] [CrossRef] [Google Scholar]
- Gaidos, E., Mann, A. W., Lépine, S., et al. 2014, MNRAS, 443, 2561 [NASA ADS] [CrossRef] [Google Scholar]
- Gillon, M., Triaud, A. H. M. J., Demory, B.-O., et al. 2017, Nature, 542, 456 [NASA ADS] [CrossRef] [PubMed] [Google Scholar]
- Gomes da Silva, J., Santos, N. C., Bonfils, X., et al. 2011, A&A, 534, A30 [NASA ADS] [CrossRef] [EDP Sciences] [Google Scholar]
- Hara, N. C., Boué, G., Laskar, J., & Correia, A. C. M. 2017, MNRAS, 464, 1220 [NASA ADS] [CrossRef] [Google Scholar]
- Hobson, M. J., Jofré, E., García, L., Petrucci, R., & Gómez, M. 2018, Rev. Mex. Astron. Astrofis., 54, 65 [NASA ADS] [Google Scholar]
- Johnson, J. A., Butler, R. P., Marcy, G. W., et al. 2007, ApJ, 670, 833 [NASA ADS] [CrossRef] [Google Scholar]
- Kopparapu, R. K., Ramirez, R., Kasting, J. F., et al. 2013a, ApJ, 770, 82 [NASA ADS] [CrossRef] [Google Scholar]
- Kopparapu, R. K., Ramirez, R., Kasting, J. F., et al. 2013b, ApJ, 765, 131 [NASA ADS] [CrossRef] [Google Scholar]
- Mann, A. W., Feiden, G. A., Gaidos, E., Boyajian, T., & von Braun K. 2015, ApJ, 804, 64 [CrossRef] [Google Scholar]
- Noyes, R. W., Hartmann, L. W., Baliunas, S. L., Duncan, D. K., & Vaughan, A. H. 1984, ApJ, 279, 763 [NASA ADS] [CrossRef] [Google Scholar]
- Pepe, F., Mayor, M., Galland, F., et al. 2002, A&A, 388, 632 [NASA ADS] [CrossRef] [EDP Sciences] [Google Scholar]
- Perrakis, K., Ntzoufras, I., & Tsionas, E. G. 2014, Comput. Stat. Data Anal., 77, 54 [CrossRef] [Google Scholar]
- Perruchot, S., Kohler, D., Bouchy, F., et al. 2008, in Ground-based and Airborne Instrumentation for Astronomy II, Proc. SPIE, 7014, 70140J [CrossRef] [Google Scholar]
- Perruchot, S., Bouchy, F., Chazelas, B., et al. 2011, in Techniques and Instrumentation for Detection of Exoplanets V, Proc. SPIE, 8151, 815115 [CrossRef] [Google Scholar]
- Queloz, D. 1995, in New Developments in Array Technology and Applications, eds. A. G. D. Philip, K. Janes, & A. R. Upgren, IAU Symp., 167, 221 [NASA ADS] [CrossRef] [Google Scholar]
- Quirrenbach, A., Amado, P. J., Caballero, J. A., et al. 2014, in Ground-based and Airborne Instrumentation for Astronomy V, 9147, 91471F [Google Scholar]
- Quirrenbach, A., Amado, P. J., Caballero, J. A., et al. 2016, in Ground-based and Airborne Instrumentation for Astronomy VI, 9908, 990812 [Google Scholar]
- Reid, I. N., & Hawley, S. L. 2005, New Light on Dark Stars Red Dwarfs, Low-Mass Stars, Brown Stars (Springer-Praxis books in astrophysics and astronomy) [Google Scholar]
- Reiners, A., Ribas, I., Zechmeister, M., et al. 2018, A&A, 609, L5 [Google Scholar]
- Ricker, G. R. 2016, AGU Fall Meeting Abstracts, P13C-01 [Google Scholar]
- Seager, S. 2010, The Exoplanet Encyclopaedia, http://exoplanet.eu/ [Google Scholar]
- van Leeuwen, F. 2007, A&A, 474, 653 [NASA ADS] [CrossRef] [EDP Sciences] [Google Scholar]
- Williams, D. M., & Pollard, D. 2002, Int. J. Astrobiol., 1, 61 [NASA ADS] [CrossRef] [Google Scholar]
- Wright, D. J., Wittenmyer, R. A., Tinney, C. G., Bentley, J. S., & Zhao, J. 2016, ApJ, 817, L20 [NASA ADS] [CrossRef] [Google Scholar]
- Zacharias, N., Finch, C. T., Girard, T. M., et al. 2012, VizieR Online Data Catalog: I/322 [Google Scholar]
Retrieved on 11 Oct 2017, from The Exoplanet Encyclopaedia, 19952017, considering only the stars for which spectral type is reported in the catalogue, and filtering out those not on the main sequence.
Available at https://dace.unige.ch.
Available at https://depts.washington.edu/naivpl/ content/hz-calculator
All Tables
Best-fit solutions for the planetary system orbiting Gl617A: one-Keplerian and two-Keplerian models plus drift.
Best-fit solution for the planetary system orbiting Gl617A, from SOPHIE, CARMENES, and KECK combined data.
Radial velocities for Gl96 derived by template-matching, with the short-term instrumental drift and long-term zero-point corrections applied.
Radial velocities for Gl617A derived by template-matching, with the short-term instrumental drift and long-term zero-point corrections applied.
Physical parameters derived from the MCMC chains used to fit the RV measurements of Gl96.
Parameters probed by the MCMC used to fit the RV measurements of Gl617A – 1-Keplerian model plus quadratic drift.
Physical parameters derived from the MCMC chains used to fit the RV measurements of Gl617A – 1-Keplerian model plus quadratic drift.
Parameters probed by the MCMC used to fit the RV measurements of Gl617A – 2-Keplerian model plus quadratic drift.
Physical parameters derived from the MCMC chains used to fit the RV measurements of Gl617-A – 2-Keplerian model plus quadratic drift.
Parameters probed by the MCMC used to fit the combined SOPHIE, CARMENES, and KECK RV measurements of Gl617A.
Physical parameters derived from the MCMC chains used to fit the combined SOPHIE, CARMENES, and KECK RV measurements of Gl617A.
All Figures
|
Fig. 1 Zero-point drift correction (red line) and radial velocities of the 14 stars used to construct it (black dots). The vertical lines indicate identified jumps and their causes (see Sect. 3 for details). The zero-point correction spans 6 years; it has a dispersion of 3.15 m s−1, and a peak-to-peak variation of 16.9 m s−1. |
| In the text | |
|
Fig. 2 Time series of the radial velocities calculated with template-matching for Gl96 from the SOPHIE+ measurements. |
| In the text | |
|
Fig. 3 Periodogram of (top panel) the radial velocities calculated with template-matching for Gl96 from the SOPHIE+ measurements, corrected from the zero-point drift; (middle panel) the time series of the master correction for the zero-point drift applied; (bottom panel) the uncorrected radial velocities for Gl96 (prior to the application of the master correction). The horizontal lines correspond to 50%, 10%, and 1% FAP, respectively. |
| In the text | |
|
Fig. 4 Periodograms of activity indicators for Gl96 – from top to bottom panels: Hα
index, |
| In the text | |
|
Fig. 5 Periodogram of the residuals of a Keplerian fit with P = 75d to the radial velocities calculated with template-matching for Gl96 from the SOPHIE+ measurements. The horizontal line corresponds to 50% FAP level. |
| In the text | |
|
Fig. 6 l1 periodogram of the SOPHIE RVs for Gl96. The signal at 74 days is clearly predominant, while the other two peaks are probably related to activity. |
| In the text | |
|
Fig. 7 Posterior probability of the orbital eccentricity of Gl96 b under the model including correlated noise. |
| In the text | |
|
Fig. 8 Phase-folded radial velocities of Gl96 for a one-planet model with P = 74.7d. |
| In the text | |
|
Fig. 9 Left panel: marginal likelihood estimated by the Perrakis method vs. sample size for three models: a single Keplerian plus white noise (k1; blue), a quadratic drift plus white noise (k0d2; green), and pure white noise (k0; orange). The one-Keplerian model is clearly favoured by the data. The error bars correspond to the 95% confidence interval. Right panel: histogram of 1000 Monte Carlo realisations of the Bayes factor between model k1 and k0 (orange) and k0d2 (green); the solid curves are normal distributions with the mean and variance equal to those of the Monte Carlo sample. |
| In the text | |
|
Fig. 10 Calculated orbit for Gl96 b with respect to the optimistic and conservative habitable zones, as defined by Kopparapu et al. (2013b). |
| In the text | |
|
Fig. 11 Time series of the radial velocities calculated with template-matching for Gl617A from the SOPHIE+ measurements. |
| In the text | |
|
Fig. 12 Periodograms: radial velocities calculated with template-matching for Gl617A from the SOPHIE+ measurements, corrected for the zero-point drift (top panel); middle panel: master correction for the zero-point drift applied; bottom panel: uncorrected radial velocities for Gl617A (prior to the application of the master correction). The horizontal lines correspond to 50%, 10%, and 1% FAP, respectively. |
| In the text | |
|
Fig. 13 Periodograms of activity indicators for Gl617A. From top to bottom panels: Hα index, |
| In the text | |
|
Fig. 14 Periodogram of the residuals of a Keplerian fit with P = 86d to the radial velocities calculated with template-matching for Gl617A from the SOPHIE+ measurements. The horizontal lines correspond to 50% and 10% FAP, respectively. |
| In the text | |
|
Fig. 15 l1periodogram of the SOPHIE RVs for Gl617A. The signal at 86 days is clearly predominant, while that at 21 days is probably related to activity. The ~500d signal is discussed in the text. |
| In the text | |
|
Fig. 16 Phase-folded radial velocities of Gl617A for a P = 86d planet, using the parameters derived from the two-Keplerian model. |
| In the text | |
|
Fig. 17 Phase-folded radial velocities of Gl617A for a P = 497d planet, using the parameters derived from the two-Keplerian model. |
| In the text | |
|
Fig. 18 Calculated orbit for Gl617A b with respect to the optimistic and conservative habitable zones, as defined by Kopparapu et al. (2013b). |
| In the text | |
|
Fig. 19 Periodograms: combined SOPHIE, CARMENES, and KECK radial velocities of Gl617A (top panel); bottom panel: residuals of a Keplerian fit with P = 86d to the data. The horizontal lines correspond to 50%, 10%, and (top panel only) 1% FAP, respectively. |
| In the text | |
|
Fig. 20 Phase-folded radial velocities of Gl617A for a P = 86d planet, using the combined SOPHIE, CARMENES, and KECK data. |
| In the text | |
|
Fig. 21 HIPPARCOS photometry for Gl96 (top panel) and its corresponding periodogram (bottom panel). |
| In the text | |
|
Fig. 22 HIPPARCOS photometry for Gl617A (top panel) and its corresponding periodogram (bottom panel). |
| In the text | |
|
Fig. 23 Orbital period vs. minimum mass for planets around M-dwarfs detected by radial velocities or transits. Each point represents a planet, with Gl96 b indicated by a pentagon and Gl617A b by a diamond. The colours indicate the orbital eccentricity. |
| In the text | |
Current usage metrics show cumulative count of Article Views (full-text article views including HTML views, PDF and ePub downloads, according to the available data) and Abstracts Views on Vision4Press platform.
Data correspond to usage on the plateform after 2015. The current usage metrics is available 48-96 hours after online publication and is updated daily on week days.
Initial download of the metrics may take a while.