Fig. 12
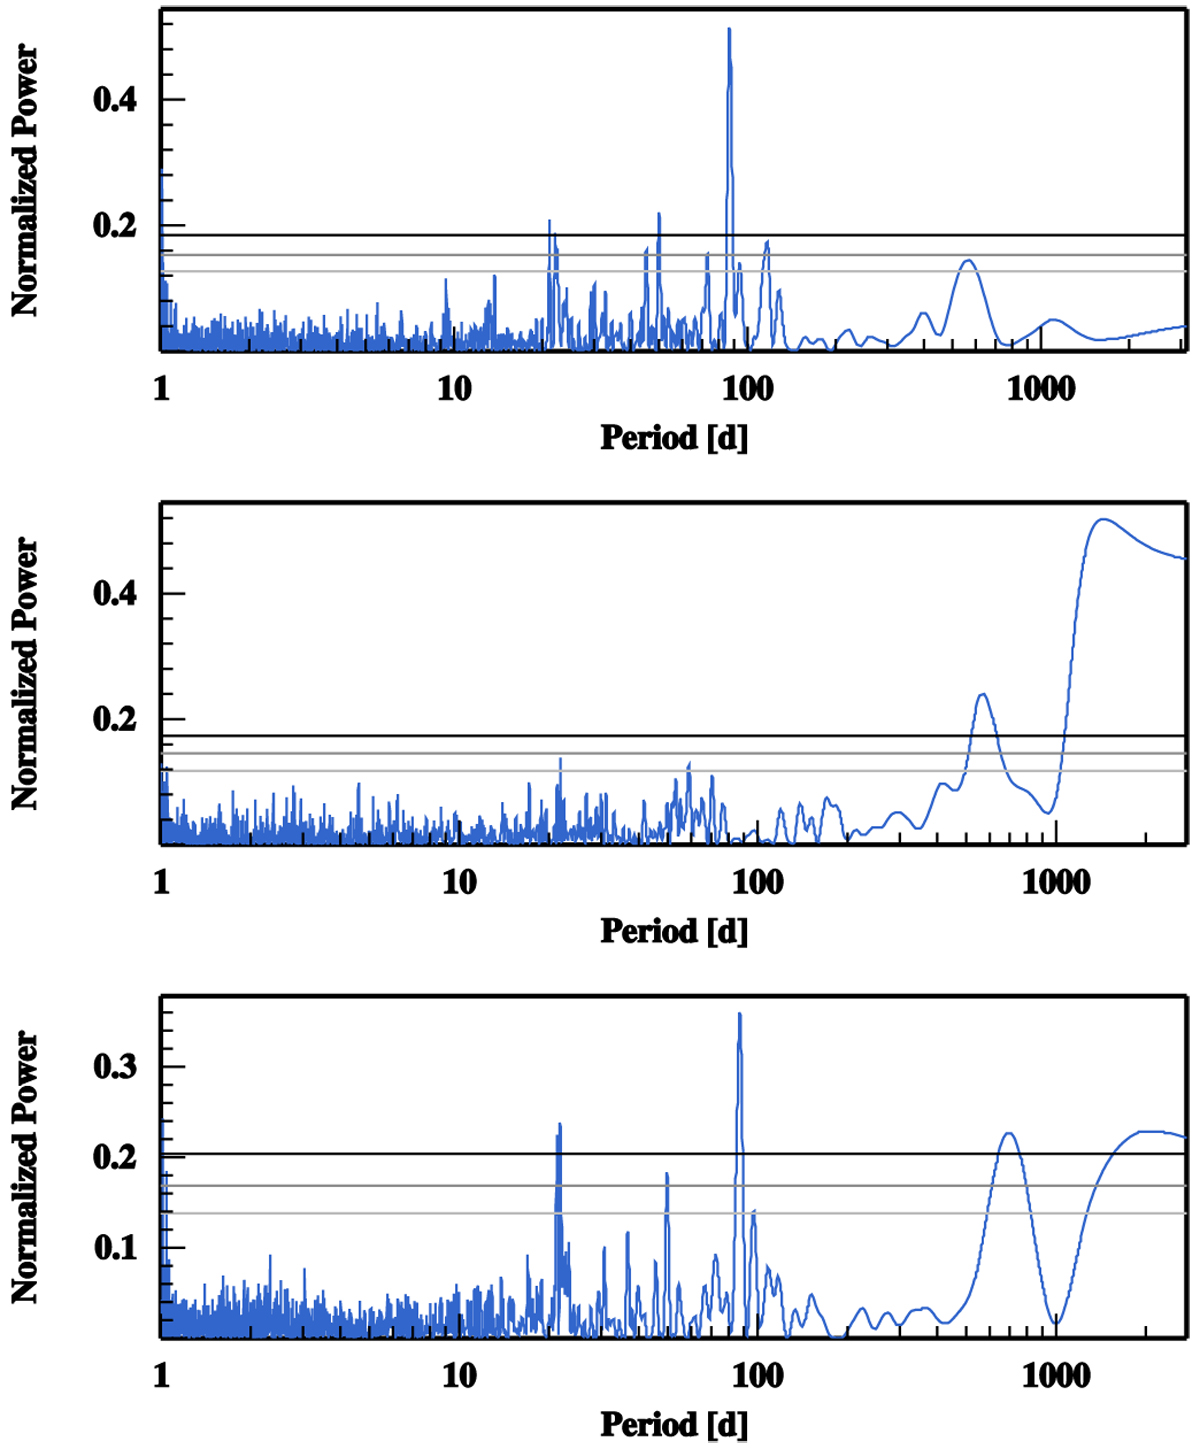
Periodograms: radial velocities calculated with template-matching for Gl617A from the SOPHIE+ measurements, corrected for the zero-point drift (top panel); middle panel: master correction for the zero-point drift applied; bottom panel: uncorrected radial velocities for Gl617A (prior to the application of the master correction). The horizontal lines correspond to 50%, 10%, and 1% FAP, respectively.
Current usage metrics show cumulative count of Article Views (full-text article views including HTML views, PDF and ePub downloads, according to the available data) and Abstracts Views on Vision4Press platform.
Data correspond to usage on the plateform after 2015. The current usage metrics is available 48-96 hours after online publication and is updated daily on week days.
Initial download of the metrics may take a while.